
Key Takeaways
-
OriginTrail (TRAC) has surged around 12% in a single day, drawing renewed attention to the token.
-
TRAC has broken out from an ascending triangle near $0.46 on the daily chart, signaling growing bullish momentum.
-
Similar breakout structures in July and October 2025 previously led to strong rallies of 63% and 113%.
-
Holding the $0.44–$0.46 zone as support will be crucial to keep the bullish fractal setup intact.
-
If the pattern plays out, TRAC could attempt a move toward its long-term ascending resistance above $1.00.
OriginTrail, the decentralized knowledge graph protocol, is stepping back into the spotlight as its native token TRAC records a strong 12% daily surge. Beyond the price jump, the real signal is coming from the charts, where a familiar fractal breakout structure is starting to emerge on the daily timeframe, hinting that a larger upside move could be forming.
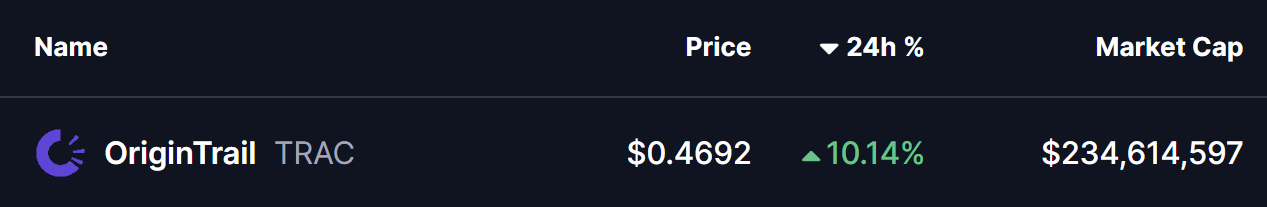
Source: Coinmarketcap
Fractal Breakout Hints at Potential Upside Move
On the daily chart, TRAC has confirmed a breakout from an ascending triangle pattern near the $0.46 level. This breakout is particularly important as price is now trading just above the 200-day moving average, a level that has historically acted as a major trend-defining zone for TRAC.
What makes this setup more compelling is its similarity to previous breakout phases. In late July 2025, a comparable structure resulted in a 63% upside move after price held above its breakout base. Later, in early October 2025, TRAC broke out from a right-angled descending broadening wedge pattern. That move was followed by a reclaim of the 200-day moving average and ultimately led to a powerful 113% rally.
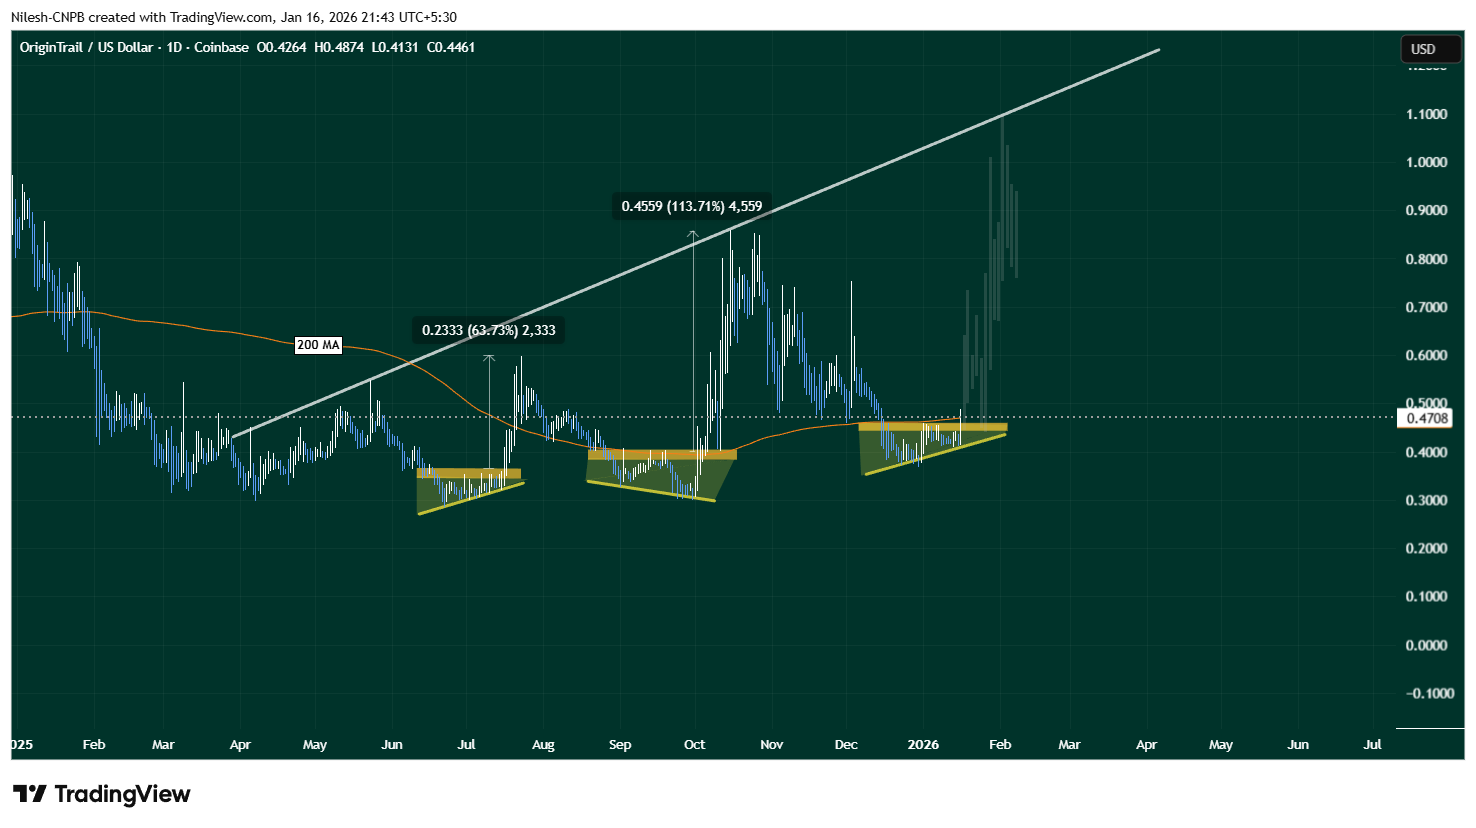
OriginTrail (TRAC) Daily Chart/Coinsprobe (Source: Tradingview)
The current setup shares key characteristics with those earlier moves. Price compression, a clean breakout, and interaction with the 200-day MA suggest that TRAC may once again be transitioning from consolidation into expansion.
What’s Next for TRAC?
If this fractal breakout plays out as expected, holding the $0.44–$0.46 zone as support will be crucial. A sustained hold above this range, along with continued strength above the 200-day moving average, could act as a launchpad for further upside.
In that scenario, TRAC may attempt a move toward its long-term ascending resistance trendline, which currently sits above the $1.00 level. A push toward that zone would align closely with the magnitude of prior fractal-driven rallies seen on the chart.
That said, fractal patterns are never guarantees. Broader market conditions, liquidity, and overall sentiment will continue to influence price action. A failure to hold the $0.44–$0.46 support zone or a rejection back below the 200-day moving average could invalidate the breakout and weaken the bullish fractal thesis.
Bottom Line
TRAC is showing early signs of another technically significant breakout, supported by historical fractal behavior and a reclaim of a key long-term moving average. If buyers can defend the current support zone, the chart suggests that OriginTrail may be positioning itself for a larger upside move in the weeks ahead.
Disclaimer: The views and analysis presented in this article are for informational purposes only and reflect the author’s perspective, not financial advice. Technical patterns and indicators discussed are subject to market volatility and may or may not yield the anticipated results. Investors are advised to exercise caution, conduct independent research, and make decisions aligned with their individual risk tolerance.
About Author: Nilesh Hembade is the Founder and Lead Author of Coinsprobe, with over 5 years of experience in the cryptocurrency and blockchain industry. Since launching Coinsprobe in 2023, he has been providing daily, research-driven insights through in-depth market analysis, on-chain data, and technical research.
Disclaimer: The information on this page may come from third parties and does not represent the views or opinions of Gate. The content displayed on this page is for reference only and does not constitute any financial, investment, or legal advice. Gate does not guarantee the accuracy or completeness of the information and shall not be liable for any losses arising from the use of this information. Virtual asset investments carry high risks and are subject to significant price volatility. You may lose all of your invested principal. Please fully understand the relevant risks and make prudent decisions based on your own financial situation and risk tolerance. For details, please refer to
Disclaimer.
Related Articles
ETH 15分钟急跌1.53%:大户短线减仓与ETF资金流出共振引发放量下挫
2026-03-06 13:45 至 2026-03-06 14:00(UTC),ETH价格出现明显异动,短线下跌1.53%,价格在2019.21至2051.26 USDT区间剧烈波动,振幅达到1.56%。高频卖单集中涌现,市场关注度骤升,成交量放大,多空分歧加剧,市场情绪趋于谨慎。
本次异动的主要驱动力是大户及鲸鱼账户在短线反弹后集中减仓,带动高额卖盘迅速释放,触发市场短时抛压。ETF层面持
GateNewsJust Now
BTC短线下跌1.23%:巨鲸资金流出与杠杆多头清算引发集中抛售
2026-03-06 13:45至14:00(UTC),比特币(BTC)价格在15分钟内收益率录得-1.23%,价格区间为69219.0至70086.3 USDT,振幅达到1.24%。短时间内交易活跃度显著提升,市场聚焦于剧烈波动与风险情绪再度升高。
本次异动的主要驱动力是链上巨鲸资金持续流出以及衍生品市场的大规模杠杆多头清算。根据链上数据,巨鲸提款量单日高达16972 BTC,Whales O
GateNewsJust Now
Samson Mow Objects to Michael Saylor's Bitcoin Insufficiency Post - U.Today
The debate over Bitcoin's supply scarcity is highlighted by Michael Saylor's claim that there isn't enough Bitcoin for everyone, which Samson Mow counters with calculations showing each person could receive around 259,259 satoshis if distributed globally. Mow's argument underscores the reality that large entities hold significant portions of Bitcoin, emphasizing its scarcity and potential value.
UToday1h ago
Dogecoin (DOGE) Lost 50% of Its Volume: Will It Actually Affect Price? - U.Today
Dogecoin's bearish streak not ending
Trading volume melts
As trading activity around the meme asset drastically decreases, Dogecoin is once again under pressure. DOGE has seen a sharp decline in volume over the past day, with activity on major exchanges dropping by about 50%. The asset's lack
UToday1h ago
XRP Price: Below $1 or Spike to $2 Are Main Scenarios in Upcoming Volatility Surge - U.Today
Price squeezed
More challenges for sellers
Two opposing forces on the XRP chart, an ascending support trendline formed from the recent February lows, and a descending 26-day exponential moving average acting as resistance, are creating a compression structure, as the asset has been trading in an
UToday2h ago
Trump Tariff Refund Comes to Billions, What's For the Crypto Market?
Tariff refunds of $168-$182 billion are anticipated following Trump's imposed tariffs, which may rise from 10% to 15%. Concurrently, the crypto market faces volatility, influenced by geopolitical tensions and recent price retracements.
TheNewsCrypto2h ago