
Date: Sun, Dec 21 2025 | 08:56 AM GMT
The broader cryptocurrency market has remained under pressure over the past several weeks, following the sharp sell-off that began on October 10. That corrective phase dragged Ethereum (ETH) down by nearly 23% over the last 60 days and weighed heavily on overall market sentiment. While many altcoins have struggled to stabilize, Quant (QNT) has shown relative resilience, posting only a modest decline and holding above a historically important support zone.
From a technical perspective, the daily chart suggests that QNT may be approaching a critical decision point, with price action forming a recognizable structure that could influence its next directional move.
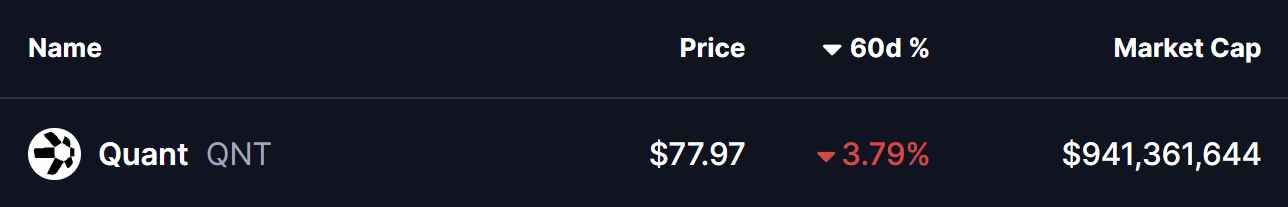
Source: Coinmarketcap
Head and Shoulders Pattern Takes Shape
On the daily timeframe, QNT appears to be carving out a head and shoulders formation, a well-known pattern that often signals a potential trend shift once the neckline is tested. Earlier in the structure, QNT formed the left shoulder before rallying sharply to its head near the $100 region. From there, price reversed lower and slid back toward the neckline, located around the $70 support zone.
This $70 area has proven to be a strong demand zone in the past, repeatedly attracting buyers and preventing deeper declines. The recent move into this region was met with a noticeable reaction, as reflected by the long lower wick on the chart. That rejection from support pushed price back toward the $78 level, suggesting that buyers are actively defending the neckline and potentially forming the right shoulder of the pattern.
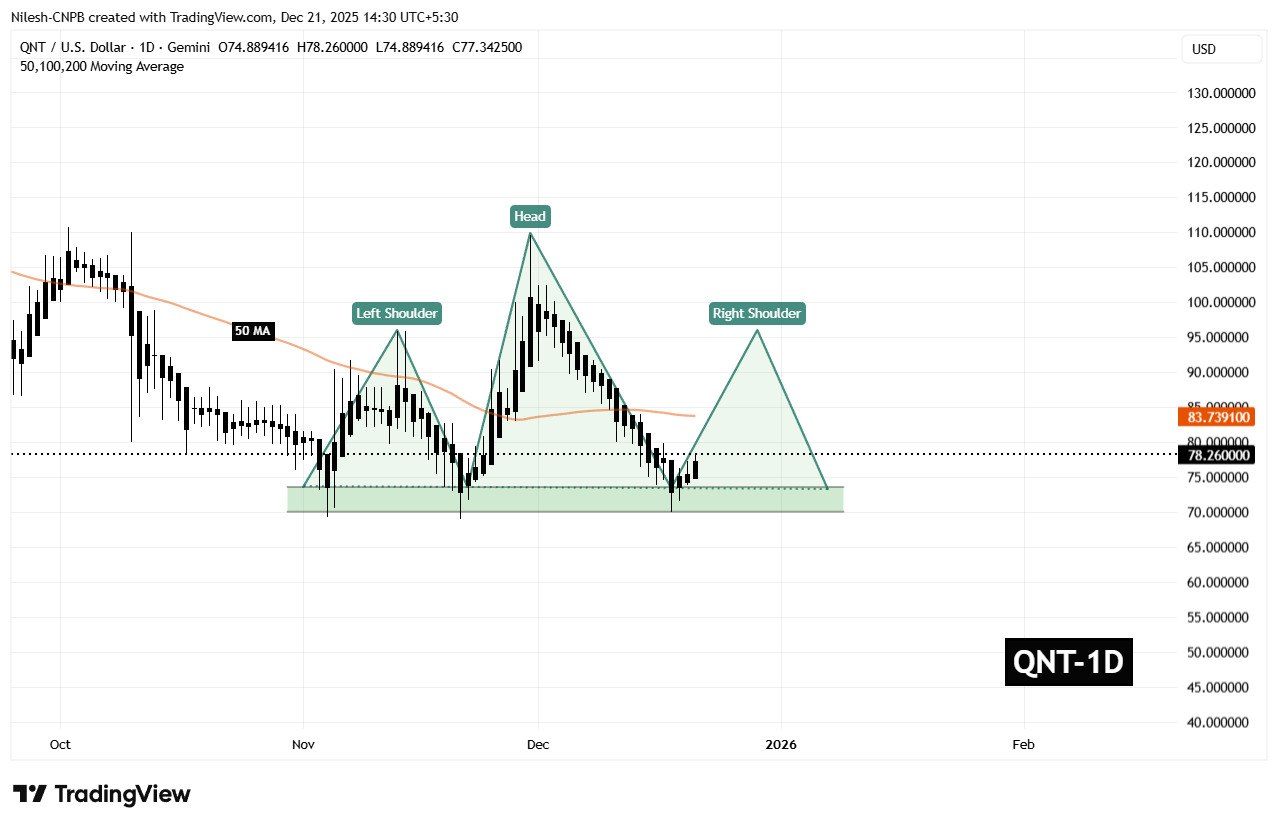
Quant (QNT) Daily Chart/Coinsprobe (Source: Tradingview)
The behavior around this zone is critical. A successful defense of the neckline often opens the door for a relief rally, especially if broader market conditions stabilize.
What’s Next for QNT?
For bullish momentum to build, QNT needs to reclaim the 50-day moving average, currently sitting near $83.73. This level now acts as a key short-term resistance, and a daily close above it would signal a shift in momentum back in favor of buyers.
If that recovery unfolds, the chart points toward a potential move into the $95.90 region. Such a move would represent a rebound of roughly 22% from current levels and align with the typical reaction seen during the right-shoulder phase of this pattern. A rally of this nature would not only ease recent selling pressure but also place QNT back into a more neutral technical posture.
That said, the setup remains delicate. If the $70 neckline support fails to hold on a sustained basis, the head and shoulders structure would remain bearish, opening the door to further downside and extending the corrective phase. For now, all eyes remain on how price behaves around this key support and whether buyers can regain control above the moving average.
Disclaimer: The views and analysis presented in this article are for informational purposes only and reflect the author’s perspective, not financial advice. Technical patterns and indicators discussed are subject to market volatility and may or may not yield the anticipated results. Investors are advised to exercise caution, conduct independent research, and make decisions aligned with their individual risk tolerance.
Disclaimer: The information on this page may come from third parties and does not represent the views or opinions of Gate. The content displayed on this page is for reference only and does not constitute any financial, investment, or legal advice. Gate does not guarantee the accuracy or completeness of the information and shall not be liable for any losses arising from the use of this information. Virtual asset investments carry high risks and are subject to significant price volatility. You may lose all of your invested principal. Please fully understand the relevant risks and make prudent decisions based on your own financial situation and risk tolerance. For details, please refer to
Disclaimer.
Related Articles
Short-selling firm Culper releases bearish report on Ethereum: Fusaka upgrade disrupts ETH token economics
Aggressive short-selling firm Culper Research has released a report bearish on Ethereum (ETH), believing that the Fusaka upgrade in 2025 will cause structural damage to ETH's token economy. The report points out that a significant decrease in Gas fees has led to increased address pollution attacks and reduced validator rewards, and emphasizes that Ethereum is facing competitive pressure from Solana and L2 solutions. Culper believes that ETH's value capture ability is declining and has started shorting ETH.
ChainNewsAbmedia24m ago
Geopolitical Turmoil! Dalio Declares "Gold is the Only True God," but Its Safe-Haven Performance Trails Bitcoin
As geopolitical tensions in the Middle East escalate, Bridgewater founder Ray Dalio questions Bitcoin and reaffirms gold as the preferred safe haven. Nevertheless, gold prices fell accordingly, while Bitcoin only experienced a slight correction, indicating that the correlation between the two is weakening. Dalio doubts Bitcoin's transparency and future risks, but he still maintains a small allocation of Bitcoin for diversification.
区块客34m ago
Zcash (ZEC) at the important crossroads: What could happen in the next few weeks?
Zcash (ZEC) shows signs of stabilization after declining from over 700 USD, with price nearing critical support around 200 USD. Recent recovery indicates buyer strength, but momentum indicators suggest caution. A breakout above 250 USD could initiate further recovery.
TapChiBitcoin36m ago
ETH 15-minute sharp decline of 1.53%: Large investors' short-term profit-taking and ETF capital outflows resonate, triggering a significant drop
From 13:45 to 14:00 on March 6, 2026 (UTC), ETH experienced a significant fluctuation, with a short-term decline of 1.53%. The price fluctuated sharply between 2019.21 and 2051.26 USDT, with an amplitude of 1.56%. High-frequency sell orders surged, market attention spiked, trading volume increased, and the divergence between bulls and bears intensified. Market sentiment became more cautious.
The main driving force behind this fluctuation was large investors and whale accounts reducing their positions after a short-term rebound, leading to a rapid release of large sell orders and triggering short-term selling pressure in the market. On the ETF front, holdings
GateNews36m ago
BTC short-term decline of 1.23%: whale fund outflows and leveraged long liquidations trigger concentrated selling
On 2026-03-06 from 13:45 to 14:00 (UTC), the price of Bitcoin (BTC) experienced a -1.23% return over 15 minutes, with a price range of 69,219.0 to 70,086.3 USDT, and an amplitude of 1.24%. Trading activity significantly increased in a short period, with the market focusing on intense volatility and a resurgence of risk sentiment.
The main drivers of this anomaly are continuous outflows of on-chain whale funds and large-scale leveraged long liquidations in the derivatives market. According to on-chain data, whale withdrawals reached as high as 16,972 BTC in a single day, Whales O
GateNews37m ago
Samson Mow Objects to Michael Saylor's Bitcoin Insufficiency Post - U.Today
The debate over Bitcoin's supply scarcity is highlighted by Michael Saylor's claim that there isn't enough Bitcoin for everyone, which Samson Mow counters with calculations showing each person could receive around 259,259 satoshis if distributed globally. Mow's argument underscores the reality that large entities hold significant portions of Bitcoin, emphasizing its scarcity and potential value.
UToday2h ago