VINE Price Prediction: Three Key Technical Indicators Point to the Next Volatility Zone

2025-08-07 03:49:59
Beginner
Quick Reads
This article delivers a professional technical analysis of VINE’s price forecasts, leveraging moving averages, trading volume, and the Relative Strength Index (RSI). It breaks down short-term support and resistance levels to guide newcomers in seizing timely entry points and profit-taking opportunities.

Technical Analysis Overview


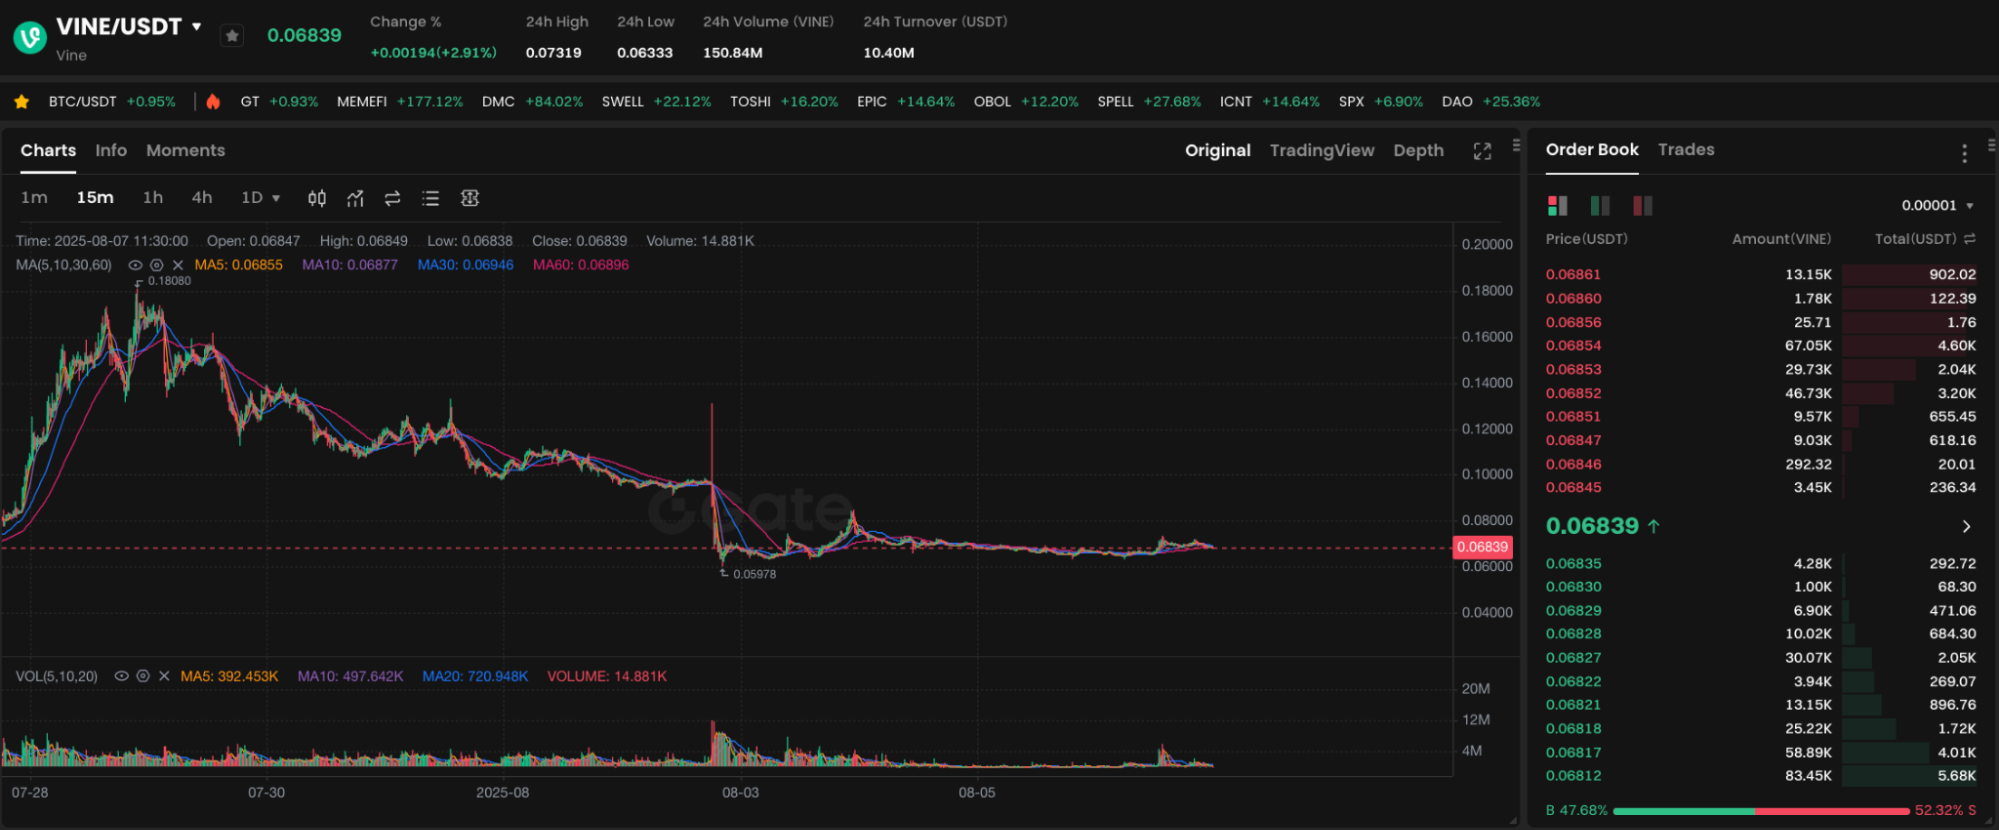
Chart: https://www.gate.com/trade/VINE_USDT

As of August 7, 2025, the latest VINE/USDT price stands at 0.06828 USDT, with a 24-hour volatility of approximately ±5%. Given its highly speculative nature, VINE frequently displays a rapid surge followed by either consolidation or a pullback, then a subsequent breakout in the short term. Technical indicators can offer valuable insights to identify the next potential trading range.

Short-Term Support and Resistance Forecast

1. Major support levels

  • 0.06 USDT: Strong support, repeatedly tested and rebounded over the past two weeks
  • 0.055 USDT: Secondary support; a break below this level may indicate a decline toward 0.05 USDT

2. Key resistance levels

  • 0.075 USDT: The price failed to break out multiple times recently
  • 0.083–0.085 USDT: Strong resistance zone near historical highs

If VINE holds above 0.06 USDT, short-term price action may fluctuate between 0.06 and 0.075 USDT. A breakout above resistance could pave the way to test 0.085 USDT.

Moving Average System Signals

  • 5-day MA (MA5): Currently trending upward, signaling renewed buying interest in the short term
  • 20-day MA (MA20): MA5 has attempted to cross above MA20 on several occasions; a successful golden cross would signal further upside momentum
  • 60-day MA (MA60): Price remains above MA60. While the long-term trend is not yet defined, the narrowing gap between MA20 and MA60 may signal an increased risk of pullbacks

If MA5 crosses and stays above MA20, a short-term move toward upper resistance is possible. Conversely, if VINE falls below MA20, it may return to the MA60 range for support.

Volume and Volatility Outlook

  • Trading volume: Over the past 7 days, volume initially increased and then decreased, suggesting a slowdown in short-term capital inflows. If volume spikes at key resistance zones, it could confirm a breakout
  • Historical volatility: 30-day volatility reached as high as 120%, with market sentiment easily swayed by news and community-driven headlines. Without major breakthrough events, prices are likely to consolidate between support and resistance levels, awaiting the next sentiment-driven rally

Beginner Trading Strategy Recommendations

  • Staggered order entry: Accumulate positions in three separate tranches between 0.06–0.065 USDT rather than entering all at once
  • Monitor moving average crossovers: If MA5 crosses above MA20, consider adding to your position. Otherwise, take profits during price rallies
  • Set clear take-profit and stop-loss levels: Target profits in the 0.075–0.08 USDT range and ensure losses do not exceed 0.055 USDT
  • Watch for news catalysts: Short-term events (such as influencer endorsements or community developments) can trigger unexpected volatility. Stay updated with official announcements

Conclusion

Technical analysis indicates a high likelihood of VINE trading between 0.06–0.075 USDT in the near term. A breakout could drive the price up to 0.085 USDT, while a breakdown may see a retreat to 0.055 USDT. Beginners should combine moving average signals and volume trends to develop disciplined entry and exit strategies to capitalize on trading opportunities in this high-volatility environment.

Author: Max
Disclaimer
* The information is not intended to be and does not constitute financial advice or any other recommendation of any sort offered or endorsed by Gate.
* This article may not be reproduced, transmitted or copied without referencing Gate. Contravention is an infringement of Copyright Act and may be subject to legal action.

Share

Crypto Calendar
Tokenların Kilidini Aç
Wormhole, 3 Nisan'da 1.280.000.000 W token açacak ve bu, mevcut dolaşımdaki arzın yaklaşık %28,39'unu oluşturacak.
W
-7.32%
2026-04-02
Tokenların Kilidini Aç
Pyth Network, 19 May'da 2.130.000.000 PYTH tokenini serbest bırakacak ve bu, mevcut dolaşım arzının yaklaşık %36,96'sını oluşturacak.
PYTH
2.25%
2026-05-18
Tokenların Kilidini Aç
Pump.fun, 12 Temmuz'da 82,500,000,000 PUMP token'ı kilidini açacak ve bu, mevcut dolaşımdaki arzın yaklaşık %23,31'ini oluşturacak.
PUMP
-3.37%
2026-07-11
Token Kilidi Açma
Succinct, 5 Ağustos'ta mevcut dolaşımdaki arzın yaklaşık %104,17'sini oluşturan 208,330,000 PROVE token'ını serbest bırakacak.
PROVE
2026-08-04
sign up guide logosign up guide logo
sign up guide content imgsign up guide content img
Sign Up

Related Articles

What is Fartcoin? All You Need to Know About FARTCOIN
Intermediate

What is Fartcoin? All You Need to Know About FARTCOIN

Fartcoin (FARTCOIN) is a representative meme coin within the Solana ecosystem based on an AI-driven narrative. Its core concept originated from an experiment aimed at exploring the "boundaries between AI Agents and humor." More than just a digital asset with social attributes, the project deeply couples absurd humor culture with on-chain financial logic by integrating autonomous AI interaction models.
2026-03-04 05:38:51
Gold Price Forecast for the Next Five Years: 2026–2030 Trend Outlook and Investment Implications, Could It Reach $6,000?
Beginner

Gold Price Forecast for the Next Five Years: 2026–2030 Trend Outlook and Investment Implications, Could It Reach $6,000?

Analyze current gold price trends alongside authoritative five-year forecasts, integrating an evaluation of market risks and opportunities. This gives investors insight into the potential trajectory of gold prices and the main drivers expected to shape the market over the next five years.
2026-01-26 03:33:33
2026 Silver Price Forecast: Bull Market Continuation or High-Level Pullback? In-Depth Analysis of Silver Candlestick Chart
Beginner

2026 Silver Price Forecast: Bull Market Continuation or High-Level Pullback? In-Depth Analysis of Silver Candlestick Chart

2026 Silver Price Forecast: Latest Outlook This article integrates current market trends, silver candlestick chart analysis, and momentum factors to assess the potential key support and resistance levels, upside targets, and pullback risks for silver prices. The goal is to help investors make informed, rational decisions.
2026-01-28 08:36:39
Crypto Future Profit Calculator: How to Calculate Your Potential Gains
Beginner

Crypto Future Profit Calculator: How to Calculate Your Potential Gains

Crypto Future Profit Calculator helps traders estimate potential earnings from futures contracts by considering entry price, leverage, fees, and market movement.
2025-02-09 17:28:28
Crypto Futures Calculator: Easily Estimate Your Profits & Risks
Beginner

Crypto Futures Calculator: Easily Estimate Your Profits & Risks

Use a crypto futures calculator to estimate profits, risks, and liquidation prices. Optimize your trading strategy with accurate calculations.
2025-02-11 02:25:44
What is Oasis Network (ROSE)?
Beginner

What is Oasis Network (ROSE)?

The Oasis Network is driving the development of Web3 and AI through smart privacy technology. With its privacy protection, high scalability, and cross-chain interoperability, the Oasis Network is providing new possibilities for the future development of decentralized applications.
2025-05-20 09:41:15