Macroeconomic Landscape and Gold Price Overview
As of December 2025, international spot gold remains near $4,200 per ounce, fluctuating at elevated levels (with slight price differences across trading platforms). In an environment of increased volatility among major global risk assets, gold’s traditional role as a safe-haven asset has once again captured significant market attention.
The market’s primary focus centers on the imminent shift in Federal Reserve policy. With US inflation steadily declining and economic growth momentum slowing, expectations for interest rate cuts have become a leading short-term sentiment. Meanwhile, changes in the US Dollar Index and global physical gold demand—particularly consumption and central bank purchases in Asia—are jointly shaping gold’s current price dynamics.
As the policy window approaches, the market as a whole is exhibiting “high-level observation and cautious trading,” with capital waiting for more definitive interest rate guidance.
Why the Fed and Interest Rates Drive Gold
Gold is inherently a non-yielding asset, and its price is strongly inversely correlated with real interest rates. When markets anticipate rate cuts or a decline in real rates, the opportunity cost of holding gold drops, prompting capital to flow into precious metals and driving gold prices higher.
From Q4 2025 onward, expectations for the Federal Reserve’s rate-cut cycle have intensified. Gold’s ability to remain above $4,000 under these conditions highlights its robust trend resilience.
Nevertheless, short-term risks persist:
- If the Fed signals a hawkish stance and emphasizes keeping rates higher for longer, gold may face temporary downward pressure;
- If inflation data unexpectedly rebounds, the pace of rate cuts could be delayed, triggering a short-term pullback.
Looking further ahead, some institutions have raised their gold price targets for the second half of 2026. This reflects a strong market consensus on the long-term benefits of monetary easing, fiscal pressure, and de-dollarization trends. However, heightened short-term volatility is almost inevitable in this process.
Technical Analysis: Decoding the Current Gold Candlestick Structure
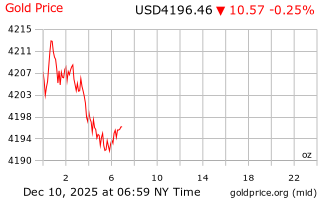
Chart: https://goldprice.org/
On the daily gold candlestick chart, prices are repeatedly testing the $4,170–$4,230 range, forming a clear high-level consolidation pattern.
Key technical highlights include:
- Trend structure: The medium-term trendline is still rising, indicating the overall direction remains bullish;
- Major support: $4,170 marks the lower boundary of the previous consolidation zone and serves as a critical short-term pivot;
- Major resistance: The $4,230–$4,250 area features dense trading activity and resistance from previous highs;
- Fibonacci retracement: Prices are repeatedly testing the 61.8% retracement level, which often determines whether the trend will continue.
If gold can firmly hold above $4,200 and break through $4,230 with increased volume, the upside may reopen. Conversely, a drop below $4,170 accompanied by heavy selling could target lower support zones in the short term.
In live trading, market participants typically also consider:
- Volume changes
- Candlestick patterns (such as hammer, engulfing, evening star, etc.)
to enhance precision in entry and stop-loss placement.
Short- and Medium-Term Price Forecasts: Three Scenario Analysis
Optimistic Scenario
If the Federal Reserve clearly initiates a rate-cut cycle in the coming months and the US Dollar Index weakens, with global safe-haven flows continuing into precious metals ETFs, gold could rise further to challenge and stabilize above $4,500 per ounce, potentially entering a new phase of accelerated growth.
Neutral Scenario
If the pace of rate cuts fluctuates and market expectations are repeatedly revised, gold may enter a high-level range-bound consolidation, trading between roughly $3,900 and $4,400, using time to await the next macro catalyst.
Pessimistic Scenario
If inflation unexpectedly rebounds in the short term and the dollar strengthens temporarily, coupled with a recovery in risk assets that reduces safe-haven demand, gold could retreat to the key support zone of $3,800–$3,900 for mid-term consolidation.
Risk Warnings and Practical Trading Guidance
Risk Management
- Set strict stop-loss orders to avoid holding positions during periods of high volatility;
- Limit the size of individual positions to prevent sharp swings triggered by rate decisions and inflation data;
- Pay close attention to event-driven risks, such as Federal Reserve rate decisions and dot plot projections, CPI/PCE inflation data, and sudden geopolitical conflicts.
Practical Trading Strategies
- Short-term traders: Can use gold candlestick chart support and resistance levels for range trading, managing holding periods;
- Medium-term investors: Should focus on accumulating positions during pullbacks, avoiding chasing high prices;
- Long-term holders: May adopt dollar-cost averaging to allocate gold as part of a long-term “inflation hedge and safe-haven asset” strategy.
Asset Allocation Advice
Gold is best utilized as a diversification tool alongside bonds and equities, rather than as a concentrated holding. This approach helps smooth overall asset volatility during periods of rising macro uncertainty.