Recent on-chain data indicates that addresses linked to Vitalik Buterin have been steadily selling ETH in batches since early February. These transactions occurred as ETH hovered near a critical technical support zone, prompting widespread market discussion.
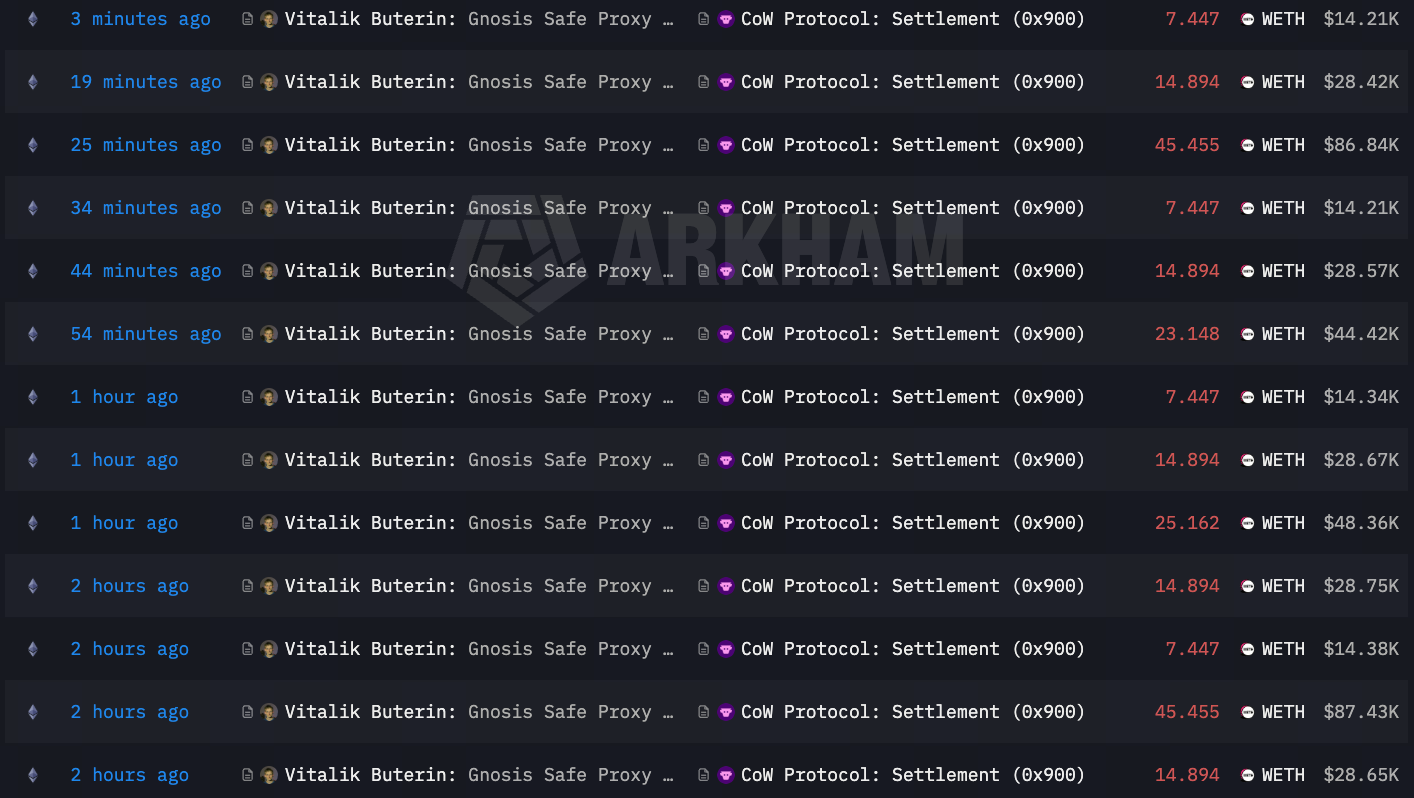
Source: https://intel.arkm.com/explorer/address/0xfEB016D0D14AC0Fa6d69199608B0776d007203B2
This article objectively examines the recent selling activity using publicly available on-chain data, market structure, and price action, and evaluates its potential impact on Ethereum and the ETH market.
1. On-Chain Data Overview: Sale Scale and Structural Characteristics
According to on-chain monitoring tools:
- Since February 2, more than 11,000 ETH have been sold in total (as of February 25, 2026, 8:30 UTC+8)
- The average sale price was approximately $2,000
- Transactions were executed in multiple small batches
The execution of these sales shows the following structural features:
- No concentrated selling: There were no single, large-scale liquidations.
- Gradual pace: Sales were spread across different time periods.
- Diversified fund destinations: Some proceeds were converted to stable assets or deployed in DeFi interactions.
This approach more closely resembles asset management rather than a typical trend-driven exit.
It is important to note that on-chain address labeling relies on third-party analytics and is not an official identity declaration. However, the market generally treats these as highly probable associated addresses.
2. Relative Significance of the Sale Scale in the Market
1. Relative to Market Liquidity
ETH’s average daily spot trading volume typically reaches several billion dollars. Selling 10,000+ ETH at $2,000 each totals just over $20 million. From a market depth perspective:
- This scale is not sufficient to create systemic selling pressure
- Exchange liquidity can easily absorb the volume
Therefore, this sale has a limited direct impact on market liquidity structure.
2. Relative to Individual Holdings Proportion
Based on publicly estimated long-term holdings, this sale accounts for a relatively small share.
This indicates:
- This is not a large-scale reduction
- No signs of a strategic withdrawal
3. Price Environment: Sensitive Stage at a Key Support Zone

Source: https://www.gate.com/trade/ETH_USDT
These sales occurred as ETH dropped back to the $1,900 range. The repeatedly tested $2,000 zone, after being decisively breached, shifted from an interim support level to overhead resistance.
Structurally, the $2,000 area was a recent high-volume trading region. Once price fell below this range, the prior long-short equilibrium was disrupted and the market entered a repricing phase. Tokens accumulated in this range may become a source of supply during future rebounds.
Current structural features include:
- Price is trading below the earlier high-volume area
- $2,000 now serves as short-term technical resistance
- The next key support to watch is around $1,850
Overall, ETH is in a structural adjustment phase rather than a clear trend phase. In this context, event-driven factors can be amplified in market interpretation, but their actual price impact must be evaluated in light of liquidity and capital structure.
4. Does This Constitute a Bearish Trend Signal?
To determine whether this signals a bearish trend, consider the following three indicators:
1. Is the Sale Scale Continuously Expanding?
So far, only phased batch selling has been observed, with no evidence of sustained expansion.
2. Is There a Change in Public Stance?
The founder has not issued any negative public statements about Ethereum’s prospects.
3. Are Fundamentals Deteriorating?
Ethereum network:
- No abnormal fluctuations in staking ratio
- Layer 2 ecosystem remains active
- No structural decline in on-chain developer activity
Without fundamental deterioration, individual selling activity alone is not enough to indicate a trend reversal.
5. Historical Behavior Comparison
Historical data shows:
- Vitalik has sold ETH multiple times over the years
- Sales do not always coincide with market tops
- Long-term trends are still driven by market cycles and the macro environment
Past experience suggests:
Founder sales can significantly affect short-term sentiment, but have limited explanatory power for long-term price trends.
6. Key Variables Influencing ETH’s Medium- and Long-Term Trends
Compared to single wallet transactions, more attention should be paid to structural factors such as:
1. Institutional Capital Flows
Changes in ETH-related ETFs and institutional holdings are important for trend assessment.
2. Staking and Circulating Supply Structure
The staking ratio directly affects supply pressure in the market.
If staking remains high, circulating supply is relatively constrained.
3. Ecosystem Activity and Revenue Structure
Key indicators include:
- Gas revenue
- Layer 2 transaction volume
- DeFi TVL changes
These metrics determine the network’s intrinsic value.
4. Macro Liquidity Environment
US dollar interest rate policy and shifts in risk asset preferences have a significant impact on the crypto market.
7. Short- and Medium-Term Scenario Analysis
With ETH trading around $1,900, the market has entered a rebalancing phase. The following scenarios are not forecasts, but conditional analyses based on key price levels and capital variables.
1. Range Consolidation and Volatility Compression
If the $1,850–$1,950 range establishes stable support and net ETH inflows to exchanges remain muted, the market may enter a sideways consolidation phase.
This phase is typically characterized by:
- Gradually declining trading volume
- Derivatives funding rates normalizing
- Decreasing volatility
This structure reflects supply absorption and redistribution, rather than the start of a new trend.
2. Technical Rebound and Resistance Testing
If short covering or increased spot buying emerges, ETH may rebound to test the $2,000 resistance area.
However, without sustained volume and a structural breakout, $2,000 remains a technical resistance level. If momentum fades during the rebound, the move is more likely a technical correction than a trend reversal.
Whether the market can regain and hold above $2,000 will be a key indicator of structural recovery.
3. Continued Downtrend and Liquidity Release
If support near $1,900 weakens and is accompanied by increased net exchange inflows or a significant drop in derivatives positions, the price may continue downward to seek a new high-volume trading zone.
This scenario is usually driven by leverage adjustments and liquidity redistribution. It does not necessarily signal a long-term trend change, but short-term volatility could be amplified.
Current Structural Features
Current trading and on-chain data show no evidence of concentrated selling pressure or a clear trend reversal. ETH remains in a structural rebalancing phase. At this stage, sales by a single address primarily influence market sentiment, while price trends still depend on broader capital and macro variables.
8. Risk Warning
Monitor the following risk factors:
- If the scale of sales increases
- If there is sustained net capital outflow
- If macro risk assets decline in tandem
These factors could amplify volatility.
At the same time, beware of the market overinterpreting individual events.
9. Conclusion
Based on on-chain data and current price structure, this sale does not represent a significant supply shock, nor does it show signs of a concentrated liquidation. On-chain and exchange data do not currently indicate expanding systemic selling pressure, and there are no notable changes in fundamentals.
With ETH trading around $1,900, the focus should be on how price reacts to the $2,000 resistance above and whether support below remains stable. Recent volatility is mainly a reflection of liquidity rebalancing, not a trend reversal.
As a result, sales by a single address primarily affect short-term market sentiment. The medium-term direction will still depend on overall capital flows, changes in derivatives structure, and macroeconomic developments, rather than individual actions alone.