


If the Strait of Hormuz Closes 🤔
Possible Scenarios in Oil, Gold, and Crypto Markets
Due to escalating US-Iran tensions in the Middle East, global markets are focusing on the strategically important Strait of Hormuz. This narrow passage, connecting the Persian Gulf to the Arabian Sea, is considered a critical energy corridor through which approximately 20% of the world's oil trade passes.
Analysts state that the complete or partial closure of this passage could create a chain reaction on global markets.
1. Oil Market: The First Shock
The quickest reaction is expected to be seen in the oil market if the Strait of Hormuz closes.
Possible effects:
Approximately 17-20 million barrels of oil shipments per day would be at risk.
Oil prices could experience a rapid jump of 20-40%.
Brent oil could quickly rise above $100.
The sharp rise in energy prices could accelerate global inflation again. 2. Gold and Safe Haven Assets
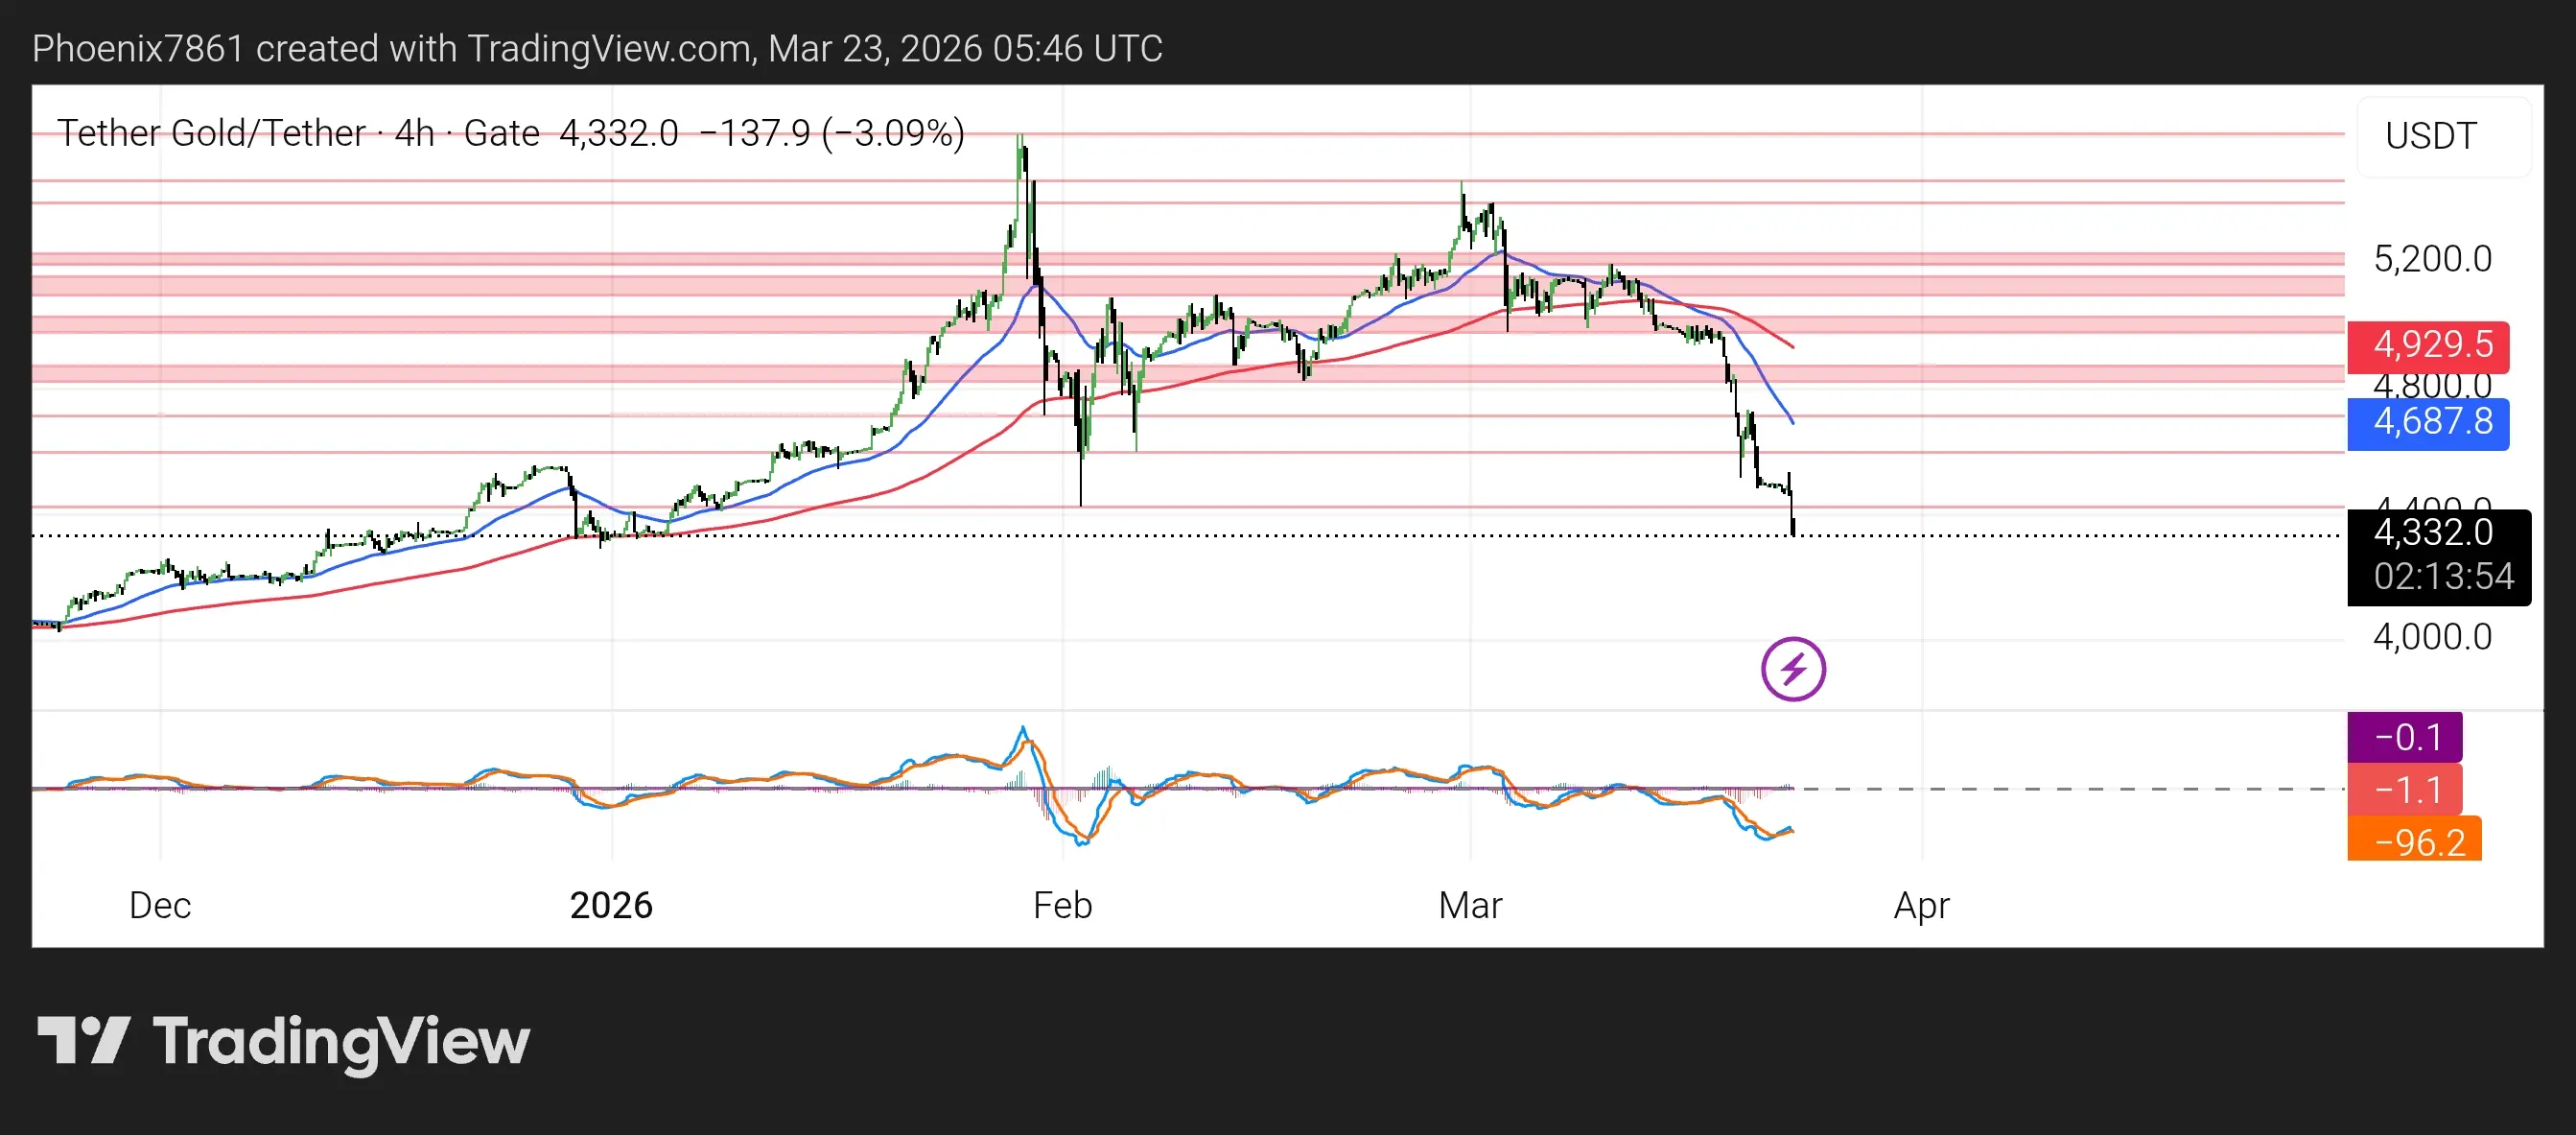
During geopolitical crises, investors often turn to safe havens. Therefore, movements such as:
rapid rise in gold prices
increased demand for US bonds
strengthening of the dollar index
can be observed.
3. Crypto Market: Two Different Scenarios
The crypto market's reaction usually occurs in two phases.
In the Short Term: Volatility
When news of the crisis first emerges, sell-offs may be seen in risky assets. Therefore, short-term declines may occur in major crypto assets such as:
Bitcoin
Ethereum
Medium Term: Digital Safe Haven Narrative
If the crisis continues, some investors may begin to see crypto as an alternative financial system. In this case:
Institutional demand for Bitcoin may increase
stablecoin trading volumes may rise
interest in decentralized finance projects may increase. Among stablecoins, which investors frequently use for trading, especially during crisis periods:
Tether
USD Coin
may stand out.
4. Possible Price Scenarios for Bitcoin
Some scenarios from analysts are as follows:
Scenario 1 – Short-term crisis
Temporary sell-off in the crypto market
Short-term 5-10% pullback in Bitcoin
Scenario 2 – Prolonged geopolitical crisis
Energy prices rise
Inflation expectations increase
Bitcoin may regain strength with the "digital gold" narrative.
In conclusion
A potential crisis in the Strait of Hormuz could directly affect not only energy markets but also crypto assets. Although volatility may increase in the short term, in the long term, Bitcoin, in particular, is expected to come to the forefront more as an alternative financial asset against geopolitical risks.
#GoldAndSilverMoveHigher
#CryptoMarketBouncesBack
#OilPricesPullBack
Possible Scenarios in Oil, Gold, and Crypto Markets
Due to escalating US-Iran tensions in the Middle East, global markets are focusing on the strategically important Strait of Hormuz. This narrow passage, connecting the Persian Gulf to the Arabian Sea, is considered a critical energy corridor through which approximately 20% of the world's oil trade passes.
Analysts state that the complete or partial closure of this passage could create a chain reaction on global markets.
1. Oil Market: The First Shock
The quickest reaction is expected to be seen in the oil market if the Strait of Hormuz closes.
Possible effects:
Approximately 17-20 million barrels of oil shipments per day would be at risk.
Oil prices could experience a rapid jump of 20-40%.
Brent oil could quickly rise above $100.
The sharp rise in energy prices could accelerate global inflation again. 2. Gold and Safe Haven Assets
During geopolitical crises, investors often turn to safe havens. Therefore, movements such as:
rapid rise in gold prices
increased demand for US bonds
strengthening of the dollar index
can be observed.
3. Crypto Market: Two Different Scenarios
The crypto market's reaction usually occurs in two phases.
In the Short Term: Volatility
When news of the crisis first emerges, sell-offs may be seen in risky assets. Therefore, short-term declines may occur in major crypto assets such as:
Bitcoin
Ethereum
Medium Term: Digital Safe Haven Narrative
If the crisis continues, some investors may begin to see crypto as an alternative financial system. In this case:
Institutional demand for Bitcoin may increase
stablecoin trading volumes may rise
interest in decentralized finance projects may increase. Among stablecoins, which investors frequently use for trading, especially during crisis periods:
Tether
USD Coin
may stand out.
4. Possible Price Scenarios for Bitcoin
Some scenarios from analysts are as follows:
Scenario 1 – Short-term crisis
Temporary sell-off in the crypto market
Short-term 5-10% pullback in Bitcoin
Scenario 2 – Prolonged geopolitical crisis
Energy prices rise
Inflation expectations increase
Bitcoin may regain strength with the "digital gold" narrative.
In conclusion
A potential crisis in the Strait of Hormuz could directly affect not only energy markets but also crypto assets. Although volatility may increase in the short term, in the long term, Bitcoin, in particular, is expected to come to the forefront more as an alternative financial asset against geopolitical risks.
#GoldAndSilverMoveHigher
#CryptoMarketBouncesBack
#OilPricesPullBack


