The HBAR price has been holding up pretty well lately. Hedera is currently trading at around $0.102, up about 1.6% over the last day, having had a strong week with a 14% rise.
In a market that still feels a bit uncertain, this sort of steady rise is certainly noticeable. It shows that momentum hasn’t completely faded yet, and traders are starting to pay closer attention again.
Right now, the HBAR price is basically at a crossroads, the next move from here could set the tone for the rest of the month.
- Breaking the HBAR Downtrend Was the First Big Step
- Fibonacci Levels Are Shaping the Next Move
- What’s Next for HBAR
Breaking the HBAR Downtrend Was the First Big Step
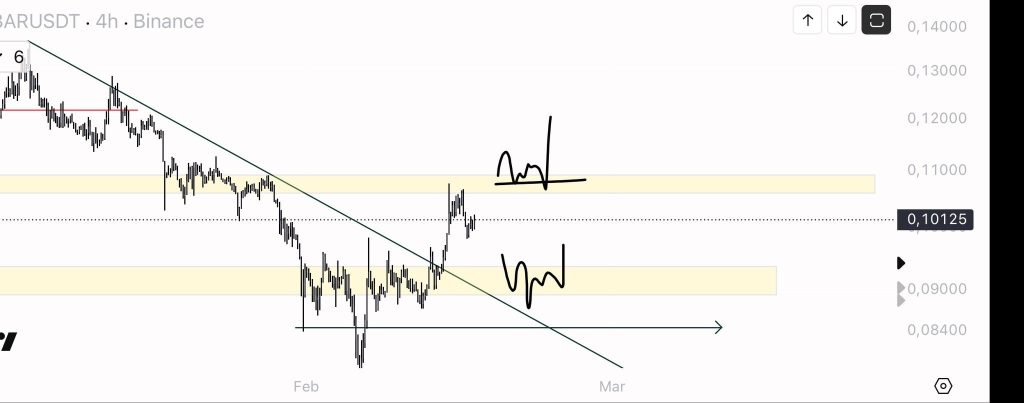
One of the clearest signals on Eliz’s chart is that Hedera finally broke above its long-term downtrend line. That descending resistance had been keeping the HBAR price capped for weeks, pushing every bounce back down. But once price pushed through it, things started to shift fast, and the rally picked up.
That breakout is what sparked the current move, but the real question now is whether HBAR can stay above that trendline and turn it into support. Eliz also points out two possible scalping setups, and both are pretty clean based on the structure.
Source: X/@eliz883
The first one is the higher resistance zone around $0.105 to $0.11. That’s where price has sold off before, and it’s basically the next big upside target. If the HBAR price can reclaim that area with strength, it could trigger another breakout leg.
The second zone is lower, around $0.092 to $0.095. That’s where buyers stepped in during consolidation before the breakout happened. If price pulls back, this is the area most traders will be watching for a bounce.
Fibonacci Levels Are Shaping the Next Move
Technically, the HBAR price is also reacting really clearly to Fibonacci levels right now. The most important support sits near the 50% retracement around $0.0971. As long as HBAR holds above that, the bullish structure stays intact.
On the upside, resistance comes in near the 38.2% level at $0.1026, which is basically being tested right now. If price clears it, the chart opens up toward that $0.11 zone again. But if HBAR drops below $0.097, momentum could cool off and price may drift back toward the $0.095 support area.
Here’s Where Hedera (HBAR) Price Could Go This Week_**
What’s Next for HBAR
At this point, the HBAR price is in one of those “wait for activation” moments. The breakout already happened, but the follow-through still needs to prove itself. If bulls can hold support and push into the next resistance zone, Hedera could keep extending its weekly strength. If not, a pullback into the lower demand area might be the next setup traders start watching.
Disclaimer: The information on this page may come from third parties and does not represent the views or opinions of Gate. The content displayed on this page is for reference only and does not constitute any financial, investment, or legal advice. Gate does not guarantee the accuracy or completeness of the information and shall not be liable for any losses arising from the use of this information. Virtual asset investments carry high risks and are subject to significant price volatility. You may lose all of your invested principal. Please fully understand the relevant risks and make prudent decisions based on your own financial situation and risk tolerance. For details, please refer to
Disclaimer.
Related Articles
Zcash News: Smart money quietly increasing holdings after ZEC's 55% pullback; the key breakout level is at $227
Zcash (ZEC) is currently oscillating around $226, facing pressure from a descending channel. Despite the appearance of bullish divergence and increased holdings by some investors, the market remains predominantly bearish. If it holds the $227 support level, it could potentially rally to targets such as $267; if it breaks below, it may test $191. Core factors include the stability of support levels and capital flow dynamics.
GateNews32m ago
BitMine’s Tom Lee: ETH Is in the Final Stages of a Mini Crypto Winter
BitMine's chairman, Tom Lee, views Ethereum as nearing the end of a mini-crypto winter, noting significant ETH acquisitions and a strong price rally amid geopolitical tensions. With advancing regulations and solid holdings, BitMine remains optimistic about ETH's future.
BeInCrypto32m ago
Japanese Government Bond Yields Hit Peak, Pressuring Asian Markets and Bitcoin, Risk Assets
Japan's 10-year government bond yield has risen to 2.32%, approaching the highest level since 1999, indicating stress in the financial system. Rising energy prices are intensifying inflation risks, and markets expect the central bank may raise interest rates. Japan holds $1.2 trillion in U.S. Treasury bonds, and rising yields impact global capital costs, potentially triggering price volatility in risk assets. Investors should monitor the impact of changes in government bond yields and energy prices on the market.
GateNews34m ago
$1.8 Billion Ethereum Buying Could Undo 9% Price Correction This Week
The essay analyzes recent trends in the cryptocurrency market, highlighting factors contributing to market fluctuations and recommending specific meme coins and altcoins to monitor.
BeInCrypto41m ago
BitMine Chairman Tom Lee: Ethereum's Bear Market Nearing its End, ETH Price Faces Test Amid Current Situation
BitMine Chairman Tom Lee believes Ethereum may be at the tail end of the cryptocurrency winter. The company has recently increased its ETH purchases, demonstrating strong safe-haven characteristics. He is optimistic about the passage of the Clarity Act, which he believes will help improve Ethereum's fundamentals. Ethereum is currently trading at $2,138, though geopolitical tensions remain a source of uncertainty.
GateNews59m ago
