
The HBAR price has been holding up pretty well lately. Hedera is currently trading at around $0.102, up about 1.6% over the last day, having had a strong week with a 14% rise.
In a market that still feels a bit uncertain, this sort of steady rise is certainly noticeable. It shows that momentum hasn’t completely faded yet, and traders are starting to pay closer attention again.
Right now, the HBAR price is basically at a crossroads, the next move from here could set the tone for the rest of the month.
- Breaking the HBAR Downtrend Was the First Big Step
- Fibonacci Levels Are Shaping the Next Move
- What’s Next for HBAR
Breaking the HBAR Downtrend Was the First Big Step
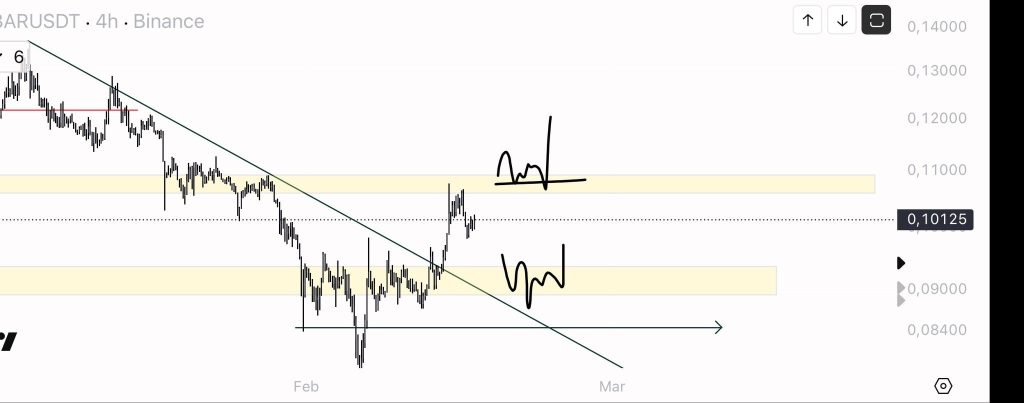
One of the clearest signals on Eliz’s chart is that Hedera finally broke above its long-term downtrend line. That descending resistance had been keeping the HBAR price capped for weeks, pushing every bounce back down. But once price pushed through it, things started to shift fast, and the rally picked up.
That breakout is what sparked the current move, but the real question now is whether HBAR can stay above that trendline and turn it into support. Eliz also points out two possible scalping setups, and both are pretty clean based on the structure.
Source: X/@eliz883
The first one is the higher resistance zone around $0.105 to $0.11. That’s where price has sold off before, and it’s basically the next big upside target. If the HBAR price can reclaim that area with strength, it could trigger another breakout leg.
The second zone is lower, around $0.092 to $0.095. That’s where buyers stepped in during consolidation before the breakout happened. If price pulls back, this is the area most traders will be watching for a bounce.
Fibonacci Levels Are Shaping the Next Move
Technically, the HBAR price is also reacting really clearly to Fibonacci levels right now. The most important support sits near the 50% retracement around $0.0971. As long as HBAR holds above that, the bullish structure stays intact.
On the upside, resistance comes in near the 38.2% level at $0.1026, which is basically being tested right now. If price clears it, the chart opens up toward that $0.11 zone again. But if HBAR drops below $0.097, momentum could cool off and price may drift back toward the $0.095 support area.
Here’s Where Hedera (HBAR) Price Could Go This Week_**
What’s Next for HBAR
At this point, the HBAR price is in one of those “wait for activation” moments. The breakout already happened, but the follow-through still needs to prove itself. If bulls can hold support and push into the next resistance zone, Hedera could keep extending its weekly strength. If not, a pullback into the lower demand area might be the next setup traders start watching.
Disclaimer: The information on this page may come from third parties and does not represent the views or opinions of Gate. The content displayed on this page is for reference only and does not constitute any financial, investment, or legal advice. Gate does not guarantee the accuracy or completeness of the information and shall not be liable for any losses arising from the use of this information. Virtual asset investments carry high risks and are subject to significant price volatility. You may lose all of your invested principal. Please fully understand the relevant risks and make prudent decisions based on your own financial situation and risk tolerance. For details, please refer to
Disclaimer.
Related Articles
Here’s Why The Crypto Market Is Up Today
The crypto market is in the greens today. In the past day, the total market cap has climbed by about 3.37%, now sitting around $2.43 trillion. It’s not just small coins, the big names are leading the move.
Bitcoin is up about 4.2%, trading near $71,200. Ethereum has gained over 5%, while
CaptainAltcoin15m ago
Crypto Market Indicates Recovery Despite Consistent Fear
The crypto market shows recovery with a $2.4T capitalization and a notable 1.99% increase. Bitcoin rises by 2.43% and Ethereum by 3.49%. Significant gains are seen in select altcoins, while DeFi and NFT sectors also experience growth.
BlockChainReporter31m ago
Trump's Ultimatum to Iran Fails to Materialize, BTC Stabilizes After Breaking Below $70,000 Over the Weekend
QCP Group points out that Trump's ultimatum to Iran failed to materialize, and the market stabilized briefly. Despite BTC breaking below 70,000, its resilience has strengthened. With U.S. national debt exceeding 3.9 trillion, stagflation concerns intensify, and central banks face policy dilemmas. Iran proposed settling transit fees in yuan, and the market should monitor shifts in BTC.
GateNews1h ago
Crypto Analyst Hints at ADA Price Uptick Based on Weekly Chart
Crypto analyst Ali Charts predicts a potential rise in ADA prices, currently up 5.50% in the last 24 hours. He suggests the token may surge further over the next three months based on historical price patterns and current market analysis.
TheNewsCrypto1h ago
BCH Shows Promising Buy Signal Traders Can’t Ignore
BCH holds key $440 support, showing potential for a short-term rebound.
The 4-hour chart indicates bullish flip with strong OBV and DMI signals.
Next targets lie at $494, $510, and possibly $570 if Bitcoin rises further.
Bitcoin Cash — BCH, has captured traders’ attention this week with
CryptoNewsLand1h ago
QNT Rally Tests a Crucial Supply Zone — What Next for Quant?
QNT rallied 24% weekly, testing a key supply zone near $80–$88.
Daily closes above $88 signal bullish continuation, while drops below $75 indicate renewed bearish pressure.
Short-term momentum is positive, but higher timeframe indicators suggest cautious trading.
Quant — QNT, has
CryptoNewsLand1h ago
