
The HBAR price is down around 2.3% in the last 24 hours, trading near $0.1006. It’s not a huge drop, but it’s underperforming a bit compared to the rest of the market. The main reason is pretty simple: traders have been stepping back from altcoins lately.
The Altcoin Season Index just slid to 31, which is basically a sign that capital is moving away from riskier coins for now. On top of that, trading volume is down about 27%, so there’s not a lot of strong buying conviction showing up yet. Right now, the HBAR price is sitting at one of those levels where the next move could go either way.
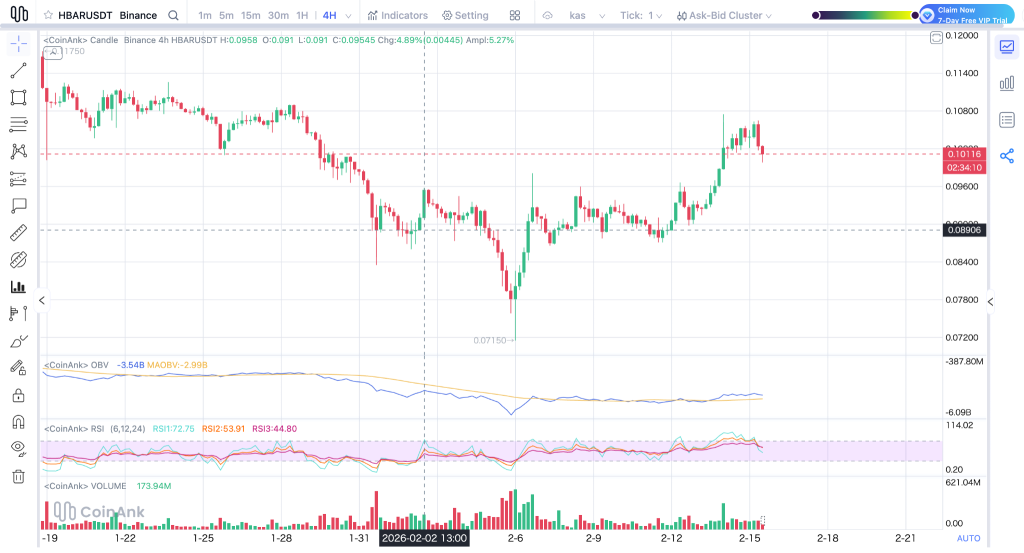
- What the HBAR Chart Is Showing Right Now
- RSI, MACD, and Trader Positioning
- Where the HBAR Price Could Be Headed This Week
What the HBAR Chart Is Showing Right Now
Looking at the 4-hour chart, Hedera had a strong bounce off the February low near $0.0715. From there, it pushed up quickly into the $0.105–$0.108 zone before running into resistance and pulling back.
That pullback is important because $0.10 has now become the key battleground. Price is hovering right around it, and the market is basically deciding whether this level holds as support or breaks down again.
Source: CoinAnk
There’s also a clear support area around $0.095. This level has held multiple times recently, and it’s probably the line bulls really don’t want to lose. If the HBAR price slips below that, the next level that comes into focus is closer to $0.090.
On the upside, the big hurdle is still $0.104–$0.108. That zone rejected the last rally, so the price needs to break back above it to get momentum going again.
RSI, MACD, and Trader Positioning
RSI gives a pretty clean signal here. It spiked hard during the recent rally, but now it’s cooling off, which matches the pullback we’re seeing. The good news is that it doesn’t look overheated anymore, it just looks like the market is pausing.
MACD is also starting to flatten after that quick move higher. Momentum hasn’t fully flipped bearish again, but it’s clearly slowed down. A push back above $0.104 would help bring strength back into the setup.
When it comes to net shorts vs net longs, this is usually the kind of area where shorts start getting confident again, mainly because $0.105–$0.108 has already acted as resistance. Longs will probably wait for a clean breakout before stepping in aggressively.
Hedera Is Waking Up: HBAR Price Just Hit the Level That Could Trigger 50% Upside_**
Where the HBAR Price Could Be Headed This Week
If the HBAR price can hold above $0.095 and reclaim $0.104, a move back toward $0.108 is very possible, and a push into the low $0.11s could follow if sentiment improves.
But if support breaks, then $0.090 becomes the next downside target pretty quickly. This week really comes down to one simple question: does $0.10 hold as a base, or does Hedera slip into another pullback before the next real move starts?
Disclaimer: The information on this page may come from third parties and does not represent the views or opinions of Gate. The content displayed on this page is for reference only and does not constitute any financial, investment, or legal advice. Gate does not guarantee the accuracy or completeness of the information and shall not be liable for any losses arising from the use of this information. Virtual asset investments carry high risks and are subject to significant price volatility. You may lose all of your invested principal. Please fully understand the relevant risks and make prudent decisions based on your own financial situation and risk tolerance. For details, please refer to
Disclaimer.
Related Articles
Crypto Fear & Greed Index drops to 10, market "fear" sentiment rises
BlockBeats News, March 26 — According to Alternative data, today’s cryptocurrency Fear and Greed Index is 10 (yesterday was 14), indicating increased market "fear" sentiment.
Note: The Fear and Greed Index threshold is 0-100, composed of indicators: volatility (25%), market trading volume (25%), social media activity (15%), market surveys (15%), Bitcoin’s proportion in the overall market (10%), and Google trending searches analysis (10%).
BlockBeatNews2m ago
Pi coin's 7-month low-volatility period has ended; an 108% rebound in volatility signals a major market move.
Pi Network (PI) is currently trading at approximately $0.1883, facing increased volatility and a decreasing correlation with Bitcoin. Recently, volatility has risen from 52% to 108%, indicating the end of the past seven months of compression and the potential for a significant move. However, the correlation coefficient between PI and Bitcoin has dropped to -0.30, suggesting that PI has not benefited from Bitcoin's upward trend. Technical analysis shows that if the price falls below $0.1894, it could drop to $0.1300, while holding above $0.2103 may lead to a rebound toward $0.2442.
MarketWhisper24m ago
The Futarchy of Privacy: Umbra's Fit in a Private Crypto World
The essay discusses the need for "Verifiable Privacy" in professional trading, highlighting Umbra's unique technical approach and performance-based tokenomics. It notes the privacy sector’s strong growth and upcoming catalysts for Umbra’s expansion.
CoinDesk31m ago
Bitcoin Consolidating, Is It Time to Enter? K33: Selling Pressure Easing, Bottom Signals Emerging
Bitcoin is oscillating between $60,000 and $75,000, with research firm K33 noting that selling pressure is subsiding and may signal a bottom formation. Long-term holders are maintaining their positions, and coupled with recent ETF fund inflows, the market may gradually improve. Despite economic uncertainty affecting short-term performance, the overall pattern is trending toward stabilization, and long-term investors can anticipate attractive entry opportunities.
区块客38m ago
Bitcoin ETF Ends Seven-Day Rally, Bitcoin Price Pressure Resurfaces
US Bitcoin spot ETFs have shifted to outflows after a period of continuous inflows, causing Bitcoin's price to decline and briefly break below the $70,000 mark. Although there were modest net inflows earlier this week, market sentiment has turned conservative due to macroeconomic uncertainties, indicating reduced institutional risk appetite. The $70,000 level has become a near-term battleground between bulls and bears, reflecting insufficient market confidence.
区块客42m ago
XRP volatility hits cycle lows as $1.40 support comes into focus
XRP is currently trading in a narrow range just above $1.40, with low volatility suggesting an imminent breakout. Recent price movements show resistance at $1.43 and support around $1.40, keeping traders attentive to upcoming shifts.
CoinDesk50m ago
