
The HBAR price is down around 2.3% in the last 24 hours, trading near $0.1006. It’s not a huge drop, but it’s underperforming a bit compared to the rest of the market. The main reason is pretty simple: traders have been stepping back from altcoins lately.
The Altcoin Season Index just slid to 31, which is basically a sign that capital is moving away from riskier coins for now. On top of that, trading volume is down about 27%, so there’s not a lot of strong buying conviction showing up yet. Right now, the HBAR price is sitting at one of those levels where the next move could go either way.
- What the HBAR Chart Is Showing Right Now
- RSI, MACD, and Trader Positioning
- Where the HBAR Price Could Be Headed This Week
What the HBAR Chart Is Showing Right Now
Looking at the 4-hour chart, Hedera had a strong bounce off the February low near $0.0715. From there, it pushed up quickly into the $0.105–$0.108 zone before running into resistance and pulling back.
That pullback is important because $0.10 has now become the key battleground. Price is hovering right around it, and the market is basically deciding whether this level holds as support or breaks down again.
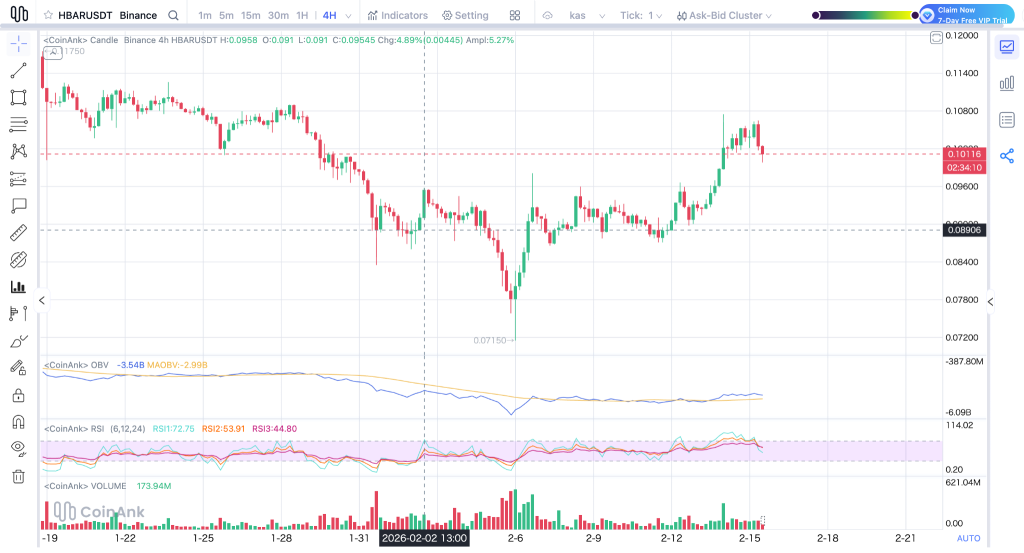
Source: CoinAnk
There’s also a clear support area around $0.095. This level has held multiple times recently, and it’s probably the line bulls really don’t want to lose. If the HBAR price slips below that, the next level that comes into focus is closer to $0.090.
On the upside, the big hurdle is still $0.104–$0.108. That zone rejected the last rally, so the price needs to break back above it to get momentum going again.
RSI, MACD, and Trader Positioning
RSI gives a pretty clean signal here. It spiked hard during the recent rally, but now it’s cooling off, which matches the pullback we’re seeing. The good news is that it doesn’t look overheated anymore, it just looks like the market is pausing.
MACD is also starting to flatten after that quick move higher. Momentum hasn’t fully flipped bearish again, but it’s clearly slowed down. A push back above $0.104 would help bring strength back into the setup.
When it comes to net shorts vs net longs, this is usually the kind of area where shorts start getting confident again, mainly because $0.105–$0.108 has already acted as resistance. Longs will probably wait for a clean breakout before stepping in aggressively.
Hedera Is Waking Up: HBAR Price Just Hit the Level That Could Trigger 50% Upside_**
Where the HBAR Price Could Be Headed This Week
If the HBAR price can hold above $0.095 and reclaim $0.104, a move back toward $0.108 is very possible, and a push into the low $0.11s could follow if sentiment improves.
But if support breaks, then $0.090 becomes the next downside target pretty quickly. This week really comes down to one simple question: does $0.10 hold as a base, or does Hedera slip into another pullback before the next real move starts?
Disclaimer: The information on this page may come from third parties and does not represent the views or opinions of Gate. The content displayed on this page is for reference only and does not constitute any financial, investment, or legal advice. Gate does not guarantee the accuracy or completeness of the information and shall not be liable for any losses arising from the use of this information. Virtual asset investments carry high risks and are subject to significant price volatility. You may lose all of your invested principal. Please fully understand the relevant risks and make prudent decisions based on your own financial situation and risk tolerance. For details, please refer to
Disclaimer.
Related Articles
Bernstein Says Bitcoin Bottom In, Targets $150K in 2026
AllianceBernstein analysts suggest Bitcoin has likely bottomed after a significant decline, with no systemic failures noted. Steady institutional demand and ETF inflows above $56 billion support a bullish $150,000 year-end target, indicating market resilience despite macro pressures.
CryptoFrontNews11m ago
BlackRock Speaks Out: AI Agents Could Become New Bitcoin Buyers, Payment Scenes Set for Explosive Turning Point
BlackRock Digital Asset Chief Robert Mitchnick stated that AI agents may increasingly prefer to use cryptocurrencies like Bitcoin for payments in the future, which will reshape the market's perception of the value of digital currency applications. Bitcoin's fast settlement and automated adaptability make it an ideal payment tool for AI systems, driving the development of agent economy and bringing new growth opportunities to the crypto market.
GateNews25m ago
Over $14 billion in options expiry looming! Bitcoin drops below $70,000, with $75,000 becoming a key battleground.
Bitcoin was pressured by a large-scale options expiration on March 27, 2026, causing the price to fall below $70,000, with a low of $69,990. The expiration of options contracts led to price volatility, especially around $75,000, while macro factors such as geopolitical risks and developments in crypto ETFs also influenced market sentiment. Technical analysis shows Bitcoin remains in an upward trend, with a short-term key range of $69,000 to $71,000.
GateNews1h ago
Chainlink (LINK) rebounds in April strengthen signals: whale accumulation, ETF inflows, and supply tightening resonate
Chainlink (LINK) experienced its first bullish candle in March 2026 after six months of decline, indicating an improvement in market sentiment. Whales and medium-sized holder addresses continue to add positions, and institutional demand remains steadily increasing, suggesting a growing willingness for medium- to long-term capital accumulation. Reduced supply and increased on-chain accumulation alleviate selling pressure. LINK is approaching a key support zone; holding this level could signal a reversal. However, macroeconomic uncertainties may still limit the upside potential.
GateNews1h ago
Pi Network (PI) ends 7 months of silence: volatility surges + negative correlation, Bitcoin's rise actually becomes a bearish signal?
Pi Network (PI) has experienced 7 months of low-volatility compression, leading to a clear change in market structure, with the current price around $0.1883. Recent volatility has rebounded above 100%, indicating a new phase in the market, but its rebound potential may be limited by its negative correlation with Bitcoin. Technical analysis shows a potential double-top pattern; if the price drops below $0.1894, it could fall to $0.1527. Short-term trends will be influenced by technical structures and changes in its correlation with Bitcoin.
GateNews1h ago
