Bitcoin is trading back near $69,000 now, but last week’s big dip to $60,000 is what sparked the latest wave of macro commentary. That level is now getting serious attention from long-term investors, especially after Jurrien Timmer, a director at Fidelity, pointed out that Bitcoin’s pullback may have landed exactly where cycle support was expected.
Timmer shared two charts that frame this move in a much bigger context, and the message is simple: Bitcoin’s deeper cycles may be cooling down, and that brief $60K flush could end up being a major inflection point.
Bitcoin & Liquidity: Why $60K Landed in the Support Zone
The first chart focuses on Bitcoin’s relationship with global liquidity. Timmer overlays BTC’s price with the global money supply trend, showing how closely Bitcoin has tracked liquidity expansion over the last several years.
When money supply accelerates, Bitcoin has historically responded with powerful upside moves. The 2020–2021 run is a perfect example, where expanding liquidity coincided with BTC climbing from the $10K zone into the $60K–$70K region.
When liquidity conditions tighten, the opposite tends to happen. Bitcoin often enters a reset phase where speculative excess gets flushed out.
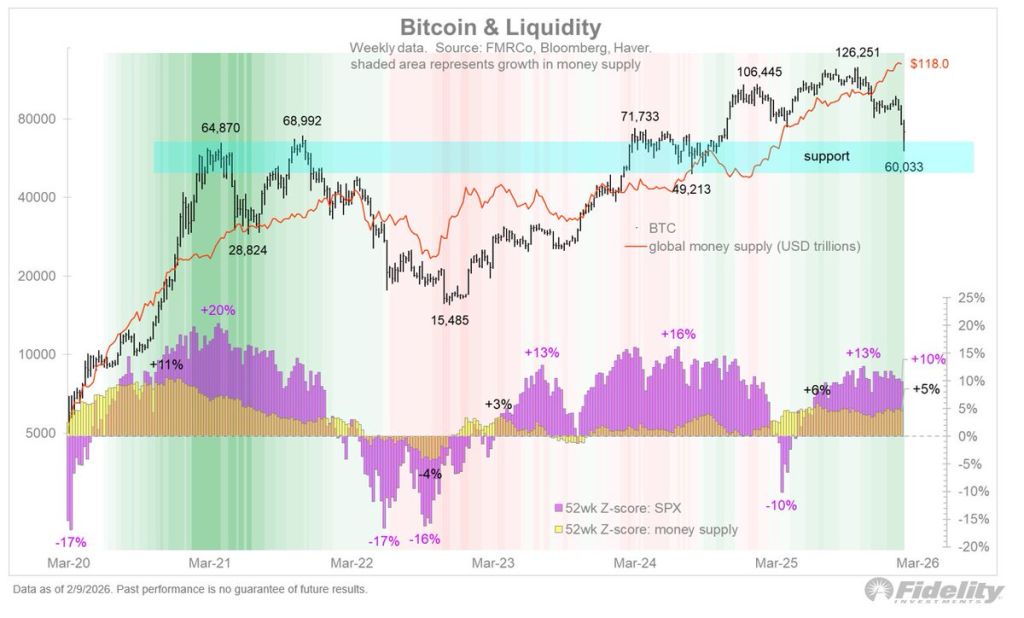
Source: X/@TimmerFidelity
That’s exactly what makes the $60K level so important in Timmer’s view. The chart shows a wide support band around that zone, and Bitcoin’s dip last week tagged it almost perfectly. It’s the kind of area where long-term buyers tend to step in, especially if the market is transitioning from one cycle into the next.
A key point Timmer makes is that this decline has been relatively contained. Past Bitcoin winters have been brutal, often erasing 70–80% from peak levels. A pullback to “only” $60K is shallow by historical standards, which supports the idea that Bitcoin is gradually maturing into a less extreme asset.
Bitcoin’s Road to Maturity: The Next Wave After the Reset
The second chart is where Timmer zooms out even further. He calls it Bitcoin’s “road to maturity,” mapping BTC’s history into distinct adoption waves stretching all the way back to the early days.
Each wave has followed a similar rhythm:
Bitcoin rallies into a major cycle peak, then corrects hard, then stabilizes before the next wave begins.
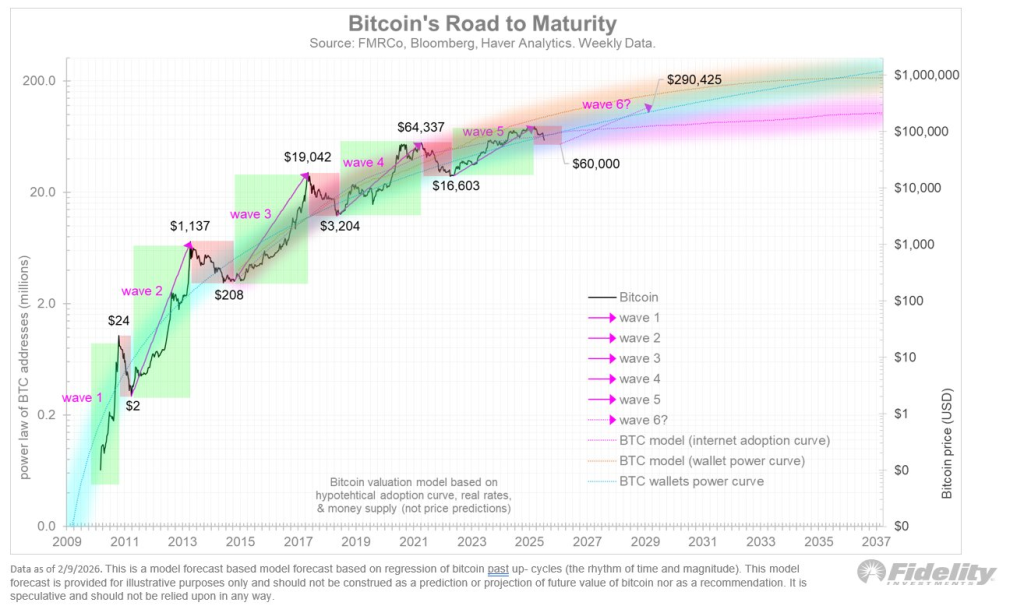
Source: X/@TimmerFidelity
The chart labels these waves clearly; from wave 1 near single-digit prices, through wave 3 around $1,000, wave 4 near $20,000, and wave 5 around the $60K–$70K peak zone.
What stands out is how the cycles compress over time. Early Bitcoin bull markets were wild and explosive. As the asset has grown larger and more institutionally held, the moves remain powerful, but the boom-and-bust swings become less dramatic.
Timmer’s model projects that future waves could eventually carry Bitcoin toward much higher levels over the long run, with one theoretical path pointing into the $290K range. That isn’t presented as a guarantee or a clean prediction, but as a way of showing how Bitcoin’s adoption curve still has room to expand if the historical rhythm continues.
His takeaway is grounded: nobody can say with certainty that $60K was the final bottom, but it looks like a meaningful low inside a major support zone. If Bitcoin spends the next few months consolidating above that level, the next cyclical bull phase could begin forming quietly beneath the surface.
For now, $60K remains the line in the sand, and in Timmer’s view, that brief dip may end up looking more like opportunity than panic.
Read also: AI Predicts What Happens to Altcoins If Bitcoin Crashes to $50K
Disclaimer: The information on this page may come from third parties and does not represent the views or opinions of Gate. The content displayed on this page is for reference only and does not constitute any financial, investment, or legal advice. Gate does not guarantee the accuracy or completeness of the information and shall not be liable for any losses arising from the use of this information. Virtual asset investments carry high risks and are subject to significant price volatility. You may lose all of your invested principal. Please fully understand the relevant risks and make prudent decisions based on your own financial situation and risk tolerance. For details, please refer to
Disclaimer.
Related Articles
BTC breaks through $72,000, up 1.17% over the past 24 hours
Gate News message, on April 10, market data showed that Bitcoin broke through $72,000, with a 24-hour increase of 1.17%.
GateNews17m ago
Bitcoin 1 Week RSI Breaks Downtrend for First Time Since October Crash, Recovery Rally Ahead?
Bitcoin 1 week RSI breaks downtrend for the first time since October crash.
Is a recovery rally expected for crypto prices.
Several possible targets set for bullish and bearish BTC outcomes.
Bitcoin and crypto enthusiasts grow hopeful for a promising crypto market price surge as new
CryptoNewsLand18m ago
U.S. March CPI data is about to be released: market expectations and analysis of crypto capital flows
Analyze market expectations before the release of the U.S. March CPI data, divergences in the inflation structure, and the potential transmission pathways to crypto assets’ risk appetite.
InstantTrends29m ago
STRC This week can raise funds to buy 8,000 BTC, with expected holdings reaching 10k coins
Gate News update, April 10: Strategy's Stretch (STRC) has raised enough funds so far this week to buy 8,000 BTC. STRC is expected to hold 10k BTC by the end of this week.
GateNews37m ago
Bitcoin below key resistance levels
Bitcoin is trading at $71,310, stuck below a resistance band between $70,000 and $75,000 that has contained price action since early February 2026. Analysts are sharply divided on what comes next, with forecasts spanning from $10,000 on the bear side to $170,000 on the bull side, a $160,000 gap that
CoincuInsights42m ago
