Hyperliquid (HYPE) is approaching the $30 USD threshold at the time of recording on Saturday, extending the recovery rally by approximately 1% compared to the previous session. However, this upward momentum remains unconvincing as the market shows clear caution: the open interest (OI) of HYPE futures continues to decline, reflecting risk-averse sentiment among investors. From a technical perspective, HYPE is at a critical crossroads around the $30 mark. In the context of short-term bullish momentum showing signs of improvement, a breakout scenario is gradually emerging.
Derivatives data indicate weakening demand
Hyperliquid faces challenges in consolidating investor confidence in the short term, especially as the entire cryptocurrency market remains under correction pressure. After implementing HIP-3 — an upgrade that enables futures trading for tokenized commodities on the DEX platform — market attention is now shifting to HIP-4, an update expected to introduce prediction markets, thereby significantly expanding the ecosystem of products.
However, HYPE’s futures market has yet to sustain upward momentum, making risk aversion increasingly evident. Data from CoinGlass shows that HYPE’s open interest reached $1.30 billion on Saturday but continued to decline as traders collectively closed positions or reduced leverage. This trend reflects growing caution and waning risk appetite in the market.
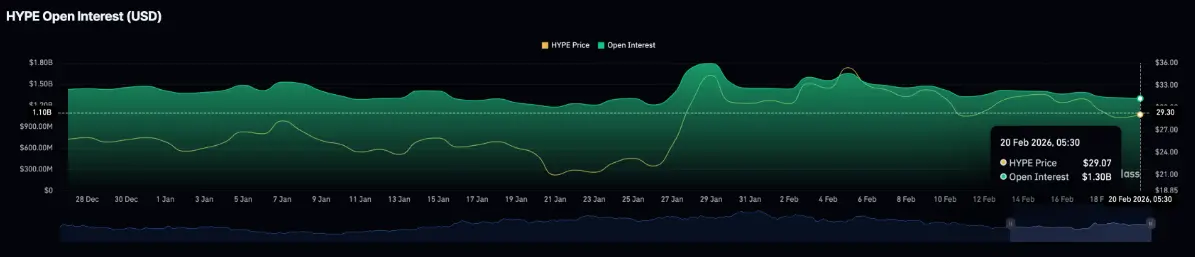 HYPE Derivatives Data | Source: CoinGlass
Technical outlook: Can HYPE extend gains beyond $30?
The Hyperliquid token has maintained its recovery since the pivot point S1 at $28.15 and is currently testing the 200-period exponential moving average (EMA) on the 4-hour chart, around $29.50. At the time of recording, the DEX token specializing in perpetual contracts increased slightly by 1% on Saturday. However, the price remains below both the 50-EMA and 200-EMA, indicating that the downtrend still dominates.
HYPE’s recovery faces a significant resistance zone around $30, where the 50-EMA at $29.95 converges with the downward trendline connecting the peaks set on February 2 and February 16. This is considered a critical hurdle that bulls need to overcome to establish a more positive trend.
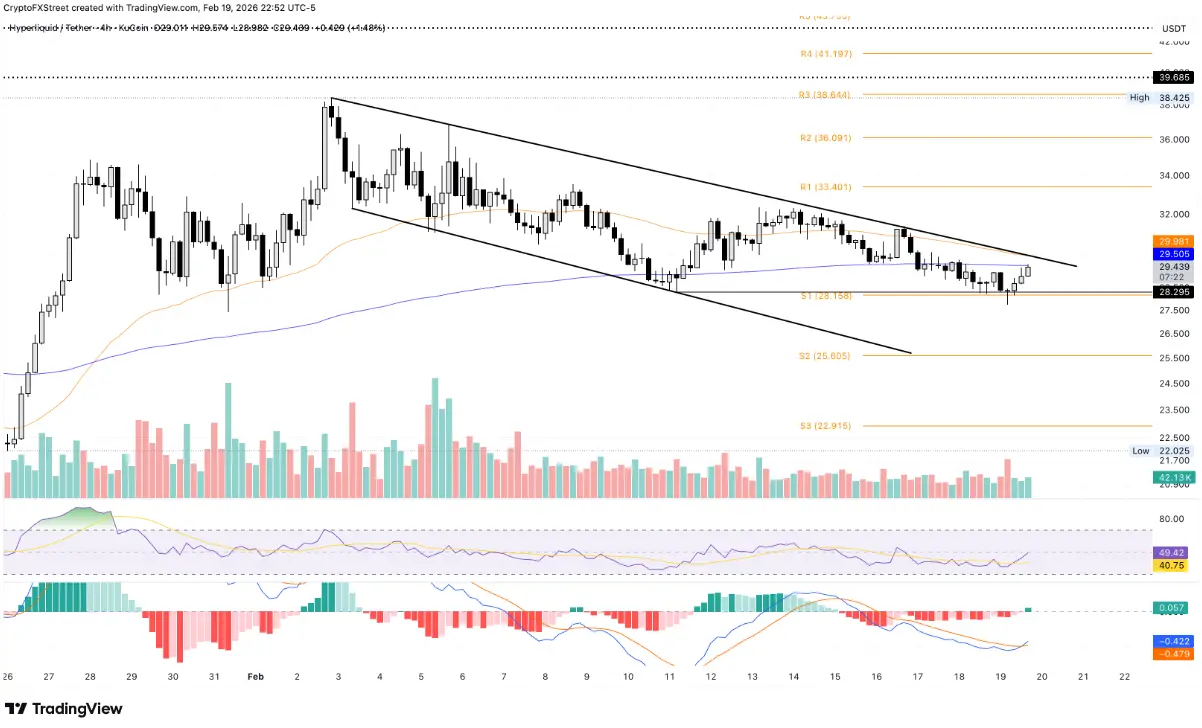 HYPE/USDT 4-Hour Chart | Source: TradingView
In a scenario where the price closes firmly above $30, HYPE could accelerate toward the pivot point R1 at $33.40 — roughly a 10% increase from the breakout level.
Regarding indicators, the MACD on the 4-hour chart has crossed above the signal line, signaling that bullish momentum is gradually returning. Meanwhile, the RSI has reached 48 and is trending upward, reflecting weakening selling pressure.
Conversely, if Hyperliquid fails to hold above the $28.15 support zone, the price is likely to face a deeper correction, heading toward the S2 pivot at $25.60.
Disclaimer: The information on this page may come from third parties and does not represent the views or opinions of Gate. The content displayed on this page is for reference only and does not constitute any financial, investment, or legal advice. Gate does not guarantee the accuracy or completeness of the information and shall not be liable for any losses arising from the use of this information. Virtual asset investments carry high risks and are subject to significant price volatility. You may lose all of your invested principal. Please fully understand the relevant risks and make prudent decisions based on your own financial situation and risk tolerance. For details, please refer to
Disclaimer.
Related Articles
ETH short-term upward movement of 0.99%: Driven by whale inflows and external capital transfers, a structural rebound
From 01:30 to 01:45 (UTC) on March 6, 2026, ETH achieved a return of +0.99% within 15 minutes, with a price range of 2065.42 to 2088.57 USDT, and an amplitude of 1.12%. The volatility during this window was significantly higher than the daily average, increasing short-term market attention. Liquidity was relatively low, and some large transactions drove the trading volume upward.
The main driver of this abnormal movement was the concentrated inflow of whale funds into decentralized exchanges and large transfers. On-chain monitoring detected multiple large ETH fund inflows into DeFi protocols and trading platforms, effectively pushing
GateNews13m ago
Bitcoin drops to $70,600, Ethereum holds at 2,055. Analysts: Bull market score is only 10; don't put too much faith in this rebound.
Bitcoin has recently continued to hit new lows, currently trading at $70,923, and CryptoQuant has warned that the recent rebound is only a short-term rally in a bear market, with a bull market score of only 10 points. The US stock market has declined across the board, and the crypto market is also under pressure. The future trend depends on whether spot demand turns positive. There are multiple scenarios in the market, including possible sideways consolidation or a drop to the $56,000-$60,000 support zone. Ethereum has shown relative strength in this wave of market movement, but if Bitcoin continues to decline, its support levels will need to be observed.
動區BlockTempo45m ago
Bitcoin Reclaims $70K As ETF Flows Stabilize and Selling Pressure Eases
Glassnode reports that Bitcoin's ETF flows are stabilizing after outflows, coinciding with a price rebound above $70,000. Healthy inflows into ETFs indicate a cautious optimism among institutions, but macro risks persist, necessitating continued monitoring of market trends.
BlockChainReporter56m ago
Culper Research announces short positions on ETH and related securities, claiming that Fusaka's upgraded token economic model has been damaged
Short-selling firm Culper Research announced that it is shorting Ethereum and related securities, believing that the Fusaka upgrade in 2025 will harm the ETH tokenomics model. The upgrade resulted in a larger-than-expected decrease in Gas fees, and on-chain data shows that the growth in active addresses and transaction volume is driven by low-value transactions. Culper believes Vitalik is aware of this and will continue to sell ETH, expecting ETH prices to decline further.
GateNews57m ago
Why did Bitcoin drop today? The US warns of a ground invasion in Iran, and Trump demands to lead the next Supreme Leader.
Bitcoin prices fluctuate due to escalating geopolitical tensions, dropping from $72,000 to $70,000 on March 6. Trump's tough rhetoric on the Iran situation, Iran's refusal to cease fire, and the U.S. military announcing increased strikes have heightened risk aversion. Market sentiment is divided, with some predicting Bitcoin will reach $80,000, but some analysts remain skeptical about a rebound. $72,000 is a key technical level; failure to break above it could lead to a drop toward $64,000.
MarketWhisper1h ago
Today, the Fear and Greed Index dropped to 18, indicating the market is in a "Extreme Fear" state.
Foresight News reports that, according to Alternative.me data, the cryptocurrency Fear and Greed Index dropped to 18 today (yesterday the index was 22, indicating "Extreme Fear"), indicating that the market is in a "Extreme Fear" state.
GateNews1h ago

