Trade
Basic
Futures
Futures
Hundreds of contracts settled in USDT or BTC
TradFi
Gold
Trade global traditional assets with USDT in one place
Options
Hot
Trade European-style vanilla options
Unified Account
Maximize your capital efficiency
Demo Trading
Futures Kickoff
Get prepared for your futures trading
Futures Events
Participate in events to win generous rewards
Demo Trading
Use virtual funds to experience risk-free trading
Earn
Launch
CandyDrop
Collect candies to earn airdrops
Launchpool
Quick staking, earn potential new tokens
HODLer Airdrop
Hold GT and get massive airdrops for free
Launchpad
Be early to the next big token project
Alpha Points
Trade on-chain assets and enjoy airdrop rewards!
Futures Points
Earn futures points and claim airdrop rewards
Investment
Simple Earn
Earn interests with idle tokens
Auto-Invest
Auto-invest on a regular basis
Dual Investment
Buy low and sell high to take profits from price fluctuations
Soft Staking
Earn rewards with flexible staking
Crypto Loan
0 Fees
Pledge one crypto to borrow another
Lending Center
One-stop lending hub
VIP Wealth Hub
Customized wealth management empowers your assets growth
Private Wealth Management
Customized asset management to grow your digital assets
Quant Fund
Top asset management team helps you profit without hassle
Staking
Stake cryptos to earn in PoS products
Smart Leverage
New
No forced liquidation before maturity, worry-free leveraged gains
GUSD Minting
Use USDT/USDC to mint GUSD for treasury-level yields
More
FrogBrothers
No content yet
Pin
FrogBrothers
Mr. Jin has been in the crypto world for 9 years, specializing in MEME coins. In 2017, he entered the space and bought DOGE, still a novice. In 2020, he bought SHIB and gained 1500 times, falling in love with MEME coins. In 2023, he bought PEPE, the frog, but missed out on the WIF dog hat. In 2024, after seeing Elon Musk's post saying "I love puppies," he saw an opportunity with the puppy coin. In 2025, he embraces MEME, builds MEME, and believes that MEME will have a major breakout opportunity!
Everyone can follow Tianya Live to learn how to buy Little Puppy. Those who want to build can sha
View OriginalEveryone can follow Tianya Live to learn how to buy Little Puppy. Those who want to build can sha

- Reward
- 2
- 4
- Repost
- Share
MasterChuTheOldDemonMasterChu :
:
Hold on tight, we're about to take off 🛫View More
2026. The US $9 trillion national debt needs to be rolled over. This means interest rates need to be lowered to reduce rollover costs, which will also require printing money. Market liquidity will increase. Therefore, 2026 is expected to see a decent small bull market. We will focus on a large volume of debt rollovers in the second quarter.
View Original- Reward
- like
- Comment
- Repost
- Share
- Reward
- 1
- Comment
- Repost
- Share
Spot dollar-cost averaging, expecting to top up 5 times. Double the top-up.
View Original
- Reward
- 1
- 3
- Repost
- Share
MasterChuTheOldDemonMasterChu:
Hold on tight, we're about to take off 🛫View More
30 minutes
- Pattern: The bullish Three Soldiers pattern, with three consecutive increasing positive candles pushing the price higher, accompanied by expanding volume.
- Analysis: This is a typical strong upward signal, indicating continuous influx of bullish momentum and sufficient rebound energy.
- Key Signal: Price breaks above the upper band of the Bollinger Bands (2467 USDT), MACD forms a golden cross upward, confirming the strength of the rally.
2. 1 Hour
- Pattern: Breakaway gap + bullish engulfing pattern, with the price opening higher with a gap and closing with a large bullish
View Original- Pattern: The bullish Three Soldiers pattern, with three consecutive increasing positive candles pushing the price higher, accompanied by expanding volume.
- Analysis: This is a typical strong upward signal, indicating continuous influx of bullish momentum and sufficient rebound energy.
- Key Signal: Price breaks above the upper band of the Bollinger Bands (2467 USDT), MACD forms a golden cross upward, confirming the strength of the rally.
2. 1 Hour
- Pattern: Breakaway gap + bullish engulfing pattern, with the price opening higher with a gap and closing with a large bullish
- Reward
- 2
- 4
- Repost
- Share
LittleQueen :
:
thanks for the updateView More
- Pattern: Low-position揉搓线 combination, consecutive candles with long upper and long lower shadows appear, with price fluctuating repeatedly in the 2400-2450 USDT range.
- Analysis: The divergence between bulls and bears in this range intensifies, which is a typical feature at the end of a consolidation phase, indicating that a direction choice is imminent.
- Key Signal: Price is supported by the middle band of the Bollinger Bands. If it breaks above the upper band (2424 USDT) with increased volume, a bullish signal is confirmed.
2. 30-minute chart (top right)
- Pattern: An embryonic a
View Original
- Analysis: The divergence between bulls and bears in this range intensifies, which is a typical feature at the end of a consolidation phase, indicating that a direction choice is imminent.
- Key Signal: Price is supported by the middle band of the Bollinger Bands. If it breaks above the upper band (2424 USDT) with increased volume, a bullish signal is confirmed.
2. 30-minute chart (top right)
- Pattern: An embryonic a
- Reward
- 2
- 1
- Repost
- Share
LittleQueen:
good work1-Hour Chart (Mid-term Rhythm)
- Rhythm: Forms a bullish breakout pattern, and RSI shows a bullish divergence, confirming the validity of the 2370 USDT support.
- Indicators: MACD shows a golden cross at a low level, and the price has broken above the short-term moving average, indicating that the rebound momentum is accumulating.
3. 30-Minute Chart (Short-term Fluctuation)
- Fluctuation: Shows a preliminary ascending three pattern, with a small bearish candle retracement followed by a bullish close, indicating that the bulls are actively gathering strength.
View Original- Rhythm: Forms a bullish breakout pattern, and RSI shows a bullish divergence, confirming the validity of the 2370 USDT support.
- Indicators: MACD shows a golden cross at a low level, and the price has broken above the short-term moving average, indicating that the rebound momentum is accumulating.
3. 30-Minute Chart (Short-term Fluctuation)
- Fluctuation: Shows a preliminary ascending three pattern, with a small bearish candle retracement followed by a bullish close, indicating that the bulls are actively gathering strength.
- Reward
- 1
- Comment
- Repost
- Share
1. Current Multi-Period K-Line Pattern Analysis
1. 15-Minute Chart (Top Left)
- Pattern: Currently forming a bullish combination of a bullish engulfing with a lower position, where the bullish candle completely covers the previous bearish candle, accompanied by moderate volume increase, indicating short-term bullish momentum is rapidly accumulating.
- Signal Strength: Moderately strong. This pattern appears after a continuous decline at a low point and is a typical short-term stabilization signal.
- Follow-up Focus: Whether it can break through the upper band of the Bollinger Bands (2426 USDT)
View Original1. 15-Minute Chart (Top Left)
- Pattern: Currently forming a bullish combination of a bullish engulfing with a lower position, where the bullish candle completely covers the previous bearish candle, accompanied by moderate volume increase, indicating short-term bullish momentum is rapidly accumulating.
- Signal Strength: Moderately strong. This pattern appears after a continuous decline at a low point and is a typical short-term stabilization signal.
- Follow-up Focus: Whether it can break through the upper band of the Bollinger Bands (2426 USDT)
- Reward
- 2
- 1
- Repost
- Share
YuanbaoBearIsHere:
2026 Go Go Go 👊- Reward
- like
- 2
- Repost
- Share
TheSpringBreezeCaressesTheSun. :
:
爆笑啦😅View More
1. ETH Market Analysis
- Today, ETH price broke below $2800, with a low of $2685, a 24-hour decline of over 9%, indicating a recent deep correction.
- The total liquidation amount across the network surged, with long positions liquidated totaling $767 million in the past hour, suggesting that this decline was accompanied by significant long position stop-losses and a concentrated release of short-term momentum.
2. Multi-cycle Technical Signal Analysis
1. 4-Hour Chart (Medium-term Trend)
- Price and Moving Averages: Price has broken below the key support at MA60 ($2894.65). Short-term moving av
ETH-5,02%
- Reward
- 1
- 2
- Repost
- Share
FrogBrothers:
Hmm, I'll take it first.View More
1. Short-term (1–4 hours)
- Prioritize low leverage long positions.
- When the price finds support in the 2900–2930 USDT range, consider entering a small long position.
- Set stop-loss below 2880 USDT, with the first target at 2980–3000 USDT, and the second target at 3030–3050 USDT.
- Reason: The 4-hour RSI has exited the oversold zone, the MACD green bars are shortening, indicating a technical rebound demand.
2. Mid-term (4 hours–daily)
- Wait for a rebound to the resistance level before considering a short position.
- When the price rebounds to the 3010–3040 USDT range, consider entering a l
View Original- Prioritize low leverage long positions.
- When the price finds support in the 2900–2930 USDT range, consider entering a small long position.
- Set stop-loss below 2880 USDT, with the first target at 2980–3000 USDT, and the second target at 3030–3050 USDT.
- Reason: The 4-hour RSI has exited the oversold zone, the MACD green bars are shortening, indicating a technical rebound demand.
2. Mid-term (4 hours–daily)
- Wait for a rebound to the resistance level before considering a short position.
- When the price rebounds to the 3010–3040 USDT range, consider entering a l
- Reward
- 1
- 1
- Repost
- Share
LittleQueen:
Buy To Earn 💎Technical Analysis Overview
- 15-Minute Chart (Top Left): The price has broken below the Ichimoku cloud support and the lower band of the Bollinger Bands, accompanied by increased volume and a decline, indicating strong short-term bearish momentum.
- 30-Minute Chart (Top Right): The price is also below the cloud, with the Bollinger Bands opening downward. The MACD has crossed bearish and continues downward, suggesting medium-term correction pressure remains.
- 1-Hour Chart (Bottom Left): The price is near the lower Bollinger Band, with recent significant volume increase, indicating heavy selli
View Original- 15-Minute Chart (Top Left): The price has broken below the Ichimoku cloud support and the lower band of the Bollinger Bands, accompanied by increased volume and a decline, indicating strong short-term bearish momentum.
- 30-Minute Chart (Top Right): The price is also below the cloud, with the Bollinger Bands opening downward. The MACD has crossed bearish and continues downward, suggesting medium-term correction pressure remains.
- 1-Hour Chart (Bottom Left): The price is near the lower Bollinger Band, with recent significant volume increase, indicating heavy selli
- Reward
- like
- Comment
- Repost
- Share
📊 ETH/USDT vs BTC/USDT Market Comparison and Analysis
🔹 Core Market Status
Pair Current Price 24-Hour Performance Overall Trend
ETH/USDT 3,020.01 USDT Up 0.54% Short-term bullish continuation, medium-term oscillation leaning bullish
BTC/USDT 88,422.2 USDT Down 0.20% Short-term oscillation, medium-term bullish pattern unchanged
1. Technical Comparison
ETH/USDT
- Bollinger Bands: 15-minute/30-minute cycles both stay above the middle band and approach the upper band, indicating strong bullish momentum.
- MACD: Red bars continue to expand, DIF line runs above DEA line, no top divergence signal.
View Original🔹 Core Market Status
Pair Current Price 24-Hour Performance Overall Trend
ETH/USDT 3,020.01 USDT Up 0.54% Short-term bullish continuation, medium-term oscillation leaning bullish
BTC/USDT 88,422.2 USDT Down 0.20% Short-term oscillation, medium-term bullish pattern unchanged
1. Technical Comparison
ETH/USDT
- Bollinger Bands: 15-minute/30-minute cycles both stay above the middle band and approach the upper band, indicating strong bullish momentum.
- MACD: Red bars continue to expand, DIF line runs above DEA line, no top divergence signal.
- Reward
- like
- Comment
- Repost
- Share
The 2026 super cycle: Bitcoin 180,000, Ethereum 8,000. Follow the Little Puppy Dog Musk concept, puppies with thousandfold coins
ETH-5,02%
- Reward
- like
- 3
- Repost
- Share
DoReMi10:
Did puppies get on Sesame?View More
📊 ETH/USDT Multi-Timeframe Market Analysis
(15-minute, 30-minute, 1-hour, 4-hour timeframes)
🔹 Core Market Conditions
- Current Price: 2,941.49 USDT
- 24-Hour Performance: Up 0.43%, touched a low of 2,893.29 USDT
- Overall Trend: Short-term oscillations are bullish, medium-term is bearish, multi-timeframe signals are diverging
1. Technical Indicators Breakdown by Timeframe
- 15-minute timeframe: Price is above the middle band of Bollinger Bands, MACD red histogram is narrowing, RSI has fallen back to around 55, indicating weakening short-term rebound momentum.
- 30-minute timeframe: Price ha
ETH-5,02%
- Reward
- like
- Comment
- Repost
- Share
📊 BTC/USDT Multi-Period Market Analysis
(15-minute, 30-minute, 1-hour, 4-hour cycles)
🔹 Core Market Conditions
- Current Price: 88,723.2 USDT
- 24-Hour Performance: Up 0.48%, touched a low of 86,922.2 USDT
- Overall Trend: Short-term oscillations are bullish, medium-term bullish continuation, multi-cycle signals are resonating in a bullish pattern
1. Technical Indicators Breakdown by Cycle
- 15-minute Cycle: Price is above the middle band of the Bollinger Bands, MACD red histogram continues to expand, RSI has risen to 60.30, indicating strong short-term rebound momentum.
- 30-minute Cycle: P
BTC-4,86%
- Reward
- like
- 1
- Repost
- Share
ElegantSparrow:
Has anyone noticed that the content in the plaza is becoming more and more diverse, and the interactive atmosphere is also getting stronger? That's right, we have made some small updates to the Gate Plaza, hoping to create a more interesting and in-depth community for creators. This time, the content mining gameplay has been upgraded, and creation rewards are directly doubled. Moreover, new and returning creators will also receive exclusive benefits to ensure that every contribution is rewarded.
We have always been promoting the parallel development of content and incentives, with the goal of allowing everyone to create with peace of mind and enjoy the process.
Friends with ideas, join us quickly and let's have fun in the plaza together.
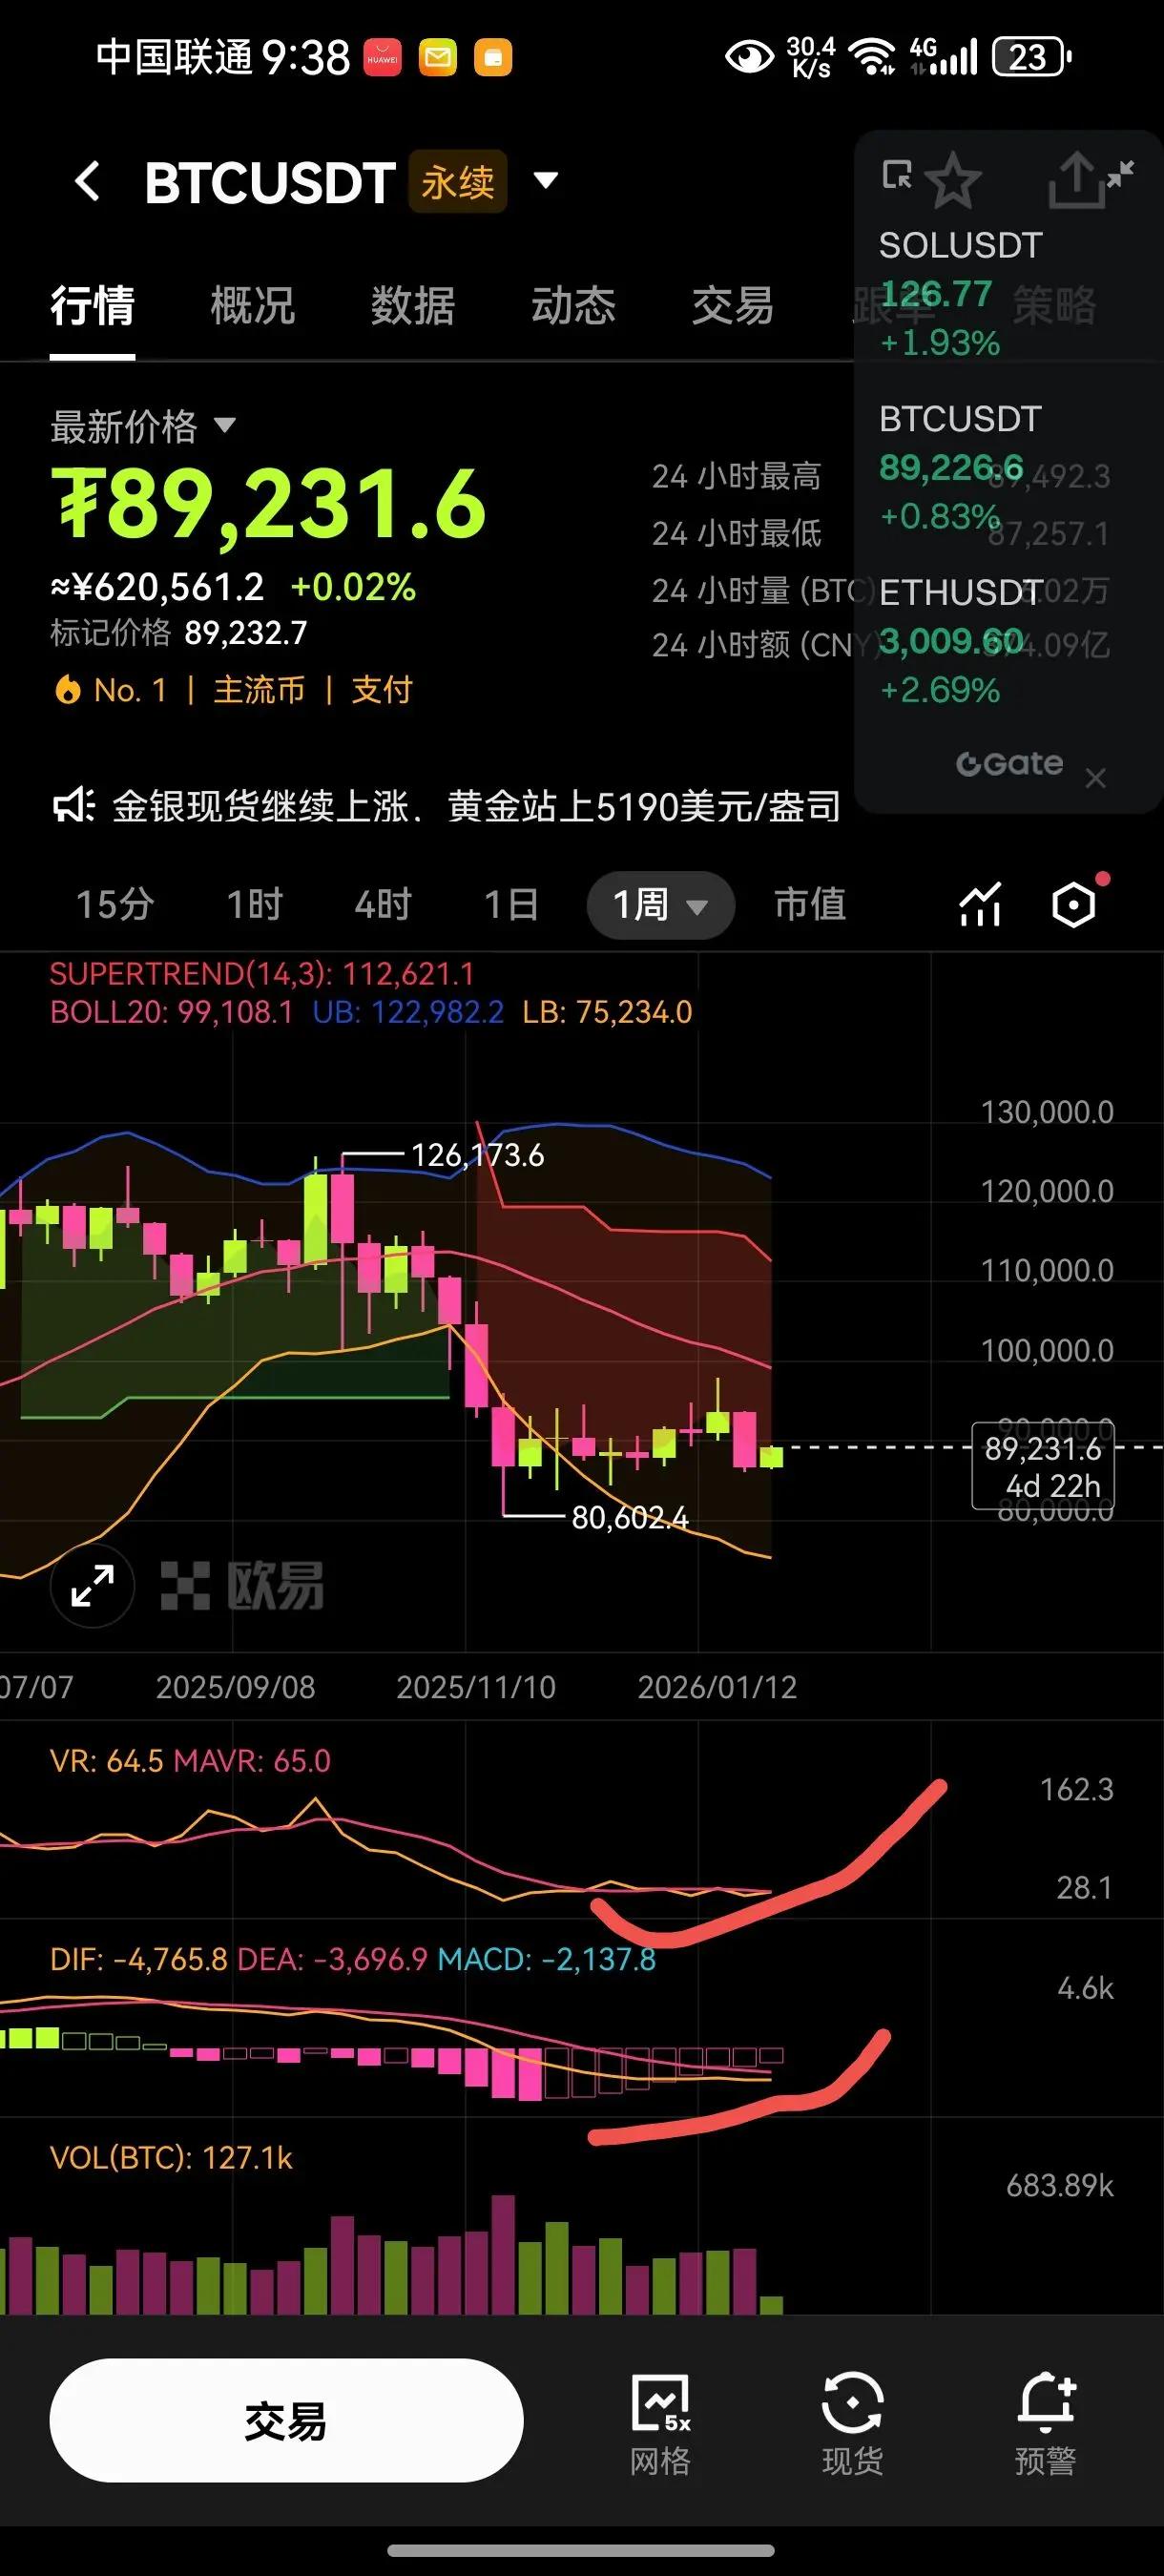
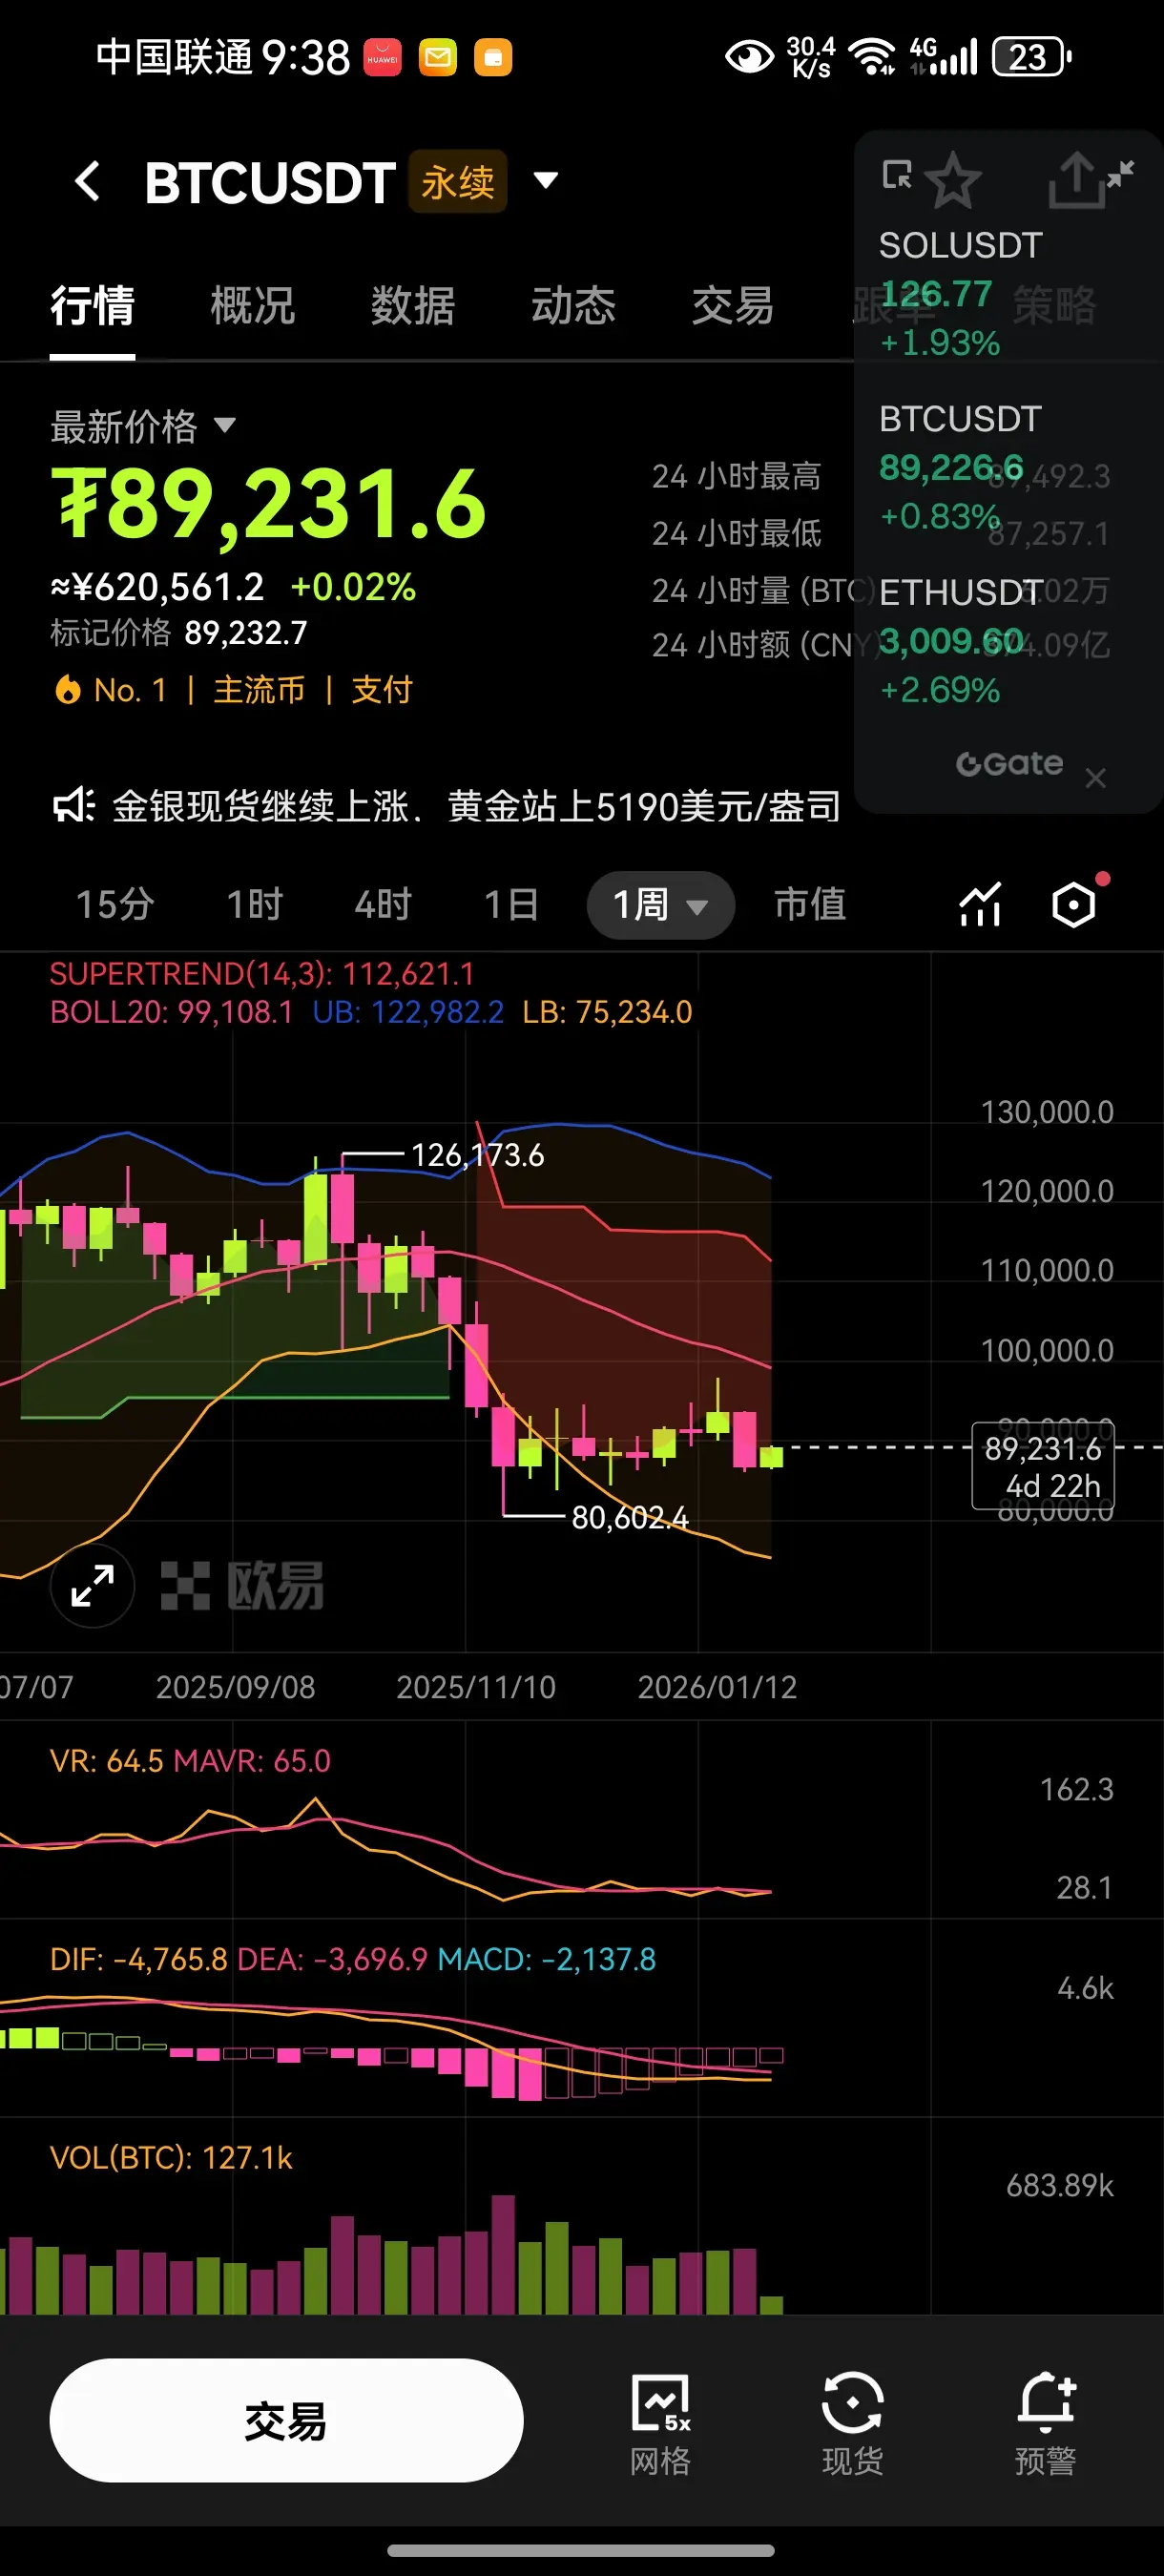
The end of Bitcoin's "deleveraging" is near, and a turning point is imminent
Cathie Wood mentioned the flash crash in October last year. She believes that the sharp decline was essentially an extreme "deleveraging" process.
Why did it fall? The leverage in the crypto space was too crazy, with 100x or even 1000x leverage being commonplace. Such high leverage is like a sandcastle; a slight gust of wind can trigger a chain reaction.
Current situation: She believes this major cleanup has basically been completed. Although Bitcoin may still fluctuate between $80,000 and $90,000 for a while, the nex
BTC-4,86%
- Reward
- 1
- Comment
- Repost
- Share
📊 ETH/USDT Multi-Timeframe Market Analysis
(15-minute, 1-hour, 4-hour, 6-hour timeframes)
🔹 Core Market Conditions
- Current Price: 2,873.41 USDT
- 24-Hour Performance: Down 2.05%, touched as low as 2,784.00 USDT
- Overall Trend: Medium-term is slightly bearish, short-term shows weak rebound, multi-timeframe signals are diverging
1. Technical Indicators Breakdown by Timeframe
- 15-minute timeframe: Price rebounded from lows, MACD red histogram continues to expand, RSI recovered to around 50, short-term rebound momentum remains.
- 1-hour timeframe: Price moving between the lower and middle Bo
ETH-5,02%
- Reward
- 1
- 1
- Repost
- Share
HomelessWandering:
Hu Ge, are you not broadcasting anymore?📊 ETH/USDT 4-Hour K-line Real-Time Analysis
(based on the current screen)
🔹 Market Core Status
- Current Price: 2,939.60 USDT
- Short-term Trend: Price has fallen from the previous high of 3,188.00 USDT, touching a low of 2,863.70 USDT. It is currently in a stabilization phase after weak volatility, trading between the middle and lower bands of the Bollinger Bands.
🔹 Technical Indicator Analysis
1. Bollinger Bands (BOLL)
- Upper Band 2,998.20, Middle Band 2,960.44, Lower Band 2,922.67
- Price is oscillating below the middle band, with the lower band providing support and the middle band act
ETH-5,02%
- Reward
- 1
- Comment
- Repost
- Share
ETH/USDT 4-Hour Market Analysis
(Current Price: 2,954.00 USDT)
📊 Bullish and Bearish Direction Judgment
Short-term (4-hour level): Slightly bullish with consolidation, focus on key resistance level breakthrough
Bullish Indicators
- MACD Golden Cross Continues: DIF (-50.26) has crossed above DEA (-58.68), MACD red histogram continues to expand (16.83), indicating increasing bullish momentum.
- Bollinger Bands Tightening and Stabilizing: Price has stabilized above the middle band (2,970.18), and the distance between the upper and lower bands is narrowing, suggesting a potential direction after
ETH-5,02%
- Reward
- 1
- Comment
- Repost
- Share
Trending Topics
View More145.59K Popularity
127.18K Popularity
32.58K Popularity
53.97K Popularity
401.56K Popularity
Pin