MaintainTenPercentEveryDay

vip
Age 0.4 Yıl
Peak Tier 5
No content yet
$ETH Short-term (1-2 days): No clear upward trend. Moves in tandem with Bitcoin, oscillating between $1950 and $2050. The 4-hour chart needs to stabilize above $1990-$2000 to confirm a short-term bullish reversal.
- Mid-term (1-2 weeks): Reversal conditions are insufficient. The daily chart remains in a downtrend, with $2000-$2030 acting as the dividing line between bulls and bears. A volume breakout and stabilization above this level are needed to open up the upside space to $2150-$2350; if it falls below $1900, it will test $1800 again.
ETH-2%
View Original
[The user has shared his/her trading data. Go to the App to view more.]
  • Reward
  • Comment
  • Repost
  • Share
Ethereum 4-Hour Indicator Divergence Observation (2026.02.04)
On the 4-hour chart, after the price created a new low at 2108, the RSI did not make a new low at the same time, forming a bullish divergence signal. This suggests there may be a short-term rebound opportunity, but attention should be paid to the ongoing downtrend on the daily chart. The divergence signal is only for short-term reference, and the rebound potential is limited.
15-Minute Pattern Analysis
Ethereum 15-Minute Consolidation Pattern (2026.02.04)
Content: The 15-minute chart shows a triangle consolidation pattern, with an u
ETH-2%
BTC0,13%
View Original
post-image
post-image
[The user has shared his/her trading data. Go to the App to view more.]
  • Reward
  • Comment
  • Repost
  • Share
50x Long Silver
View Original
[The user has shared his/her trading data. Go to the App to view more.]
  • Reward
  • Comment
  • Repost
  • Share
High leverage long position
View Original
[The user has shared his/her trading data. Go to the App to view more.]
  • Reward
  • 1
  • Repost
  • Share
MaintainTenPercentEveryDayvip:
Stay strong and HODL💎
Steady Long Position (Anchor at support level, low-risk attempt to go long)
- Entry Price: $3150 (Pullback to short-term strong support, hourly RSI rebounds above 50 to trigger)
- Stop Loss Price: $3100 (Break below medium-term support, avoid trend weakening and being trapped)
- Take Profit Price 1: $3240 (First resistance level, hourly EMA cluster zone)
- Take Profit Price 2: $3280 (Key breakout level on daily chart, institutional fund inflow resonance zone)
- Position Size: 30% of capital (Light position for trial, reserve room for additional entries)
🚨 Real-time Order Placement Key Reminde
View Original
post-image
澳门六合彩
澳门六合彩澳门六合彩
MC:$2.61KHolders:2
0.00%
  • Reward
  • Comment
  • Repost
  • Share
[2026 Market Trends] Investment Signals Behind the Indicators
4.052 views
2026-01-15 06:48
  • Reward
  • Comment
  • Repost
  • Share
[2026 Market Trends] Investment Signals Behind the Indicators
3.483 views
2026-01-13 07:56
  • Reward
  • Comment
  • Repost
  • Share
Ethereum Order Placement Strategy (Stable yet Flexible, Light Position Trading)
✅ Long Entry: 3195-3200
❌ Stop Loss: 3160
💰 Take Profit 1: 3250 | Take Profit 2: 3290
📌 Position Size: 12% | Risk-Reward Ratio 1:2.5
⚠️ Risk Control: Total position ≤26%, after triggering Take Profit 1, set a trailing stop (activated when profit ≥5 points)
ETH-2%
View Original
  • Reward
  • 1
  • Repost
  • Share
小助理888vip:
Experienced driver, guide me 📈
#加密市场开年反弹 $ETH $SOL ‌(Balanced Strategy)
- Direction: Long
- Entry Price: 3155
- Stop Loss Price: 3135
- Take Profit Price: 3195
- Currently, Ethereum is consolidating strongly around 3160, with solid support in the 3130-3140 range. Buying momentum is strong. The balanced strategy takes an entry in the middle, avoiding chasing highs or blindly waiting for deep corrections. It aligns with the healthy oscillation rhythm of the current "bull market turnover." Stop loss is set above the key support, and take profit targets the safe space before the 3200 round number.
(Aggressive Strategy)
- Dir
ETH-2%
SOL-0,59%
View Original
  • Reward
  • 1
  • Repost
  • Share
On-ChainMetricsBreakdownRoomvip:
Brothers, time to eat meat!
[2026 Market Trends] Investment Signals Behind the Indicators
949 views
2026-01-05 12:50
  • Reward
  • Comment
  • Repost
  • Share
[New Year Market] Investment Signals Behind the Indicators
5.946 views
2026-01-04 05:44
  • Reward
  • Comment
  • Repost
  • Share
1. Range Box: 3075-3150, clearly defining the oscillation boundaries
2. Support Lines: 3080 (solid), 3070 (stop-loss level); Resistance Lines: 3140 (solid), 3150 (breakout level)
3. Indicator Annotations: RSI overbought zone (>70), MACD red histogram shrinking, Bollinger Bands narrowing
$ETH $BTC
ETH-2%
BTC0,13%
View Original
post-image
  • Reward
  • 1
  • Repost
  • Share
MaintainTenPercentEveryDayvip:
2026 Go Go Go 👊
On-ChainMetricsBreakdownRoomvip
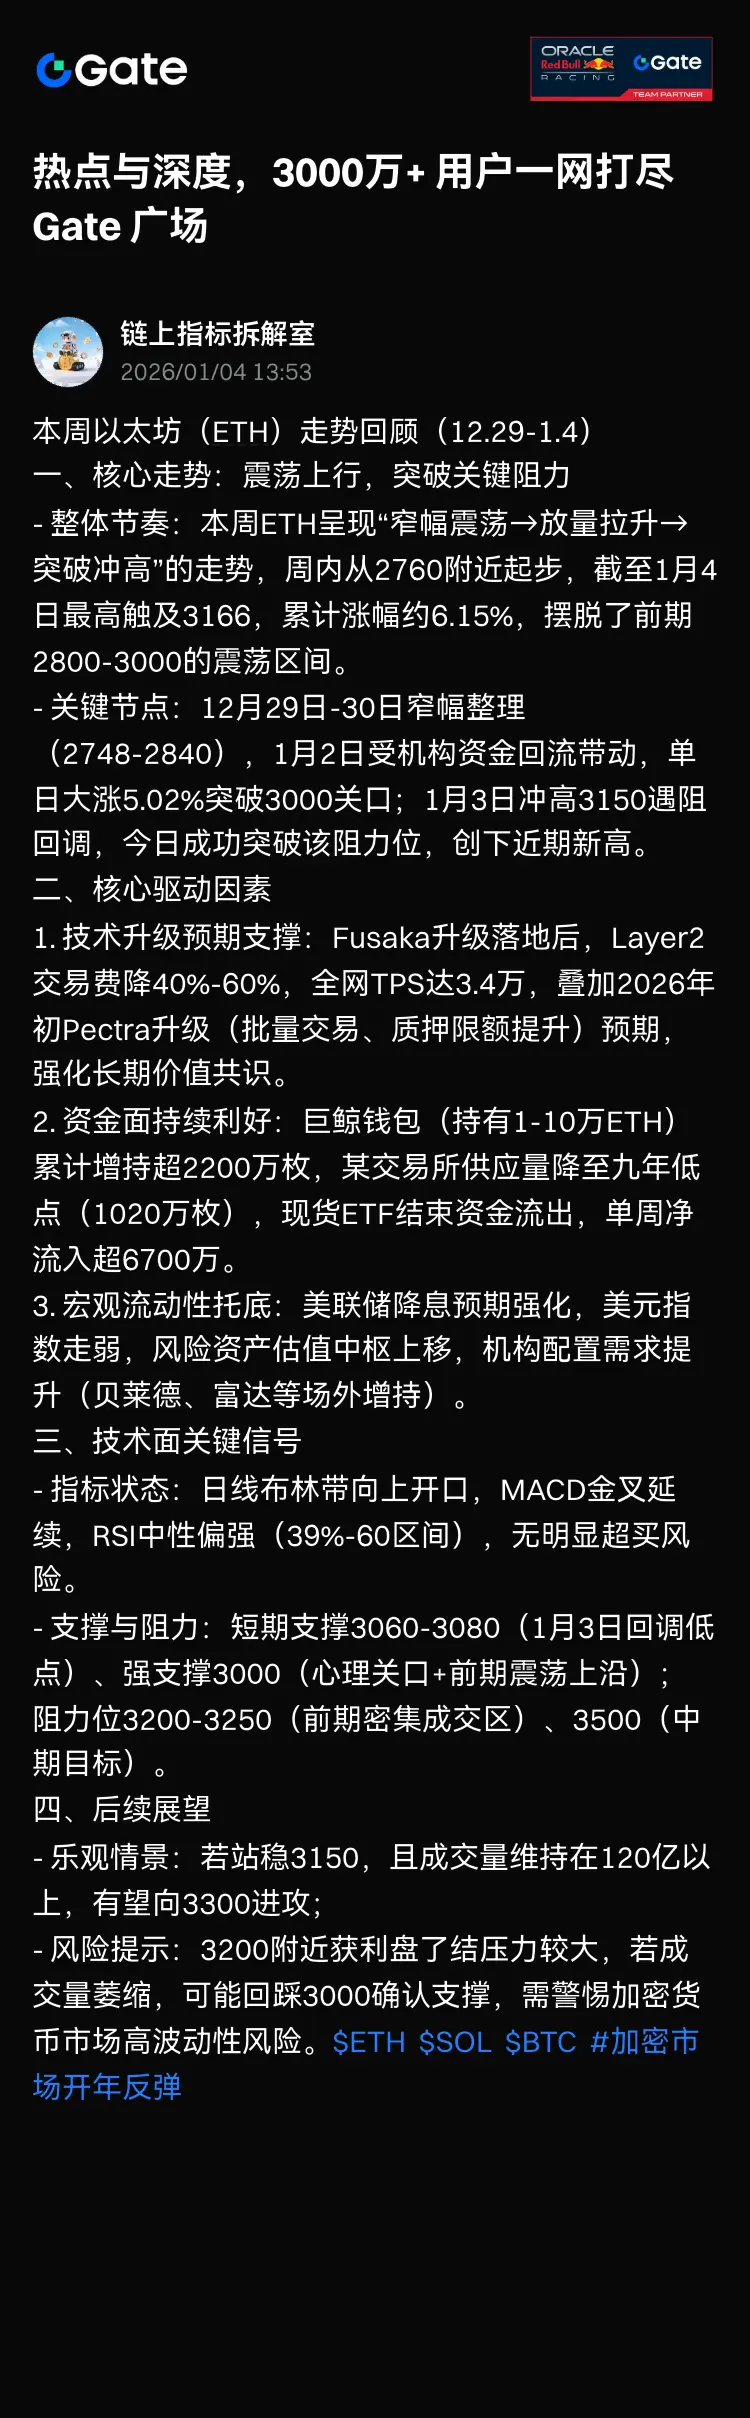
This Week's Ethereum (ETH) Price Review (12.29-1.4)
1. Core Trend: Oscillating Upward, Breaking Through Key Resistance
- Overall Rhythm: This week, ETH showed a pattern of "narrow-range consolidation → increased volume rally → breakout to new highs." Starting around 2760, it reached a high of 3166 on January 4, with a total increase of approximately 6.15%, breaking out of the previous consolidation zone of 2800-3000.
- Key Milestones: Narrow-range consolidation from December 29-30 (2748-2840); on January 2, driven by institutional fund inflows, a single-day surge of 5.02% broke through the 3000 mark; on January 3, it surged to 3150 but faced resistance and pulled back; today, it successfully broke through this resistance, hitting a recent new high.
2. Core Driving Factors
1. Technical Upgrade Expectations: After the Fusaka upgrade, Layer2 transaction fees decrease by 40%-60%, the total network TPS reaches 34,000, combined with the anticipated Pectra upgrade in early 2026 (batch transactions, increased staking limits), reinforcing long-term value consensus.
2. Continued Favorable Capital Flows: Whales holding 10,000-100,000 ETH have accumulated over 22 million tokens; a certain exchange's supply has fallen to a nine-year low of 10.2 million; spot ETF capital outflows have ended, with weekly net inflows exceeding 67 million.
3. Macro Liquidity Support: The Federal Reserve's rate cut expectations strengthen, the US dollar index weakens, risk asset valuation centers rise, and institutional allocations increase (BlackRock, Fidelity, and others are adding holdings off-exchange).
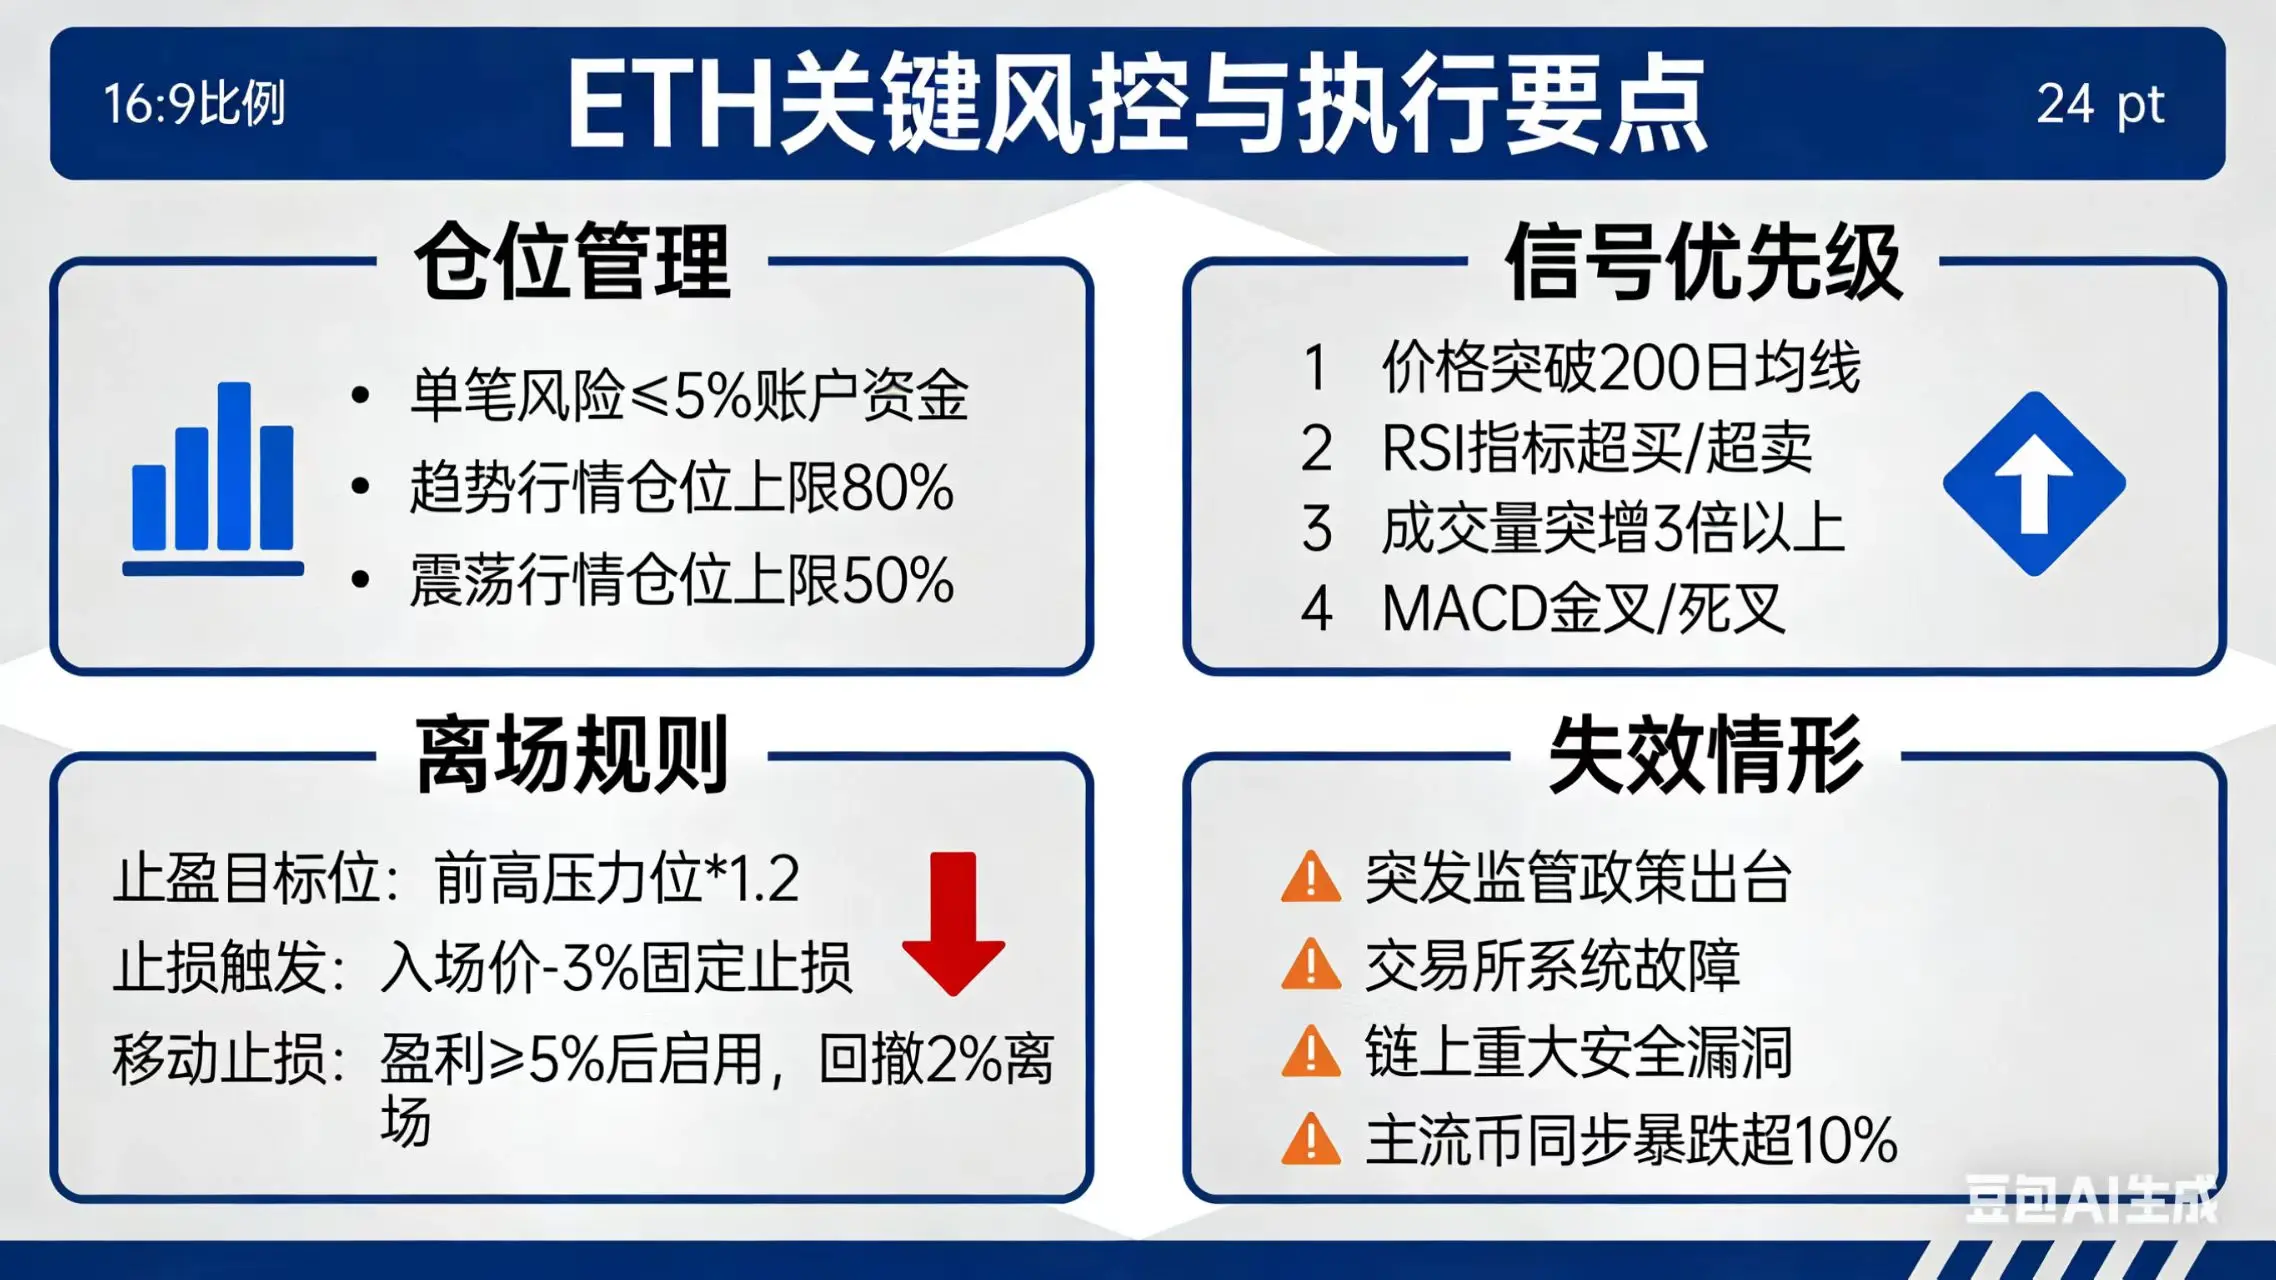
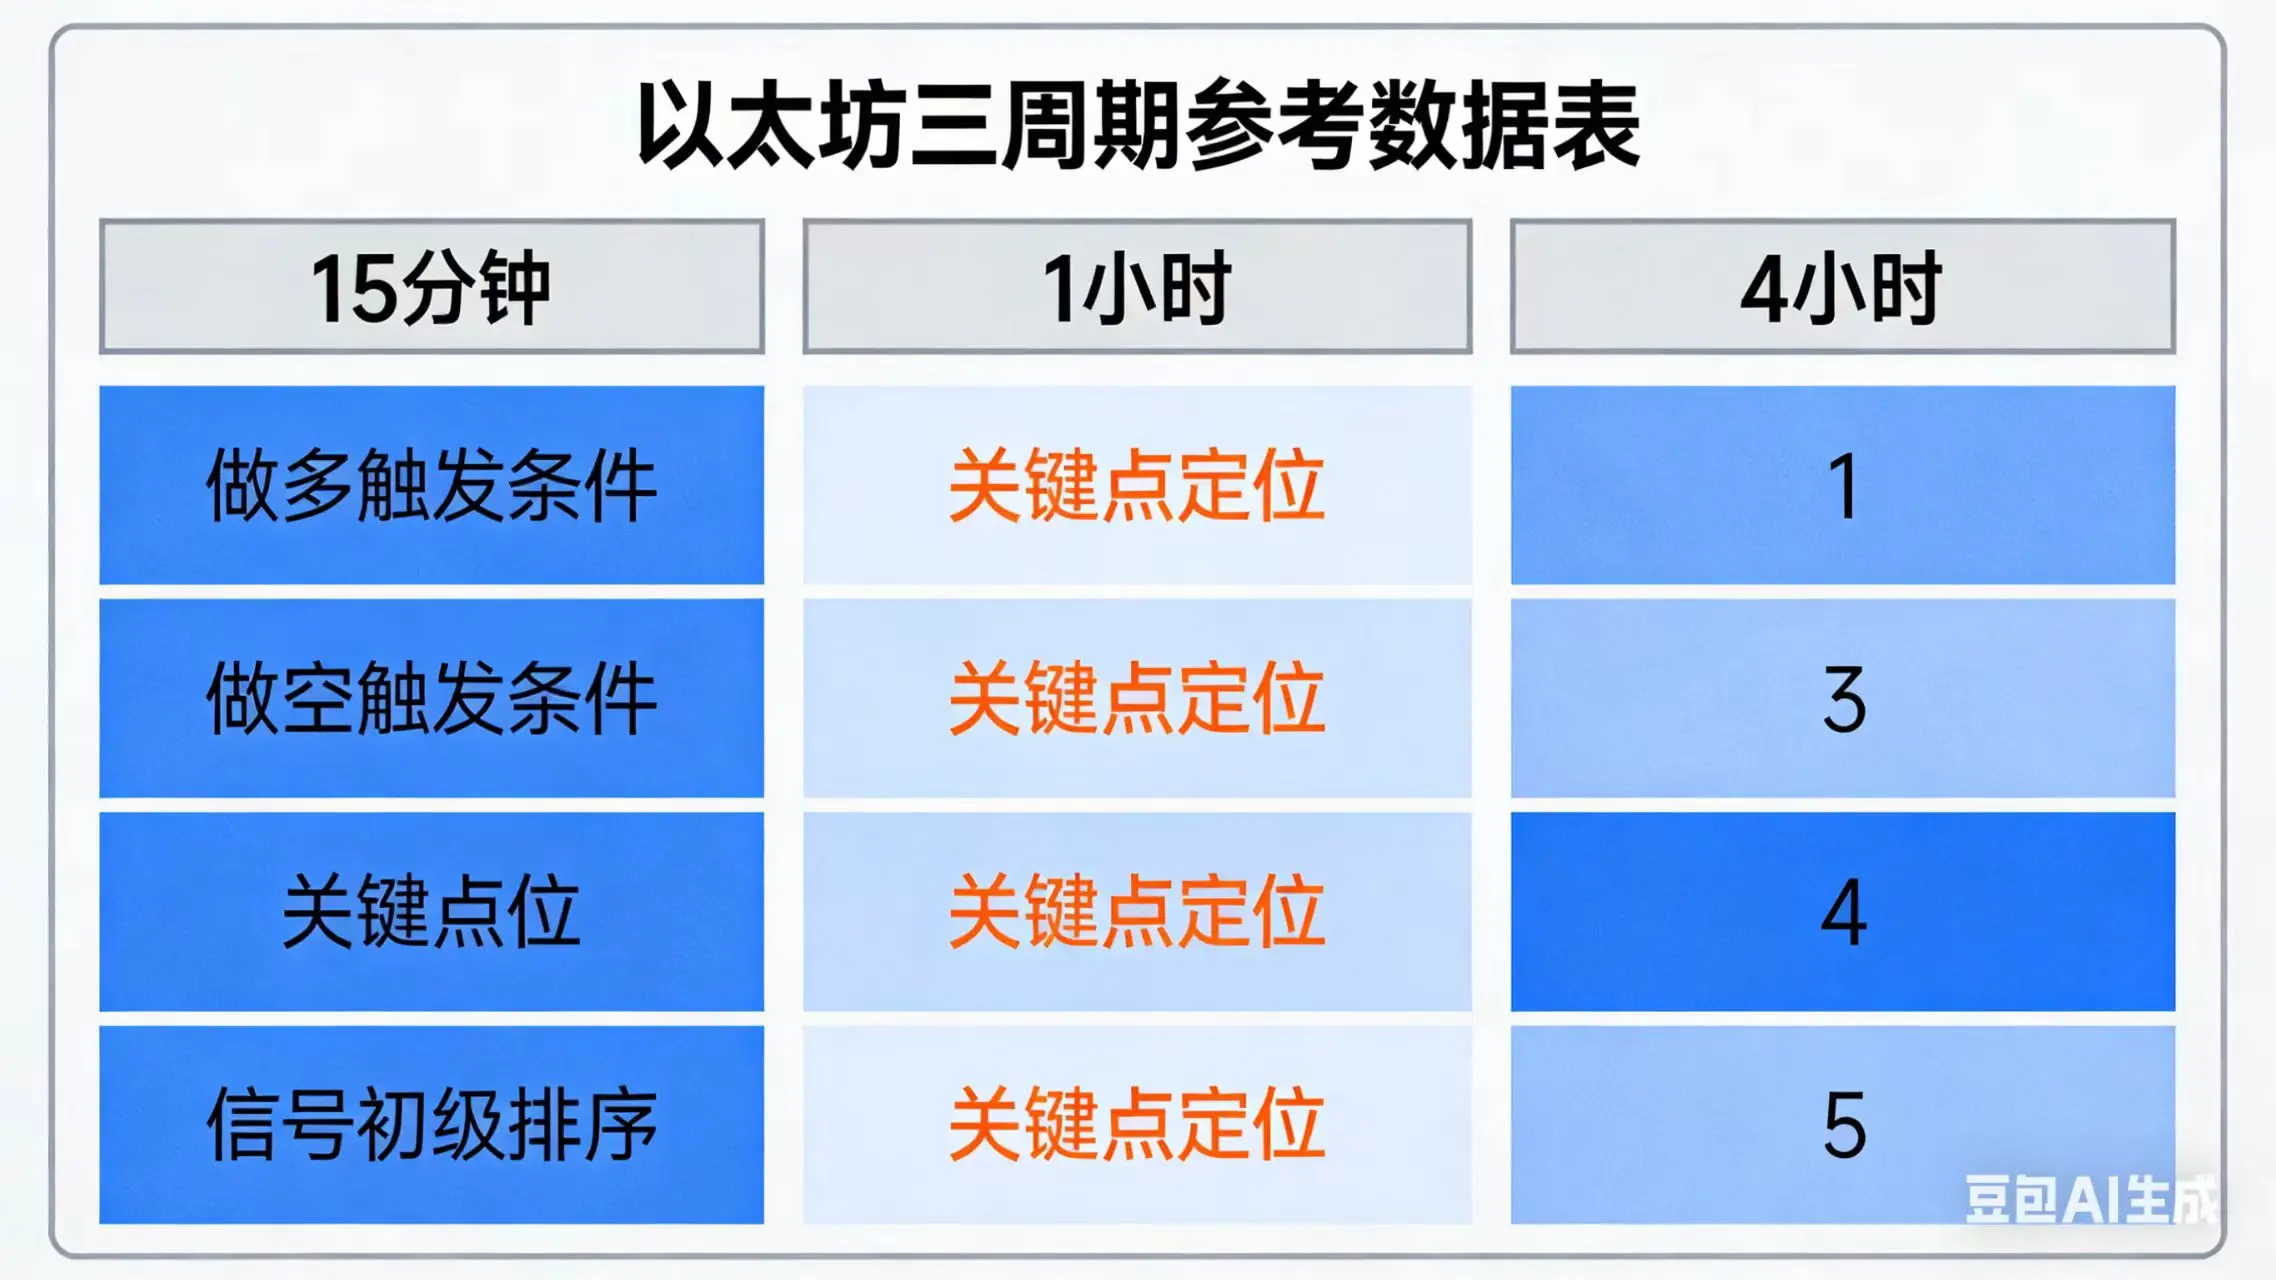
3. Key Technical Signals
- Indicator Status: Daily Bollinger Bands are opening upward; MACD maintains a golden cross; RSI is neutral to slightly strong (39%-60 range), with no obvious overbought risk.
- Support and Resistance: Short-term support at 3060-3080 (January 3 low), strong support at 3000 (psychological level + previous consolidation upper boundary); resistance at 3200-3250 (previous dense trading zone), and 3500 (medium-term target).
4. Future Outlook
- Optimistic Scenario: If ETH stabilizes above 3150 and trading volume remains above 12 billion, an attack toward 3300 is possible.
- Risk Warning: Profit-taking pressure around 3200 is significant; if trading volume shrinks, a pullback to 3000 to confirm support may occur. High volatility risk in the cryptocurrency market should be watched carefully. $ETH $SOL $BTC #加密市场开年反弹
  • Reward
  • Comment
  • Repost
  • Share
ETH
$ETH
Order Placement Parameters
Long Strategy:
- Order Price: 3080
- Stop Loss Price: 3060 (20 points)
- Take Profit 1: 3120 (Risk-Reward Ratio 1:2)
- Take Profit 2: 3140 (Risk-Reward Ratio 1:4)
Short Strategy:
- Order Price: 3140
- Stop Loss Price: 3160 (20 points)
- Take Profit 1: 3100 (Risk-Reward Ratio 1:2)
- Take Profit 2: 3080 (Risk-Reward Ratio 1:3)
Core Execution Points:
1. Order Type: Limit order, executed only when the price reaches the order price.
2. Entry Signals:
- Long: Bullish candle near 3080, RSI retraces to 55-60.
- Short: Bearish candle near 3140, RSI rebounds to
ETH-2%
View Original
  • Reward
  • Comment
  • Repost
  • Share
#我的2026第一条帖
$ETH ETH Late Night Order Reference
1. Long Strategy (Buy on Support)
- 15-minute chart: Place a buy order at $2960-$2965, stop loss at $2950 (below key support), take profit at $2990-$2995 (near short-term resistance).
- 1-hour chart: Place a buy order at $2950-$2955, stop loss at $2940, take profit at $3000 (integer resistance level).
- 4-hour chart: Place a buy order at $2920-$2930 (strong support zone), stop loss at $2900, take profit at $3020-$3030 (previous high area).
2. Short Strategy (Sell on Resistance)
- 15-minute chart: Rebound to $2995-$3000, place a sell order, stop
ETH-2%
View Original
  • Reward
  • Comment
  • Repost
  • Share
#交易机器人# I am using the ATUSDT contract grid bot on Gate, with a total return since creation of +0.00%
View Original
post-image
  • Reward
  • Comment
  • Repost
  • Share
Tuesday Ethereum long and short trading plan

Long Strategy

- Entry reference: Place buy orders on a pullback to the 2950-2970 range, and immediately stop loss if it breaks the 2920 support level (defending strong support at 2739).

- Target points: First target 3000-3030, second target 3070-3100, and the tail warehouse can be seen at 3160.

- Order placement tips: Take a light position at 2833, with a stop loss at 2739, aiming for rebound gains after an extreme pullback.

Short selling strategy

- Entry reference: Place a short order when it rebounds to the 3060-3085 range, and exit wi
ETH-2%
BTC0,13%
View Original
  • Reward
  • Comment
  • Repost
  • Share
$ETH $BTC #ETH走势分析
ETH Order Placement Ready for Immediate Execution (Starting December 18th from 12:00 to 21:00)
1. Main Strategy: Short on Rebound
Entry Price: 2835-2840 | Stop Loss: 2850-2855 (15 points) | Take Profit: 2805-2810 USD (30 points)
Trigger Conditions: 4-hour resistance at 2850, 1-hour RSI > 50 with bearish divergence, 15-minute EMA death cross + volume spike confirmed by bearish candle
2. Auxiliary Strategy: Buy on Pullback
Entry Price: 2795-2800 | Stop Loss: 2780 (15-20 points) | Take Profit: 2820-2825 (30 points)
Trigger Conditions: 4-hour support held at 2780, 1-hour RSI
ETH-2%
BTC0,13%
View Original
post-image
post-image
  • Reward
  • Comment
  • Repost
  • Share
$ETH $BTC $
Ethereum's trend tonight #非农数据超预期
On December 17th at 18:00, it shows a sideways to bullish pattern. In the short term, it rebounds supported by $2930. Multiple time frame signals resonate, but resistance above is clearly strong. It is recommended to focus on low buy-ins within the range and use high sell-offs as supplements.

Multi-time frame analysis and trading plan

- 15-minute chart: Narrow fluctuation between 2945-2955, Bollinger Bands tightening, MACD forming a small bullish crossover with slight volume increase, support at 2930, resistance at 2977.

- 1-hour chart: Pric
ETH-2%
BTC0,13%
View Original
  • Reward
  • Comment
  • Repost
  • Share
  • Pin