4.15 Bitcoin/Ethereum Market Analysis and Strategy
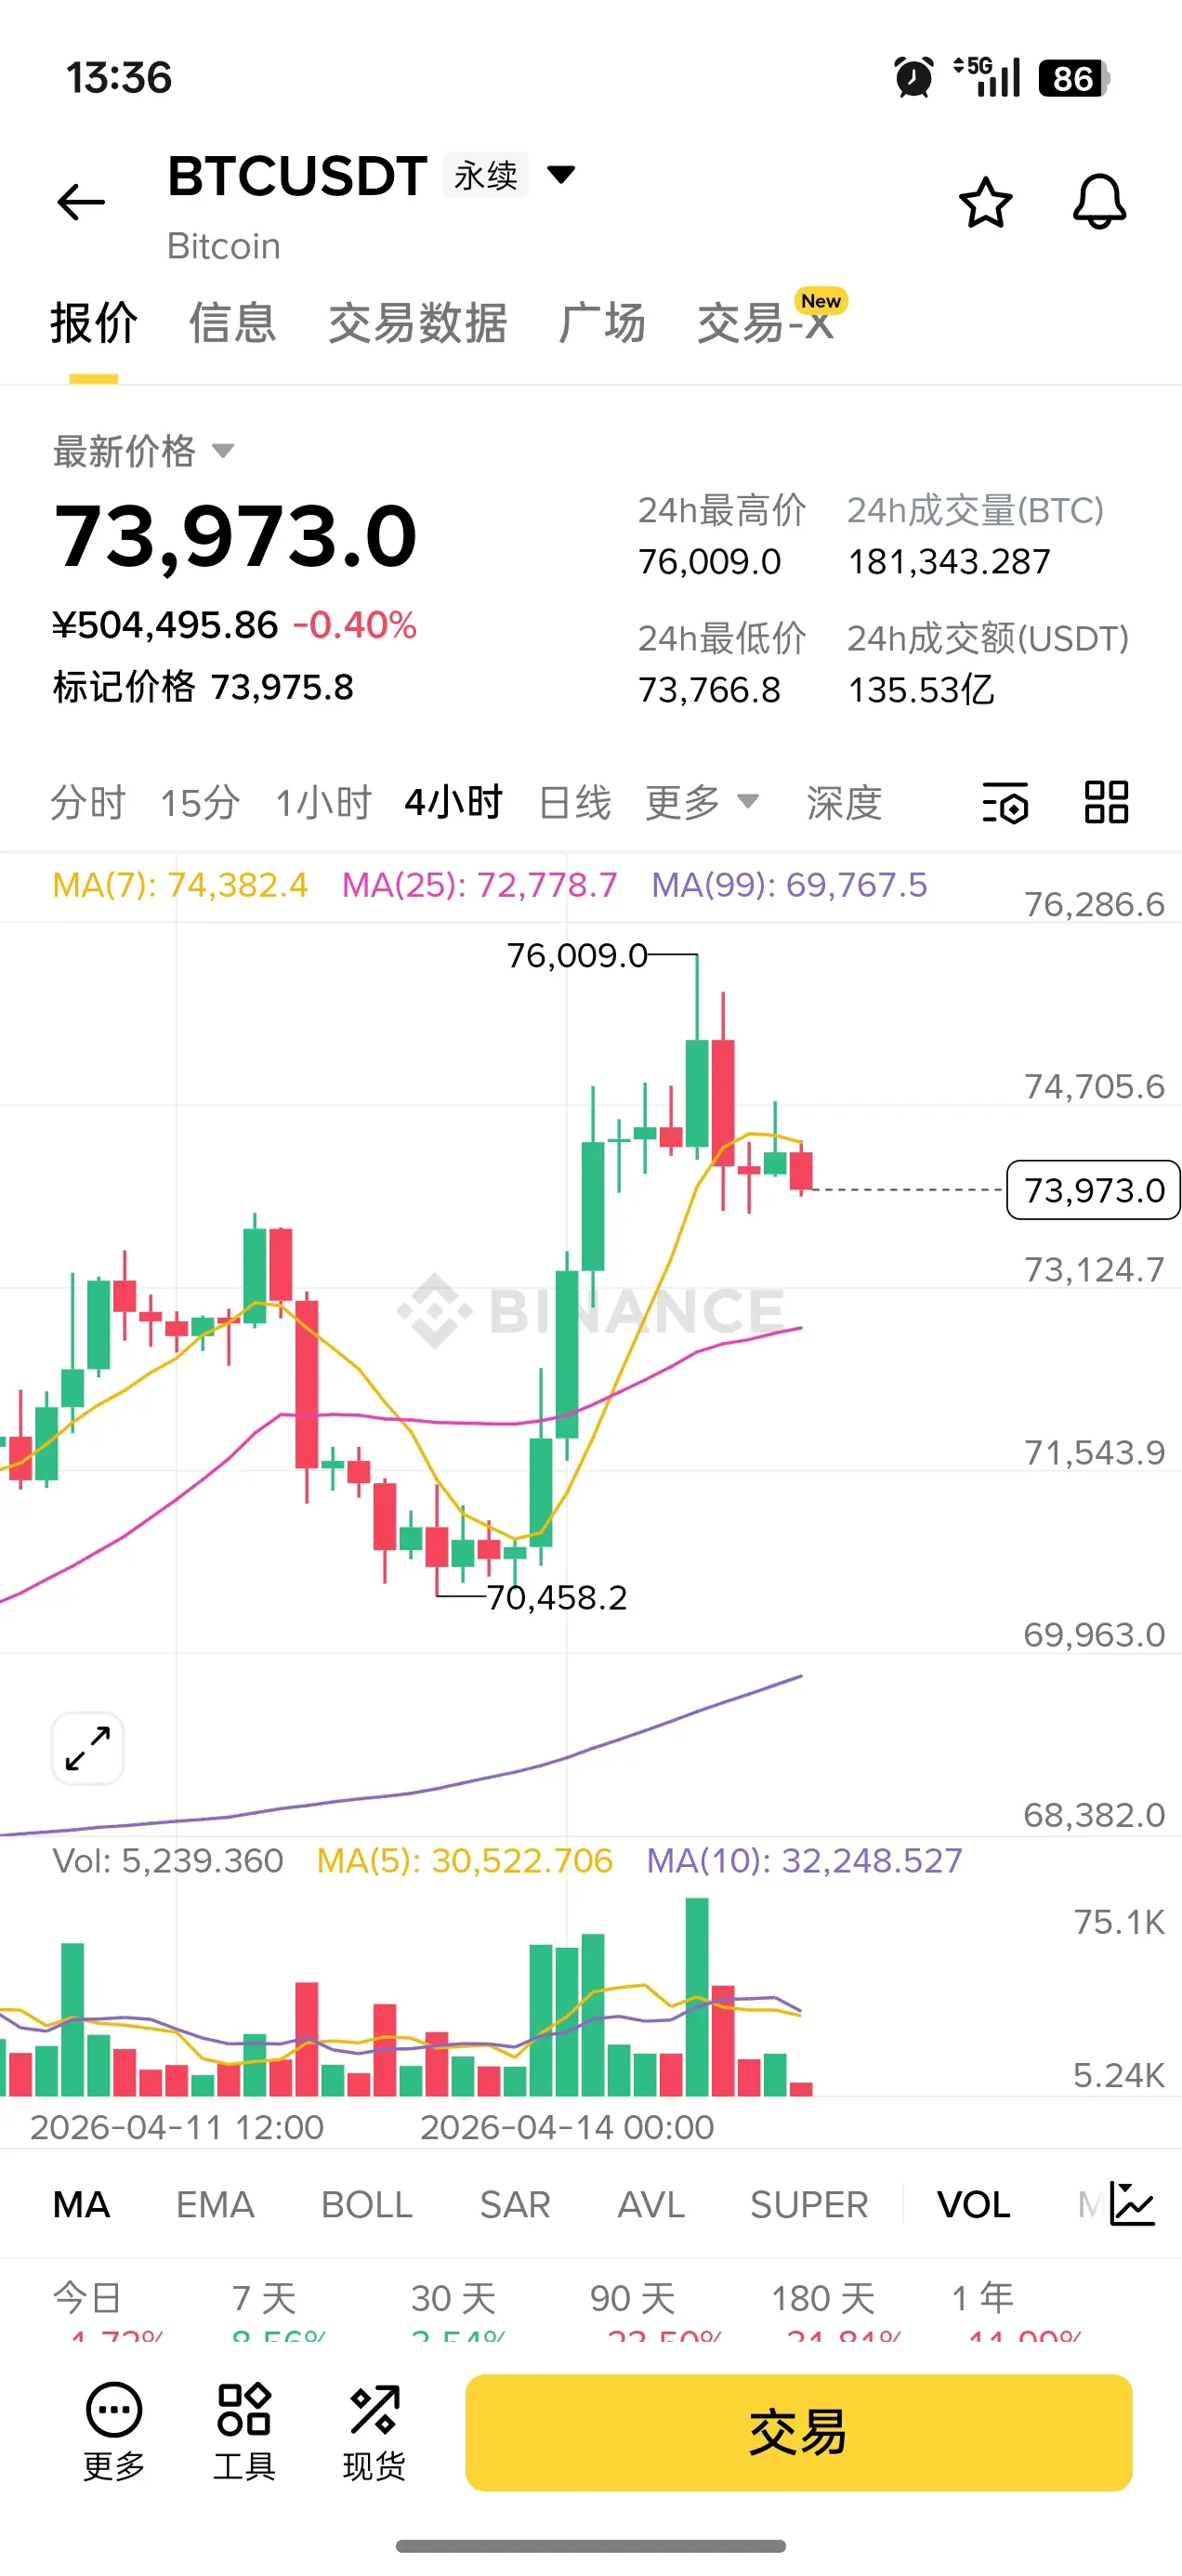
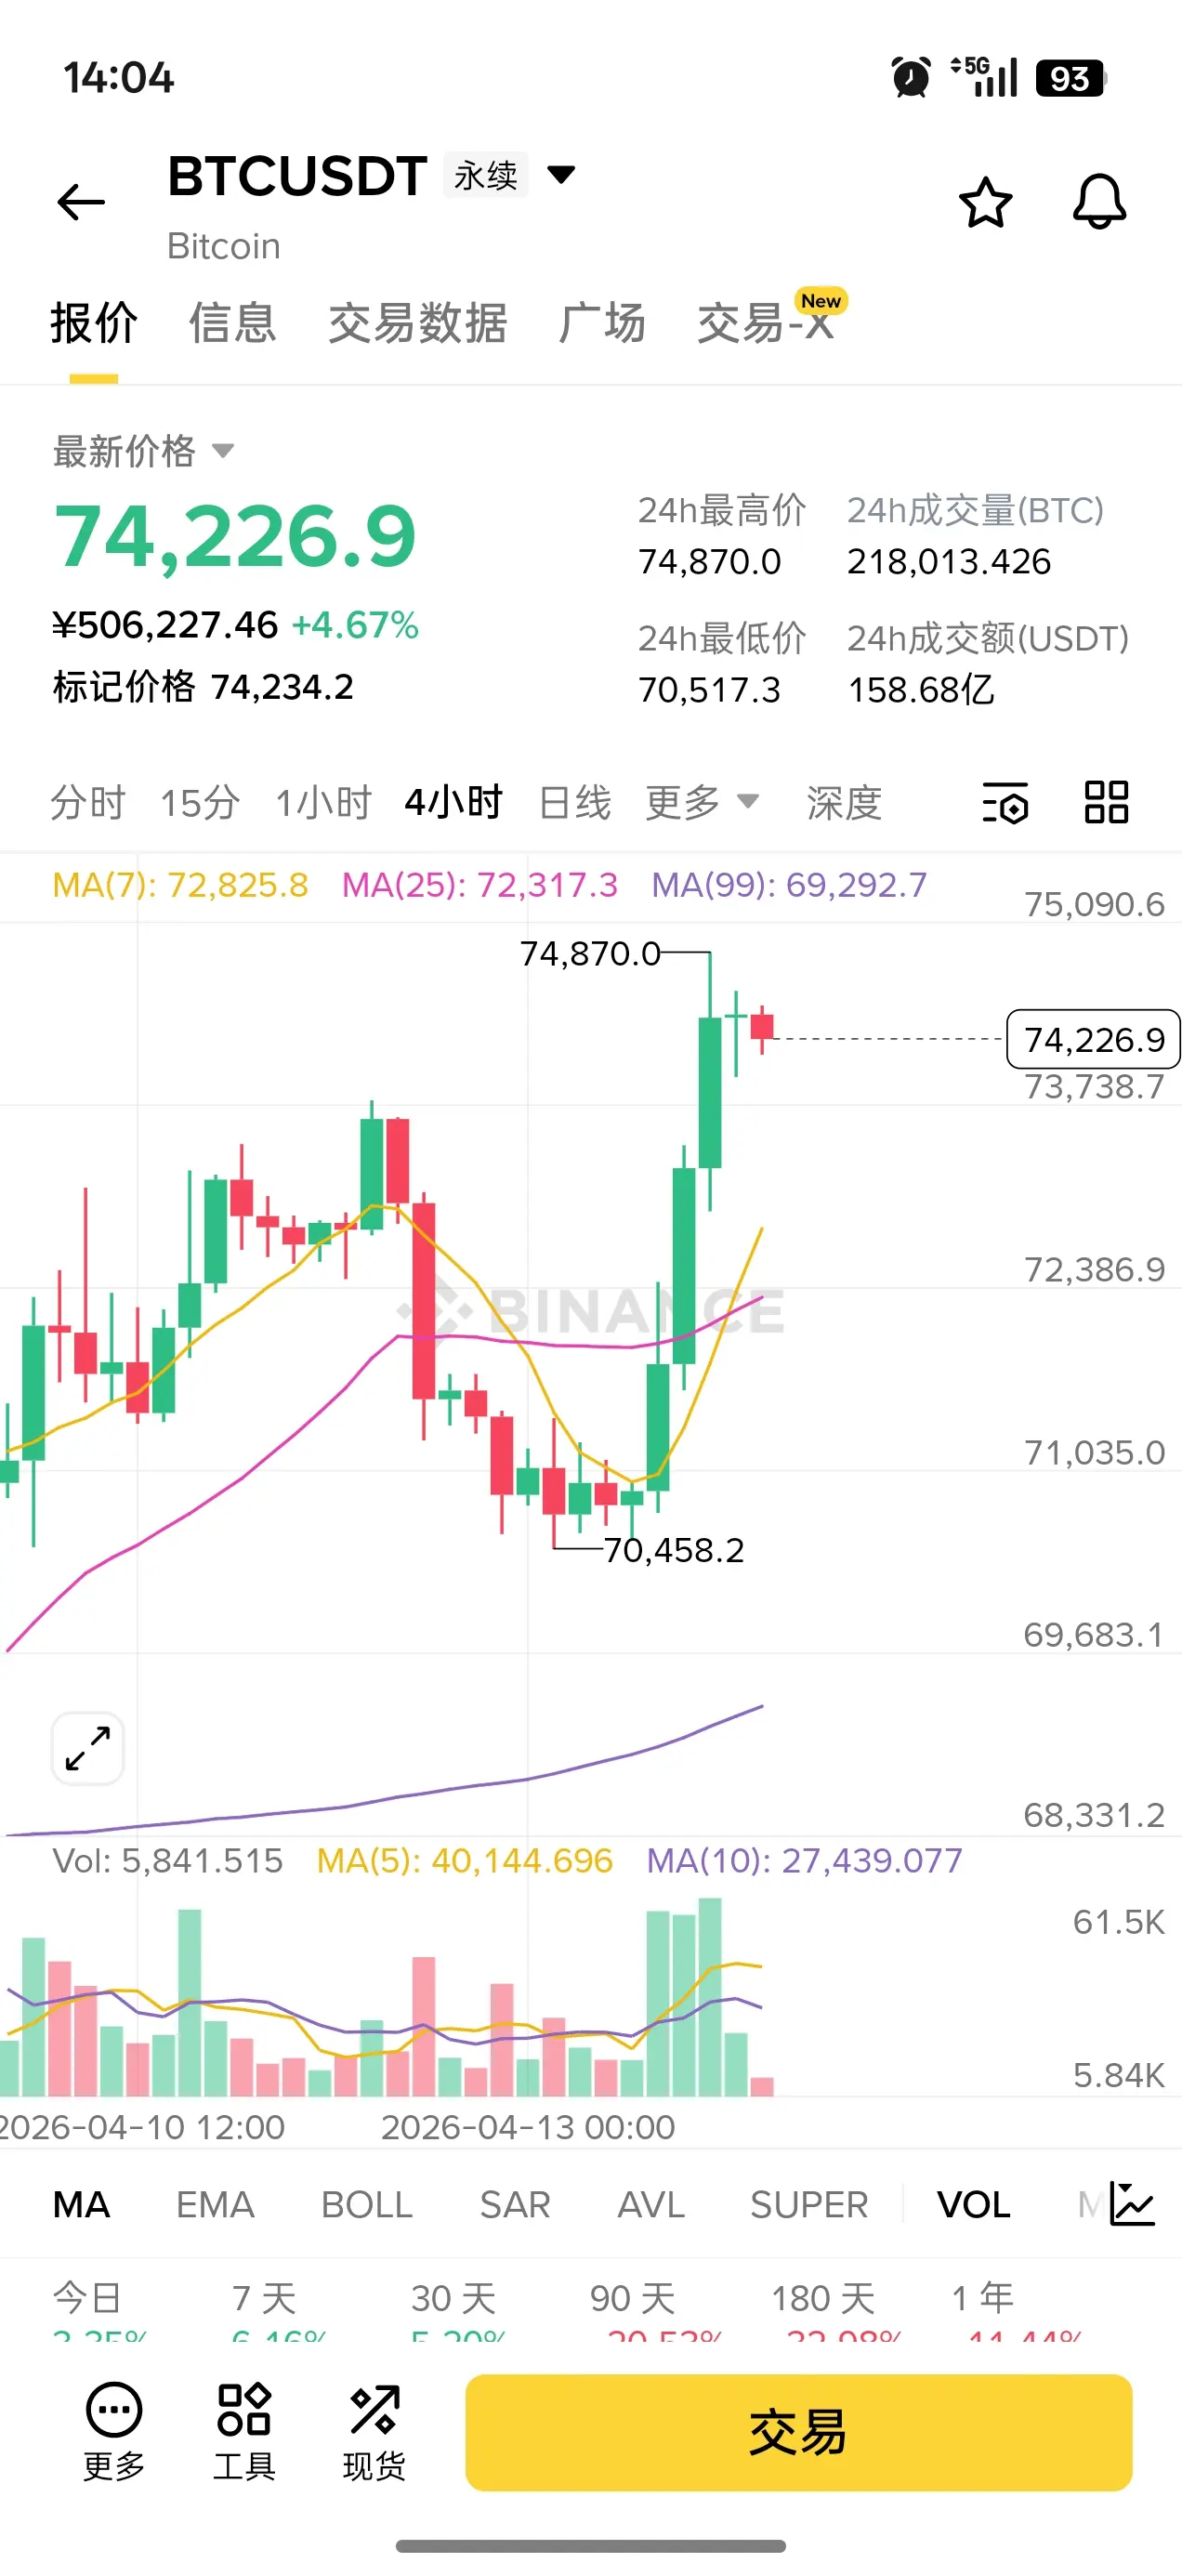
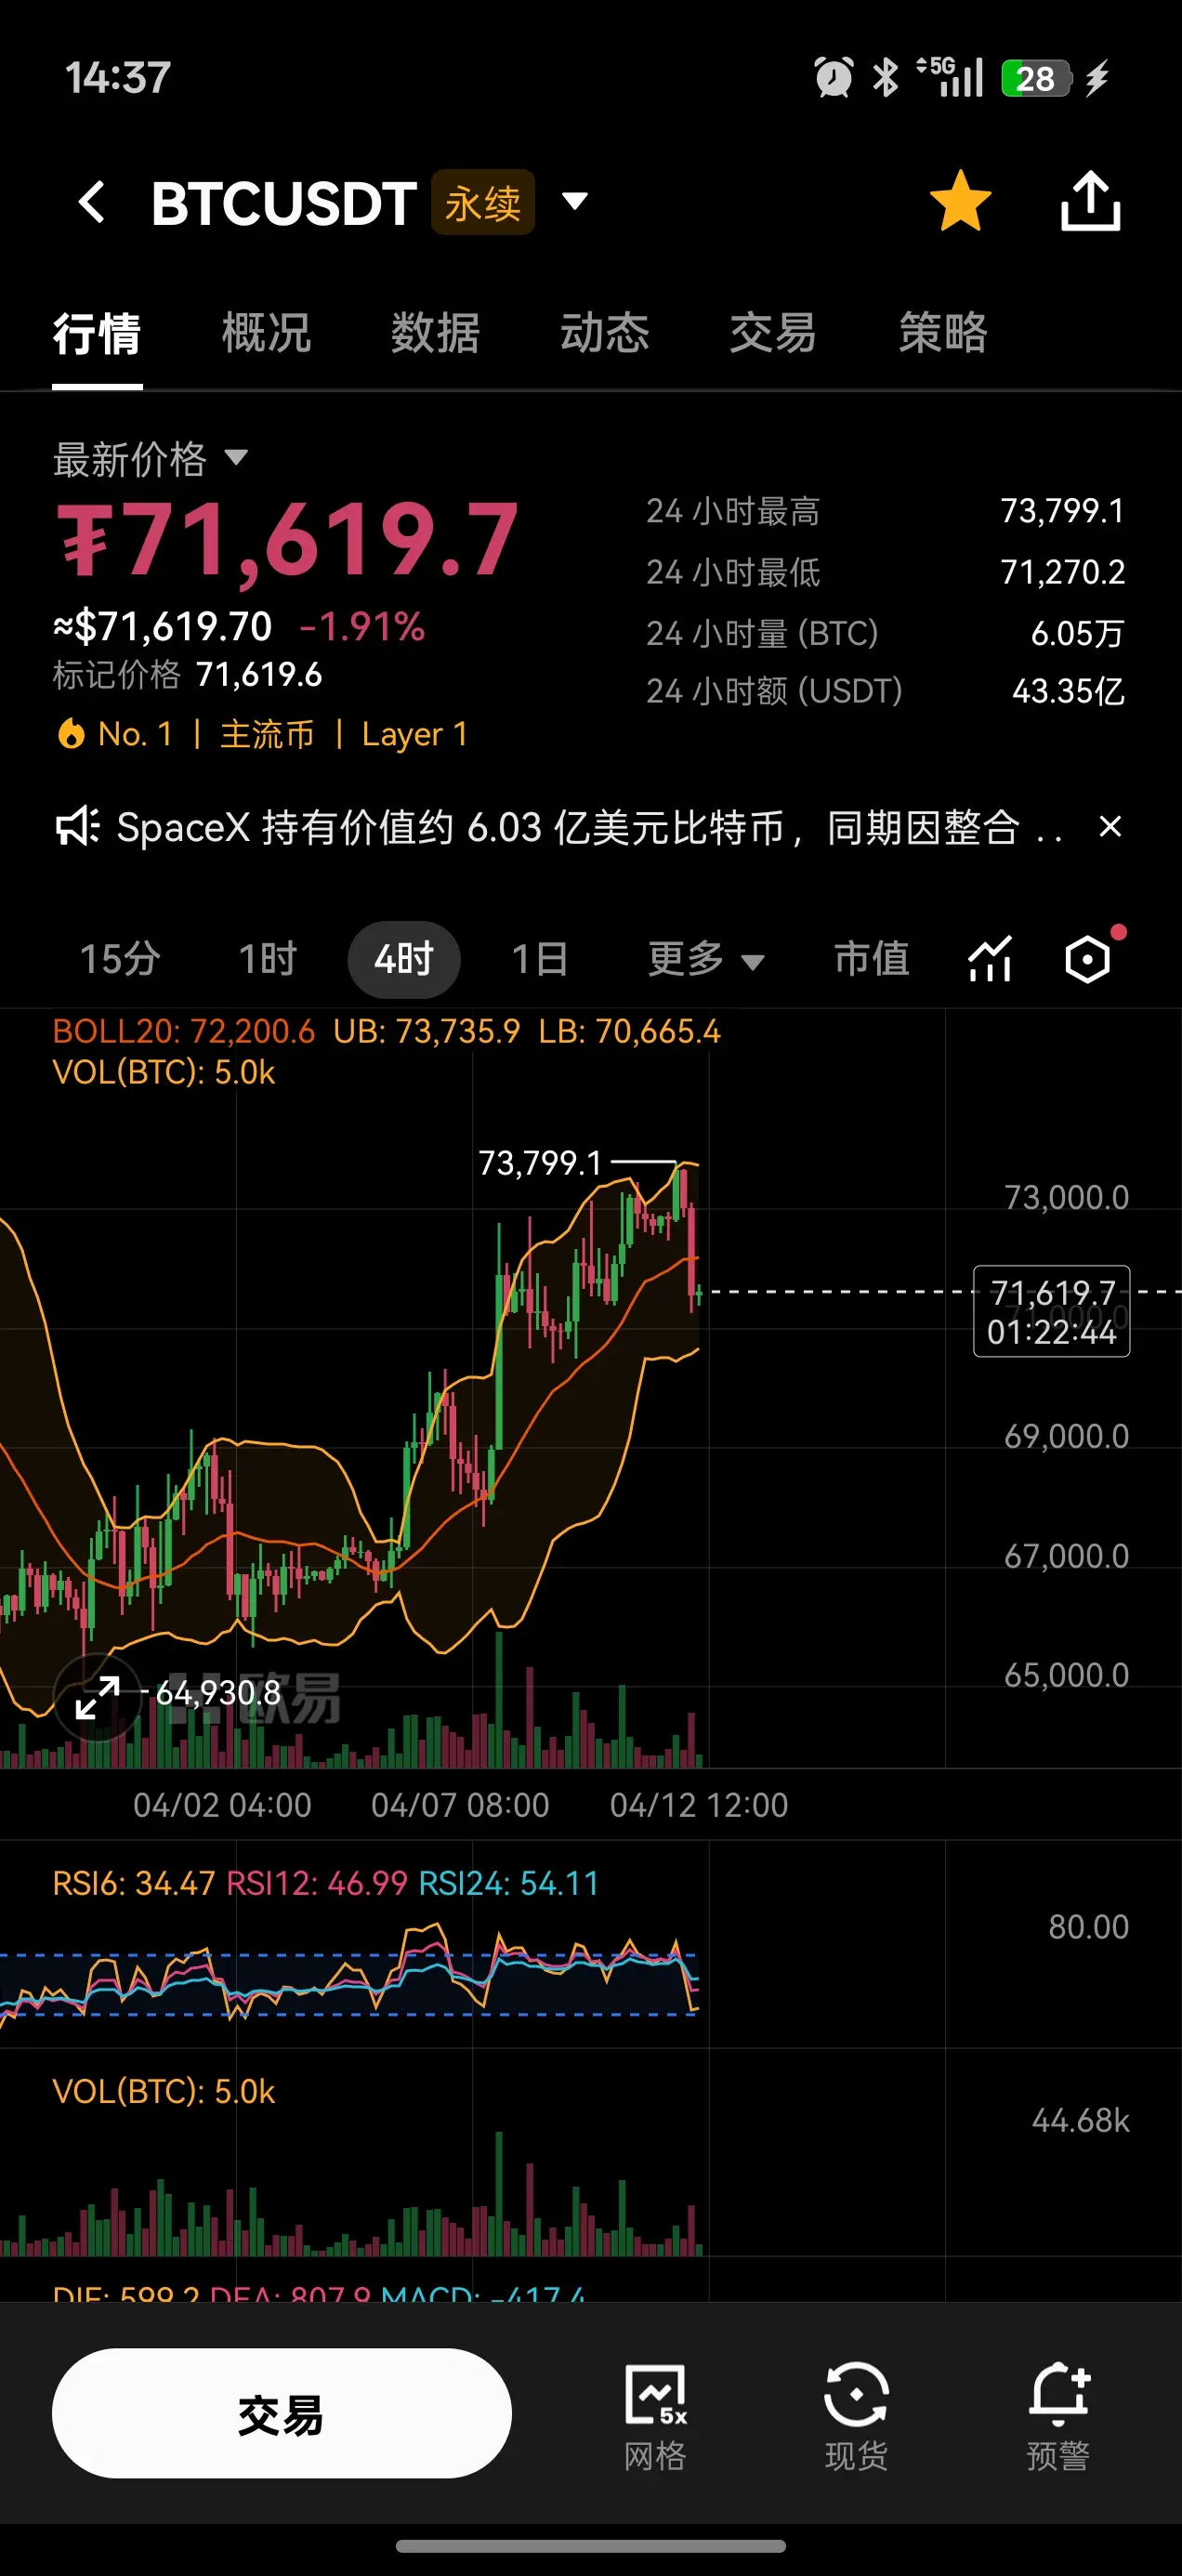
The price encountered resistance near 76,000 as expected and pulled back; the long and short entry points provided yesterday were basically hit. The current price retraced to around 74,000 for a gentle consolidation, like a quiet rest during an upward move.
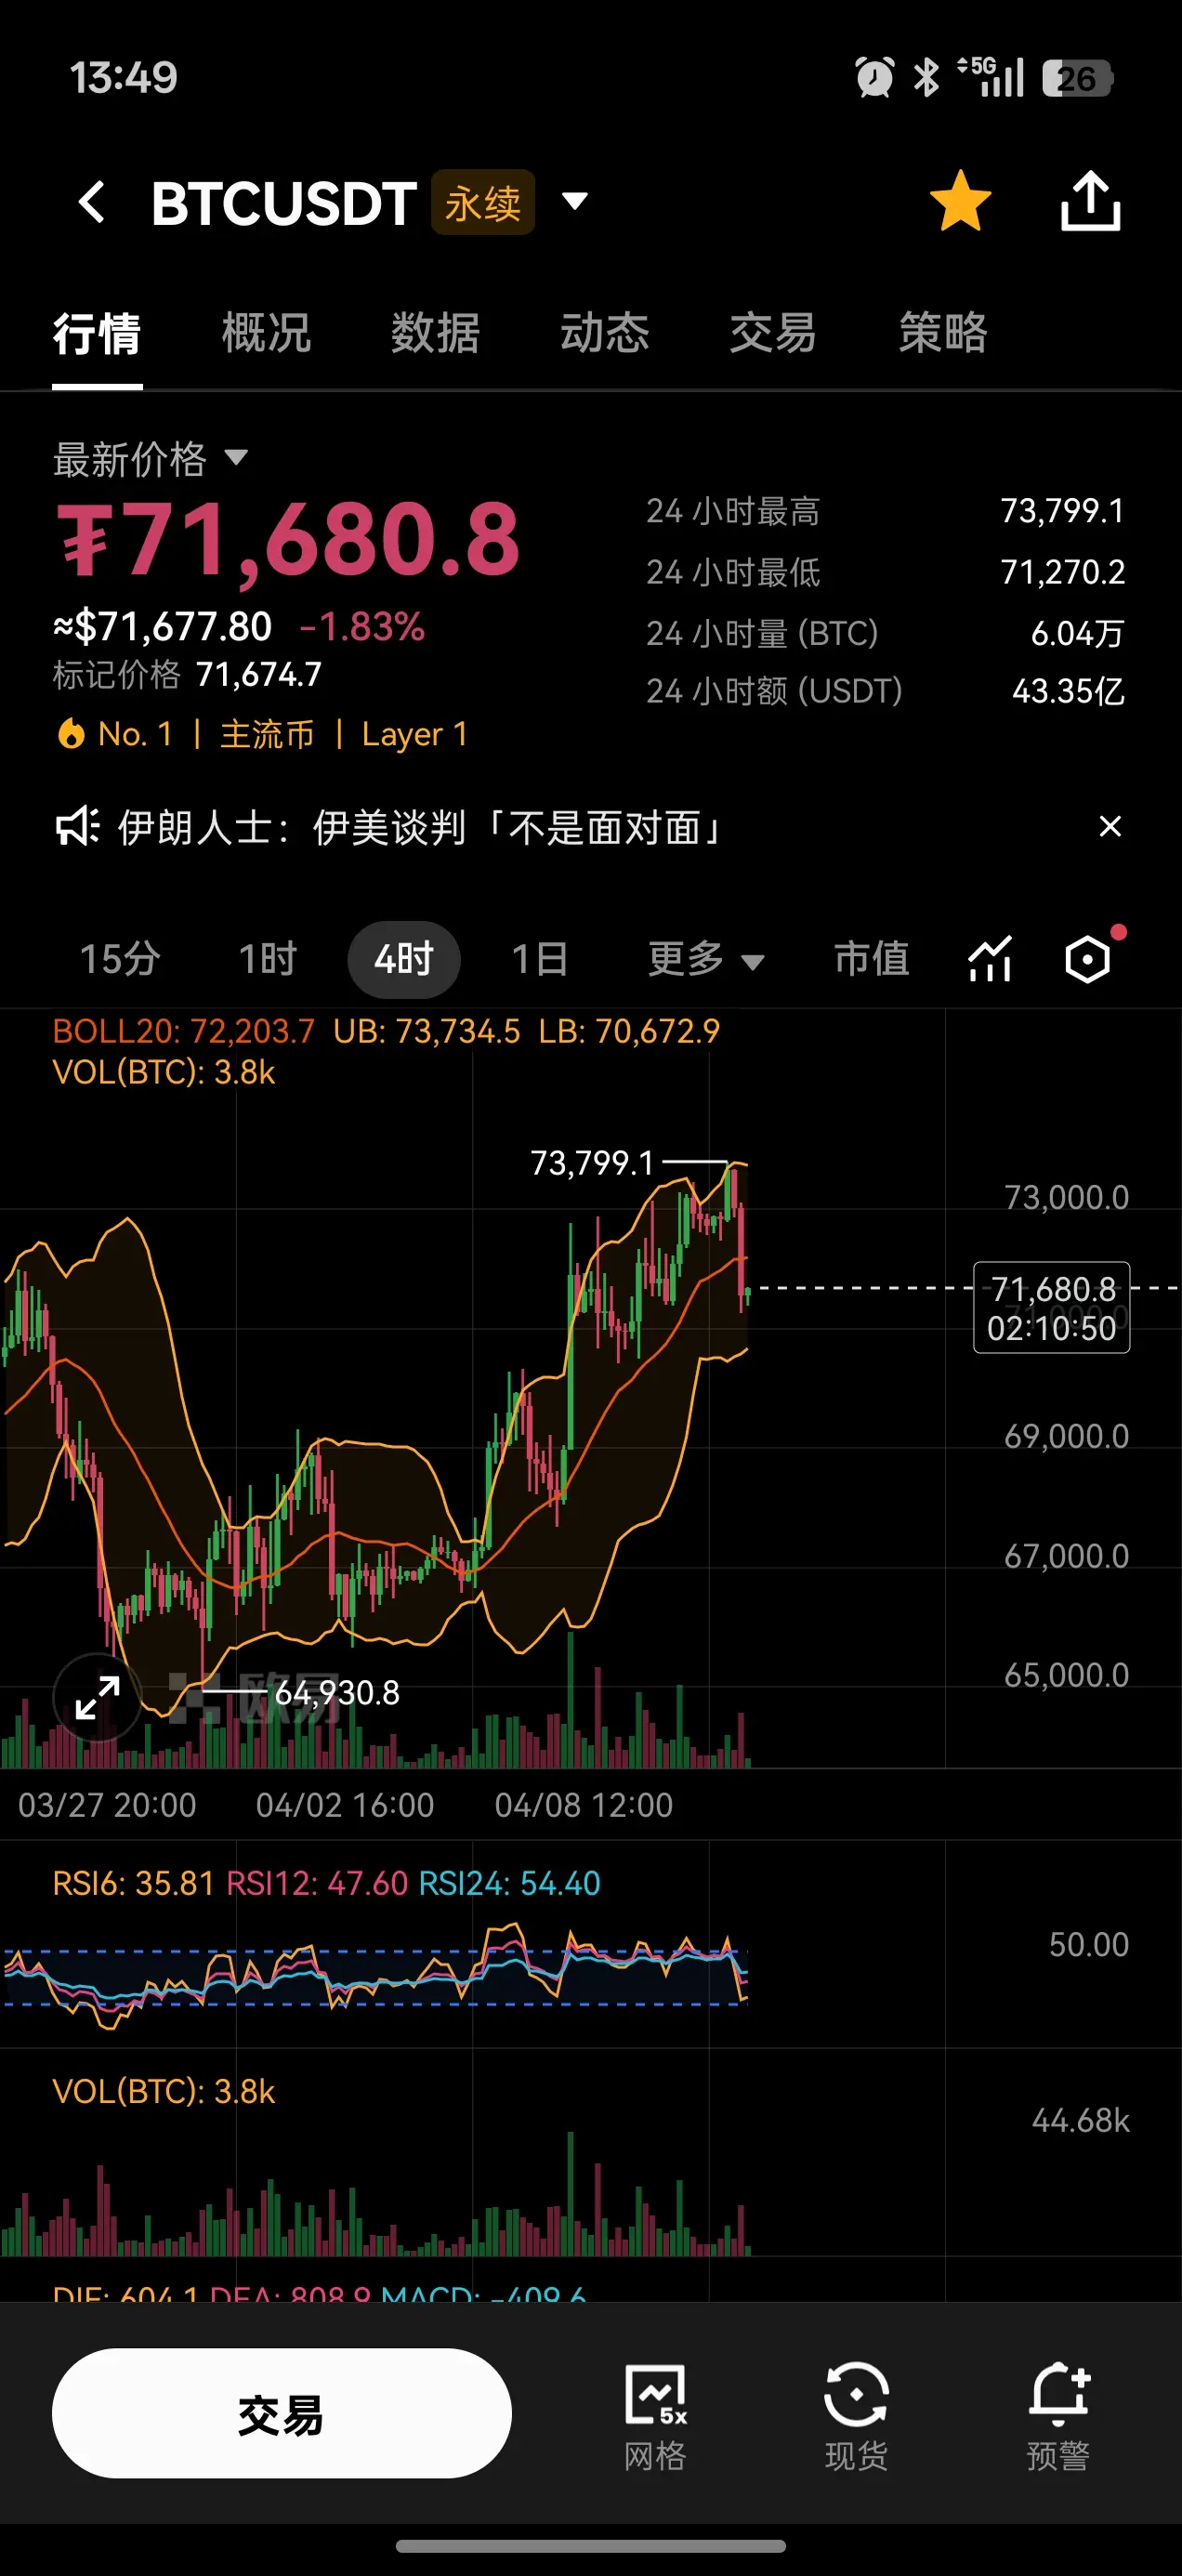
On the daily chart, the trend remains steadily upward, with moving averages providing gentle support; the overall trend is still bullish. The key support zone is between 72,500 and 73,000, while the resistance at 76,000 continues to be monitored for strength. The 4-hour chart shows an intact upward structure; after a brief digestion, a pullback remains a good opportunity for positioning. The 1-hour chart fluctuates steadily within a range, with no clear direction yet, waiting for a trend to emerge.
The overall trend has not reversed; patience is needed for a pullback or correction. As long as the key support holds, there is still a chance for another upward wave.
4.15 Bitcoin Trading Strategy
1. Long positions: Enter on a pullback to 73,100-73,800, with a stop-loss below 72,300, targeting 75,000-75,700; if it breaks 76,000, look for a move toward 77,000.
2. Short positions: Enter on a rebound at 75,800-75,000, leaving room for additional entries near 77,000, with a 800-point stop-loss, targeting 73,800-73,000.
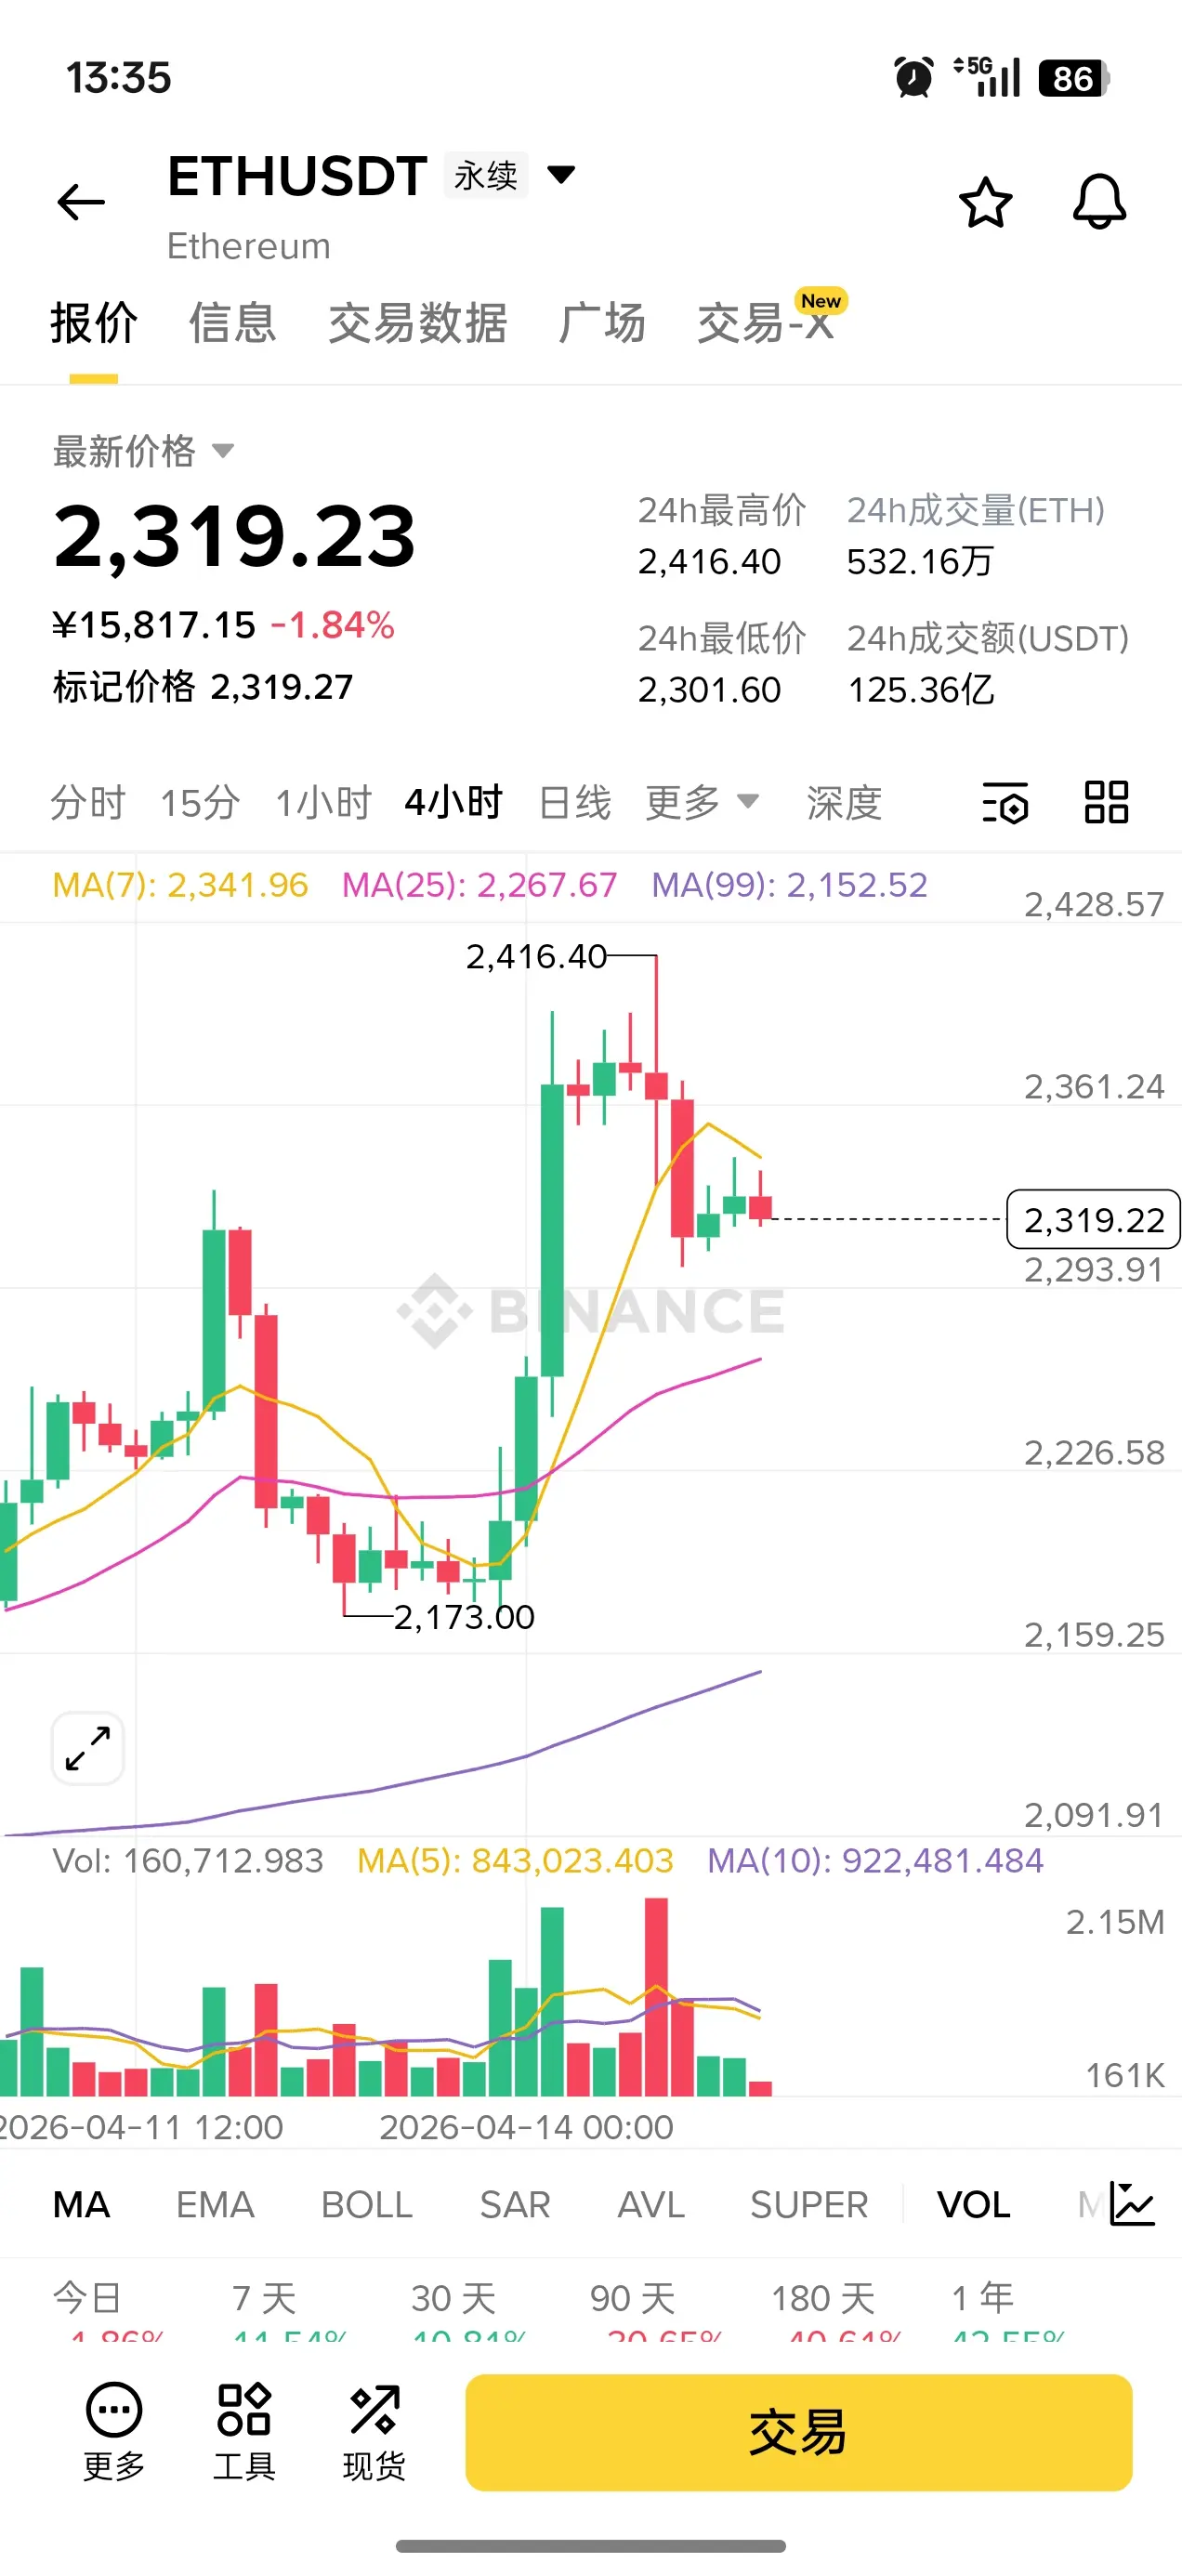
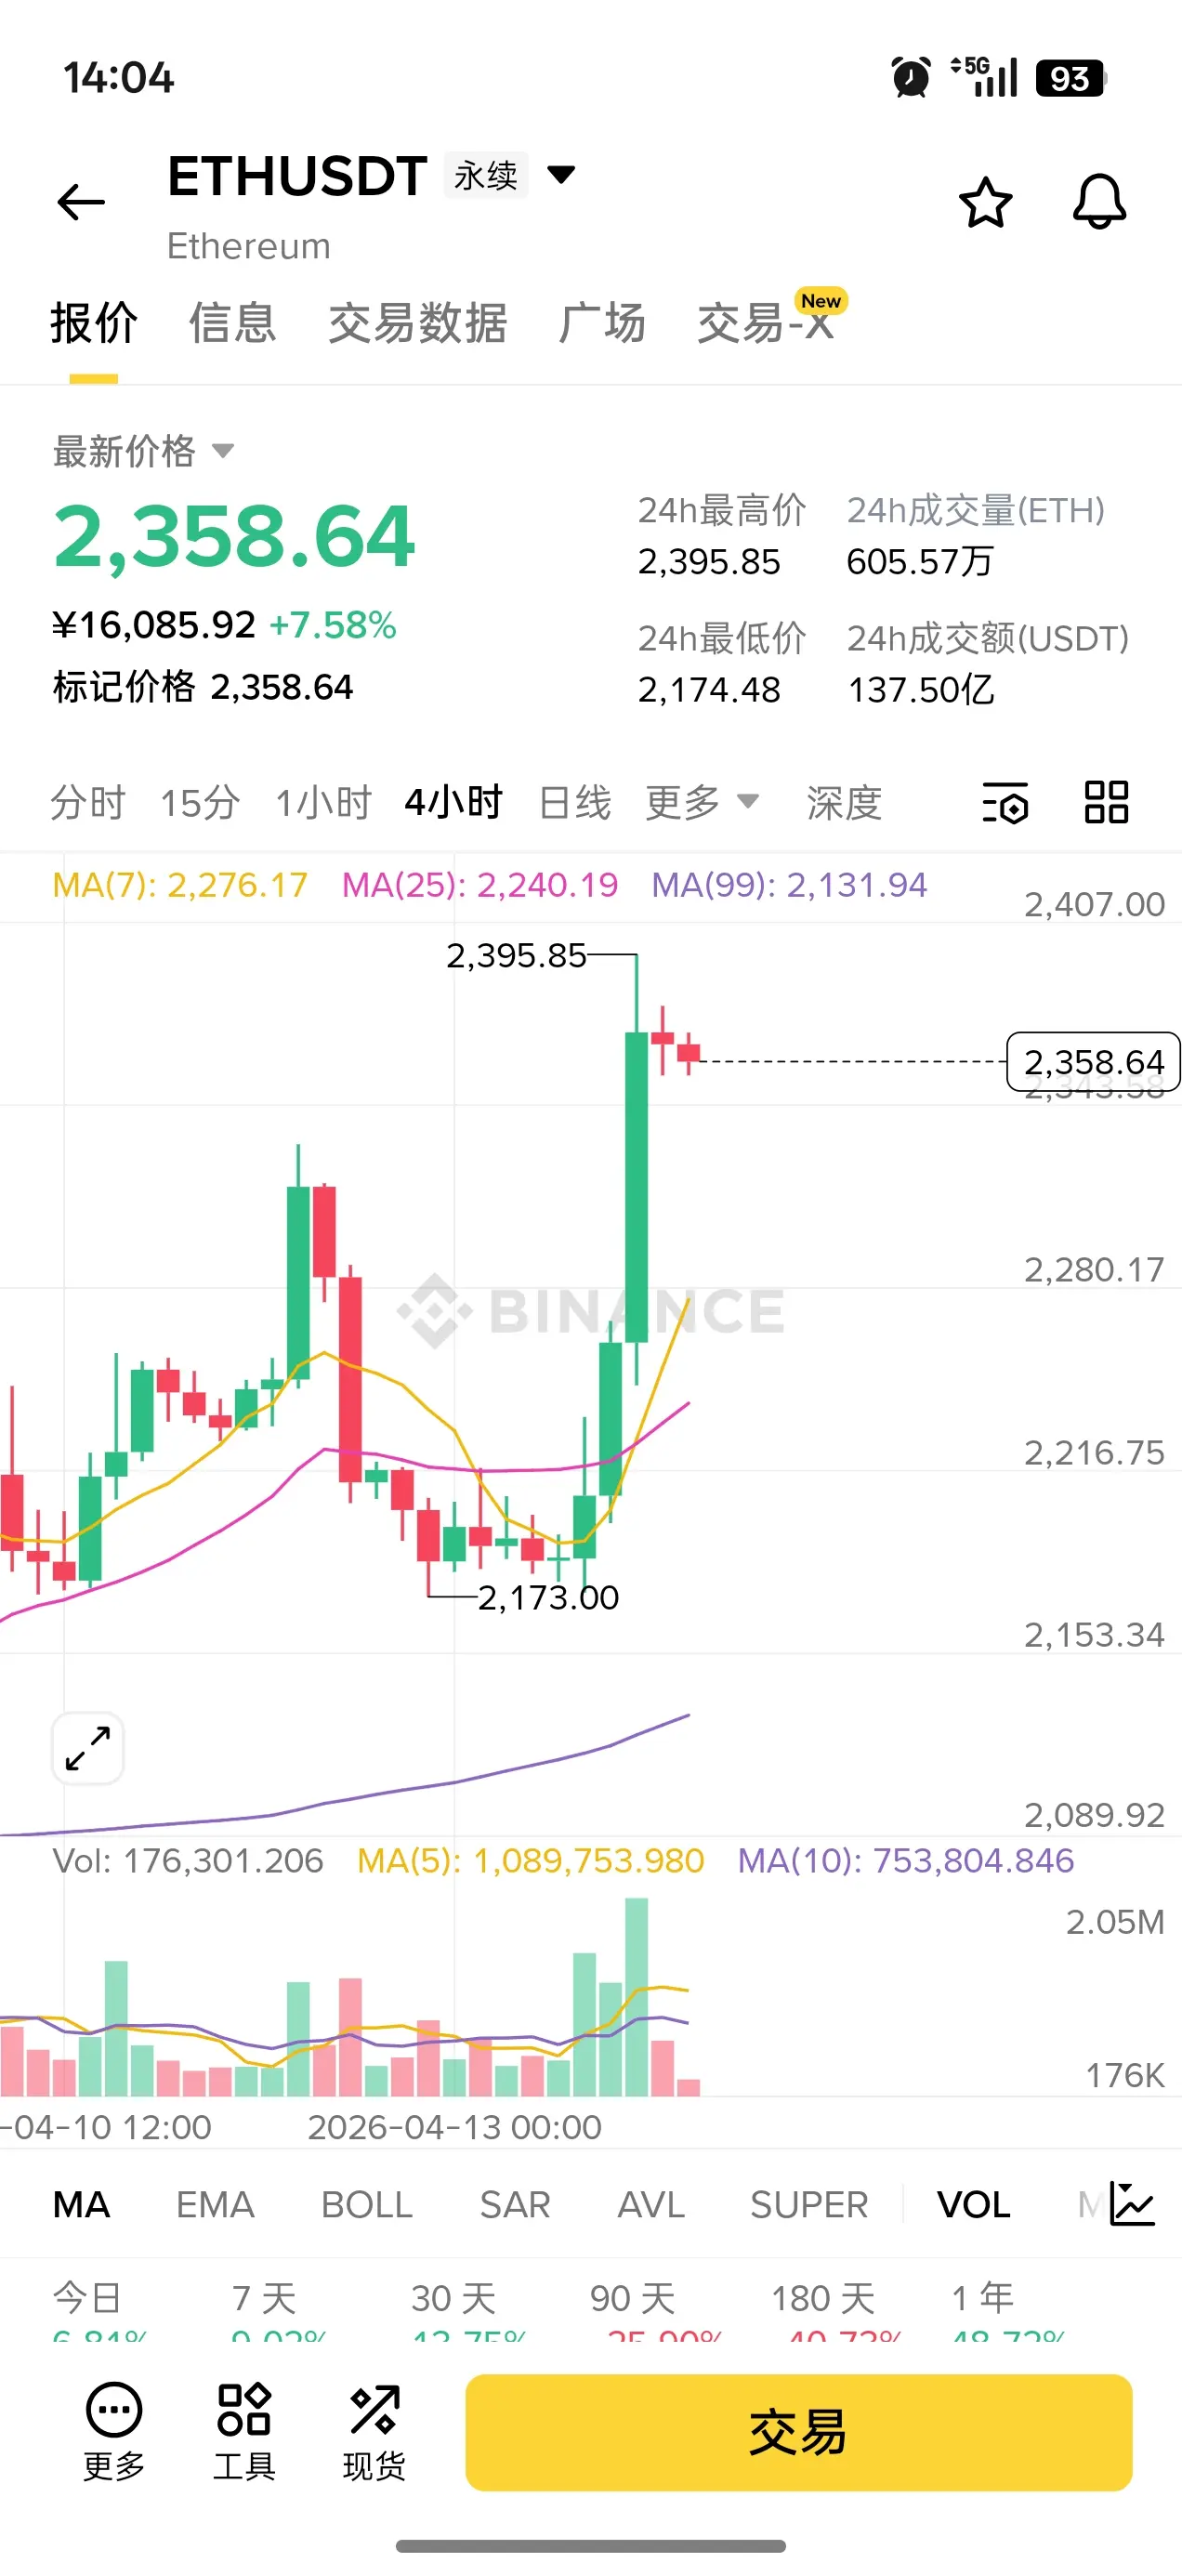
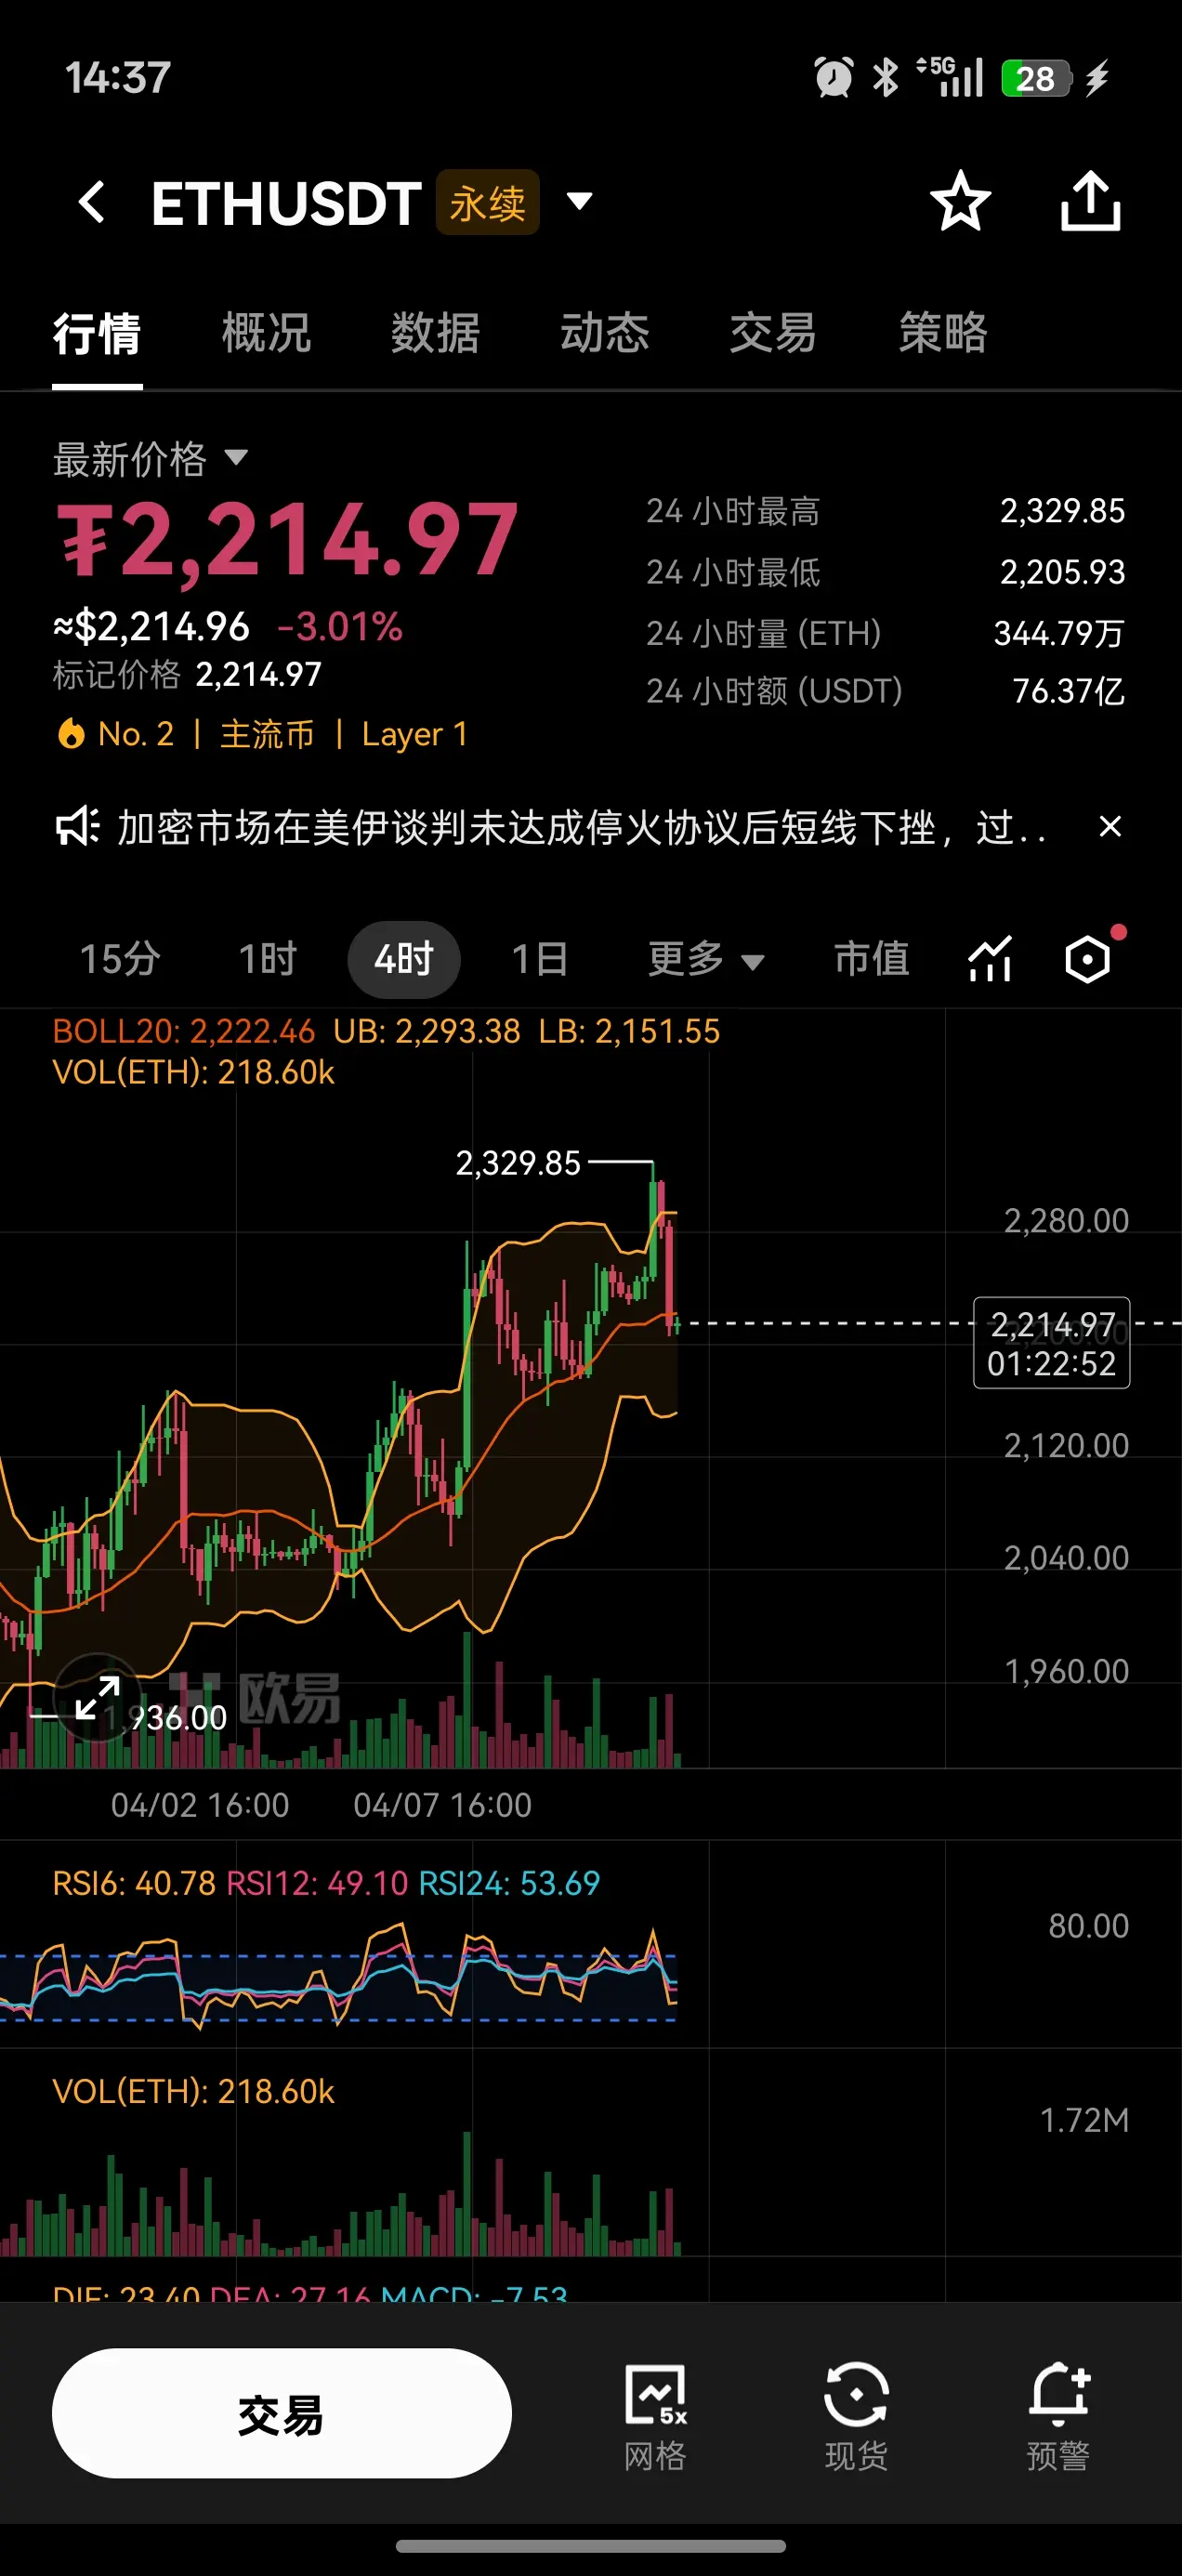
4.15 Ethereum Trading Strategy
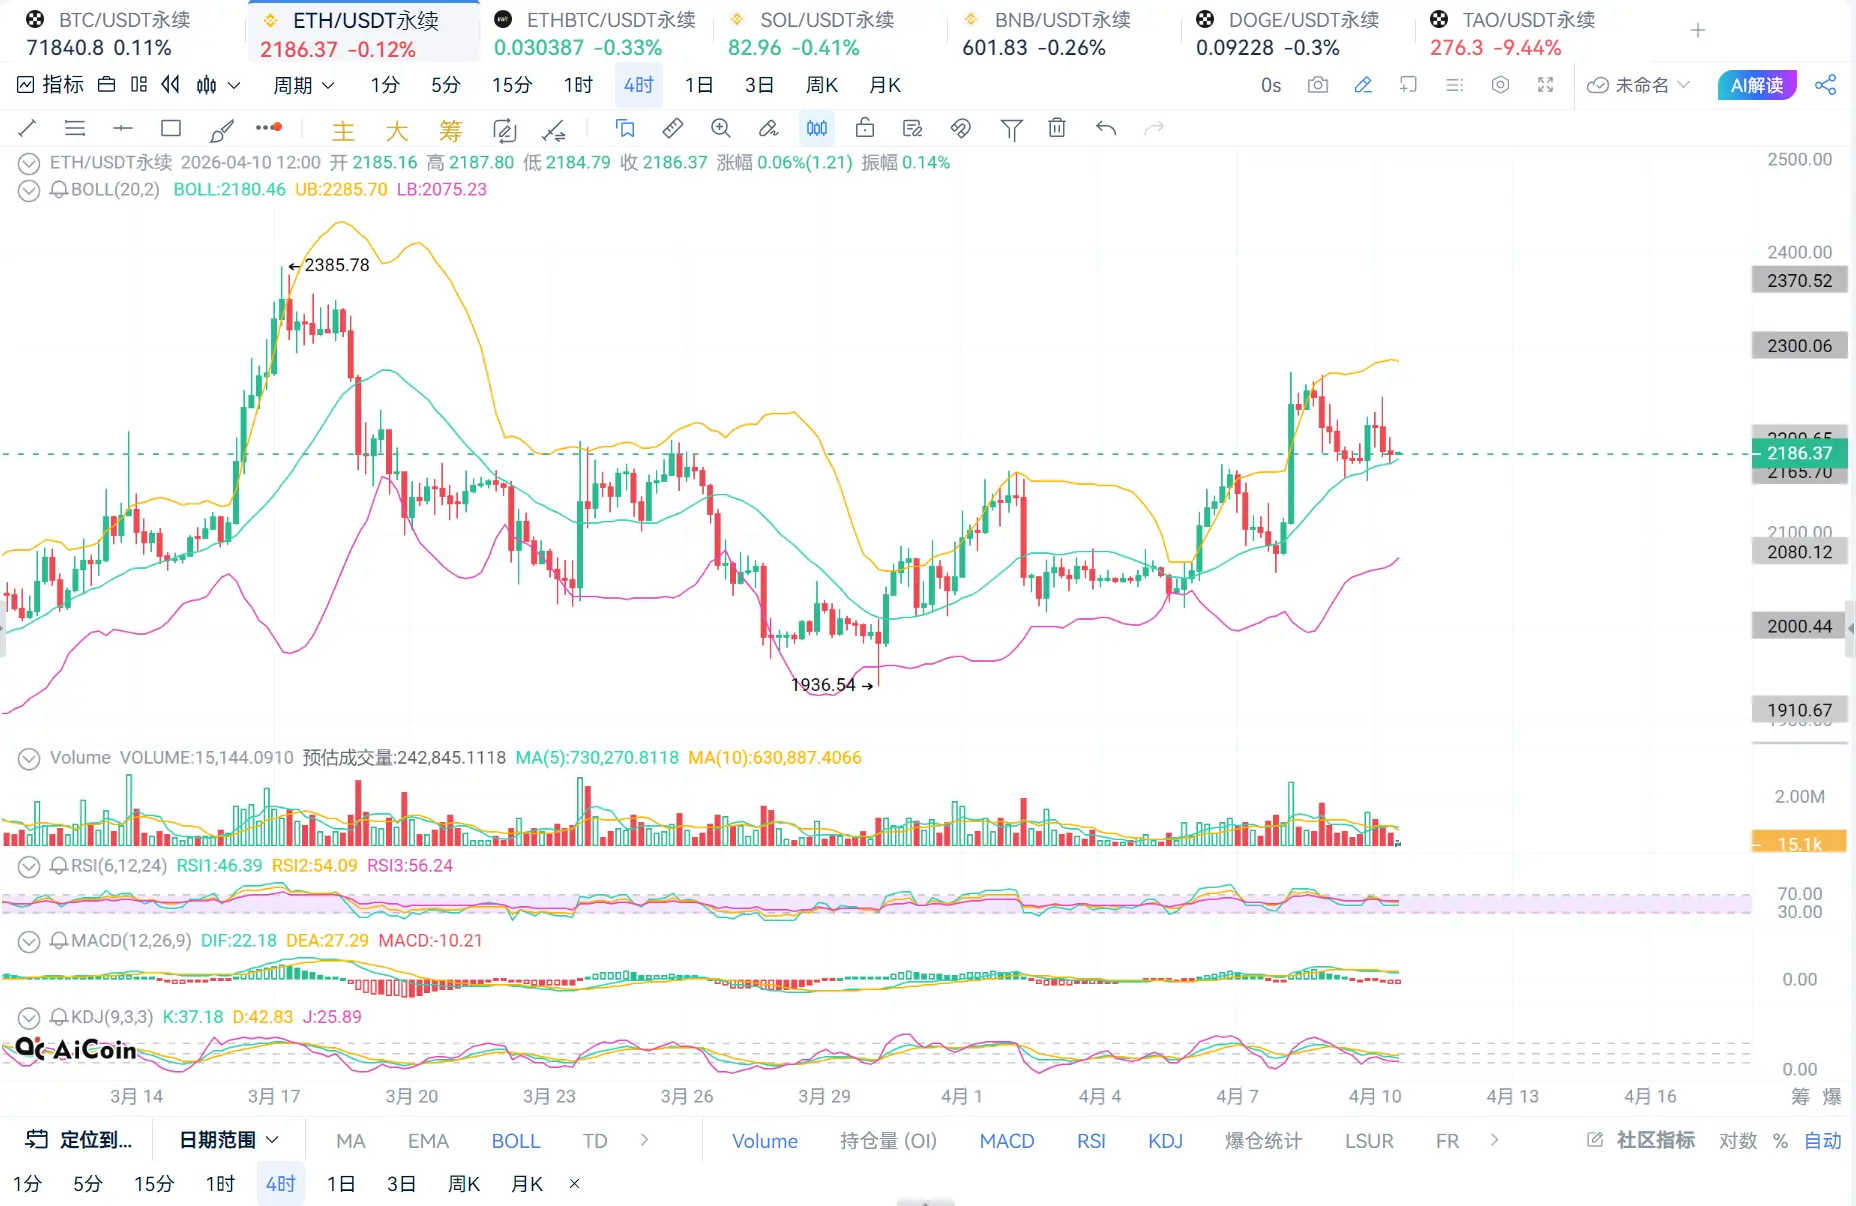
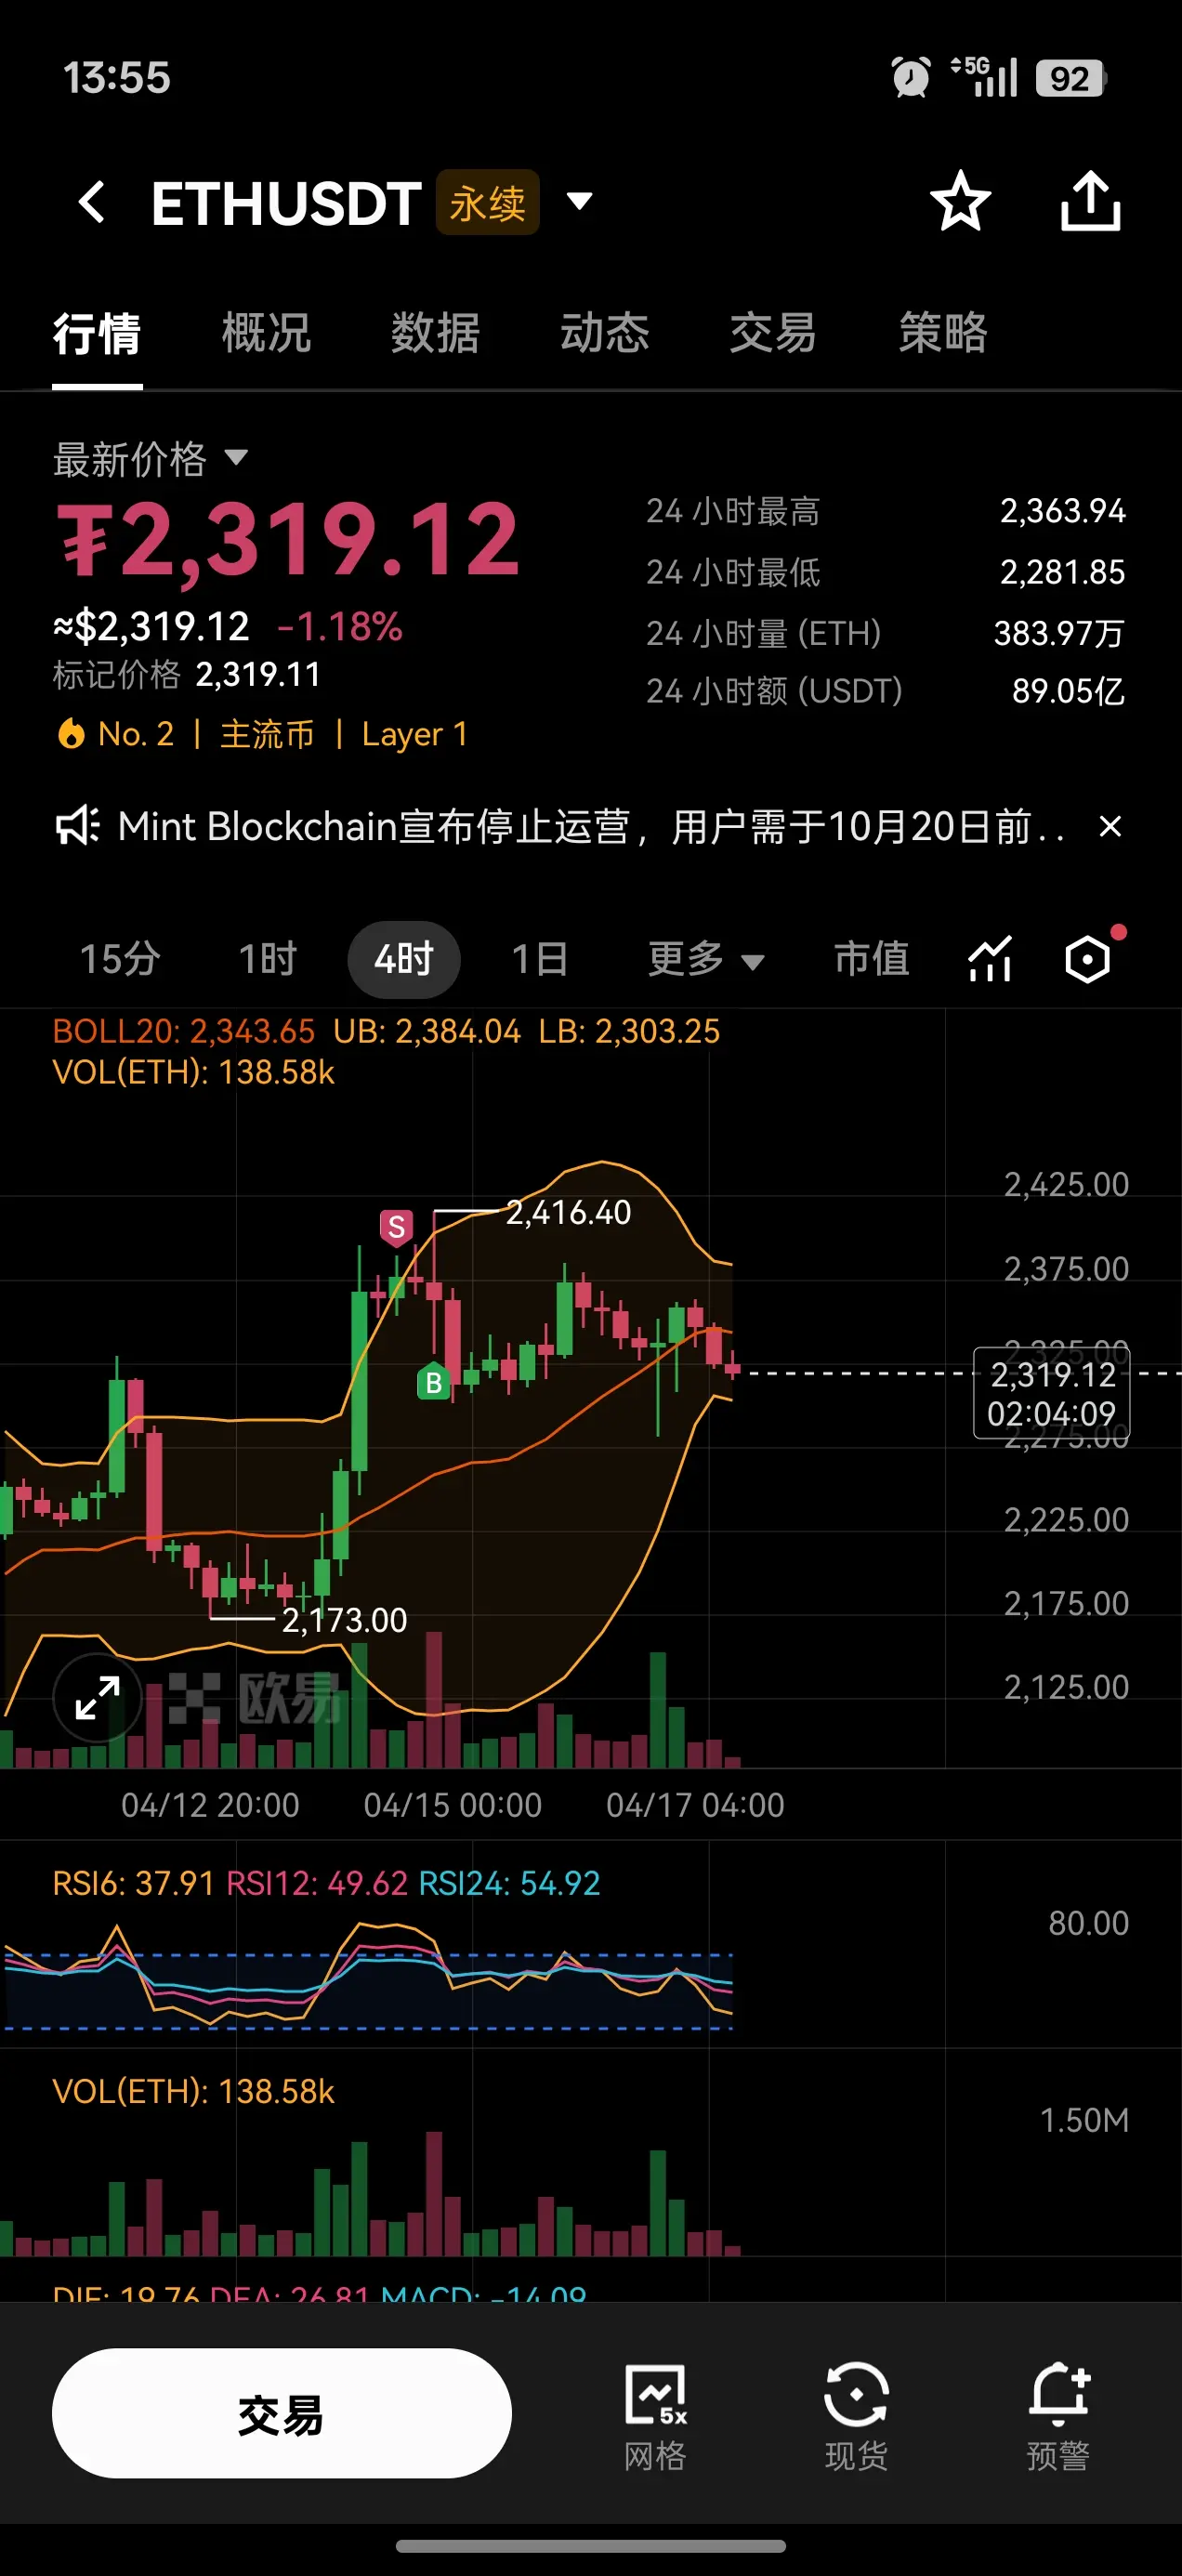
1. Long positions: Enter on a pullback to 2,250-2,280, with a stop-loss below 2,220, targeting 2,350-2,380.
2. Short positions: Enter on a rebound at 2,380-2,350, with a stop-loss above 2,410, targeting 2,280-2,250.
The price encountered resistance near 76,000 as expected and pulled back; the long and short entry points provided yesterday were basically hit. The current price retraced to around 74,000 for a gentle consolidation, like a quiet rest during an upward move.
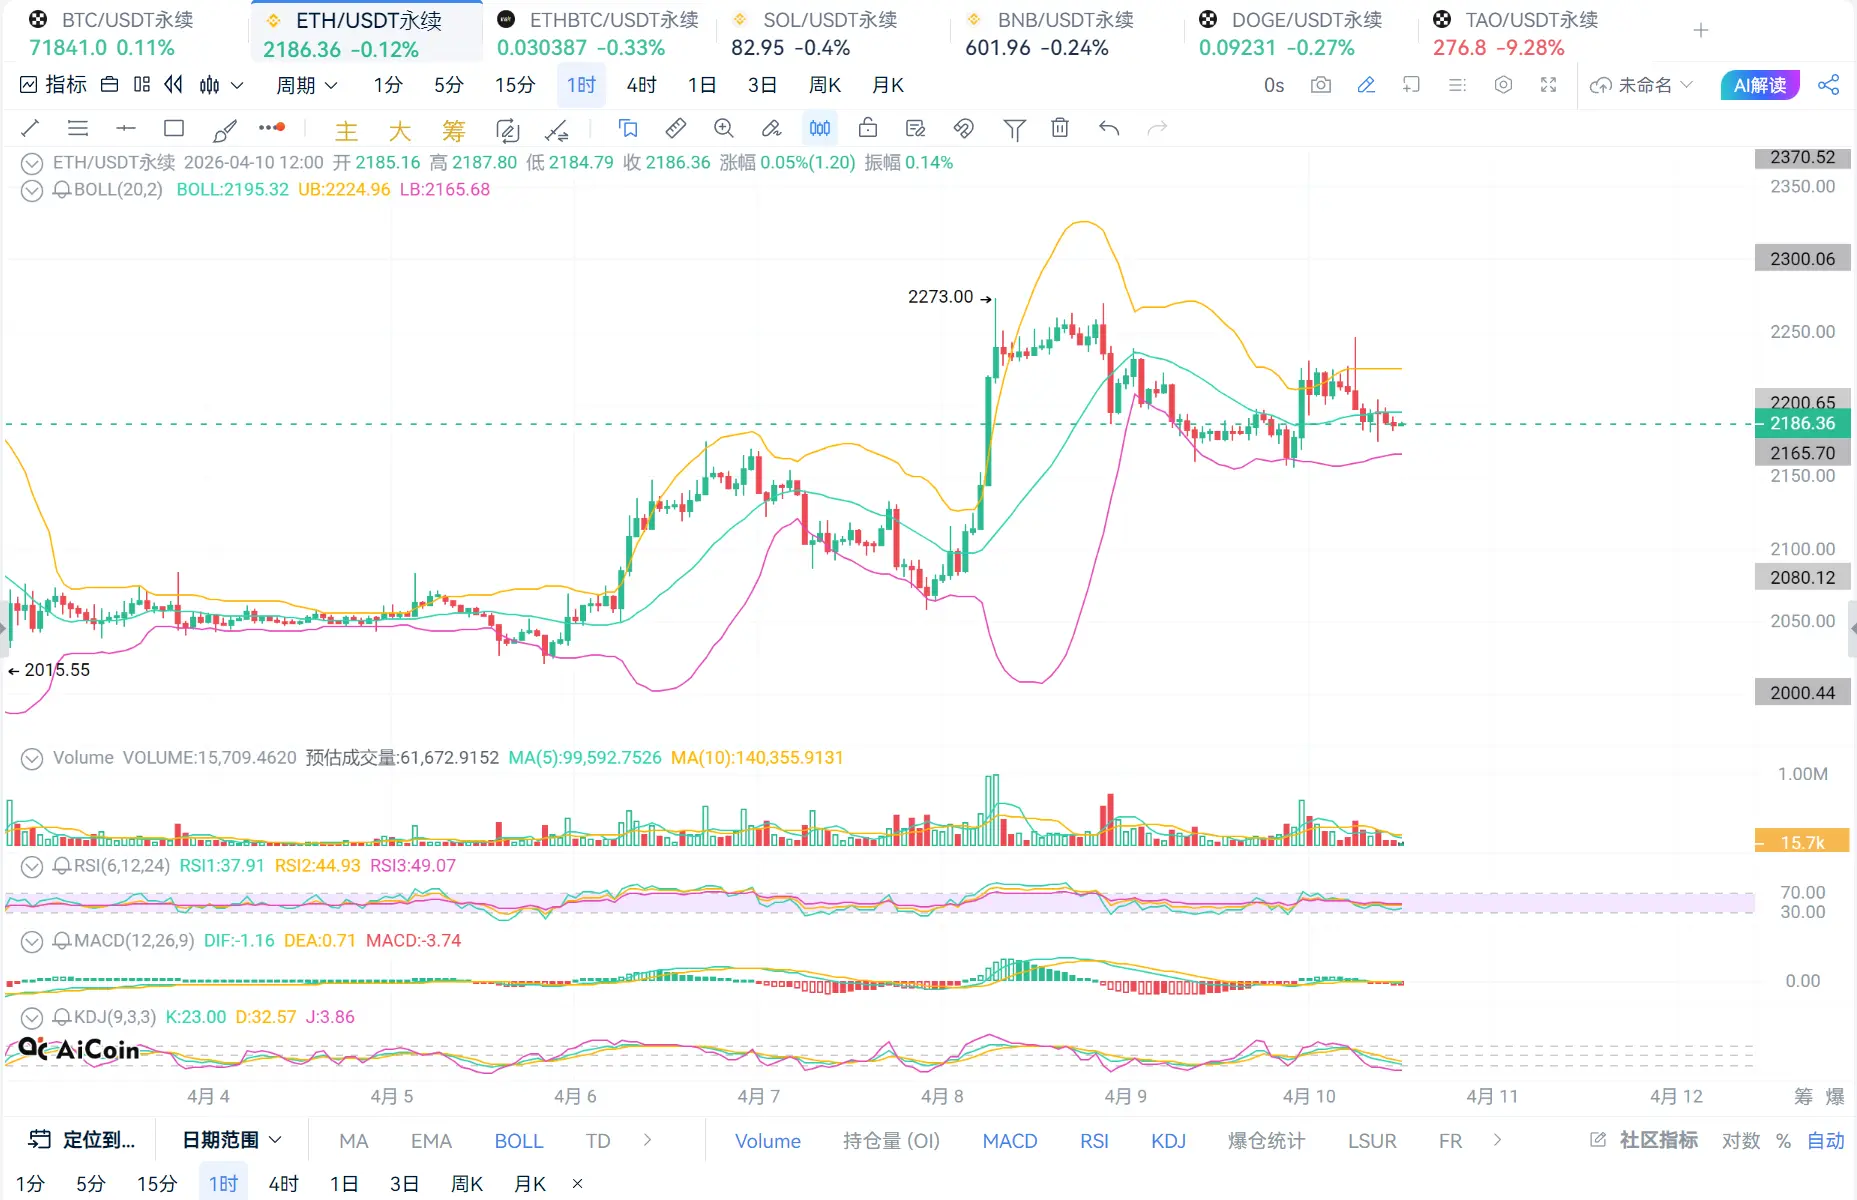
On the daily chart, the trend remains steadily upward, with moving averages providing gentle support; the overall trend is still bullish. The key support zone is between 72,500 and 73,000, while the resistance at 76,000 continues to be monitored for strength. The 4-hour chart shows an intact upward structure; after a brief digestion, a pullback remains a good opportunity for positioning. The 1-hour chart fluctuates steadily within a range, with no clear direction yet, waiting for a trend to emerge.
The overall trend has not reversed; patience is needed for a pullback or correction. As long as the key support holds, there is still a chance for another upward wave.
4.15 Bitcoin Trading Strategy
1. Long positions: Enter on a pullback to 73,100-73,800, with a stop-loss below 72,300, targeting 75,000-75,700; if it breaks 76,000, look for a move toward 77,000.
2. Short positions: Enter on a rebound at 75,800-75,000, leaving room for additional entries near 77,000, with a 800-point stop-loss, targeting 73,800-73,000.
4.15 Ethereum Trading Strategy
1. Long positions: Enter on a pullback to 2,250-2,280, with a stop-loss below 2,220, targeting 2,350-2,380.
2. Short positions: Enter on a rebound at 2,380-2,350, with a stop-loss above 2,410, targeting 2,280-2,250.