Last week, a whale that has held more than $BTC for over seven years sold approximately $271 million worth of Bitcoin, setting a record for the highest single-day activity since January 10. In January, similarly sized sell-offs triggered a 13% market pullback within two weeks; this time, on-chain data shows the market’s ability to absorb has strengthened, and long-term holders are accumulating Bitcoin faster. Analysts believe Bitcoin could remain in the $70,000 to $72,000 range.
Details of the OG Whale Sell-Off: Scale, Timing, and Historical Comparison
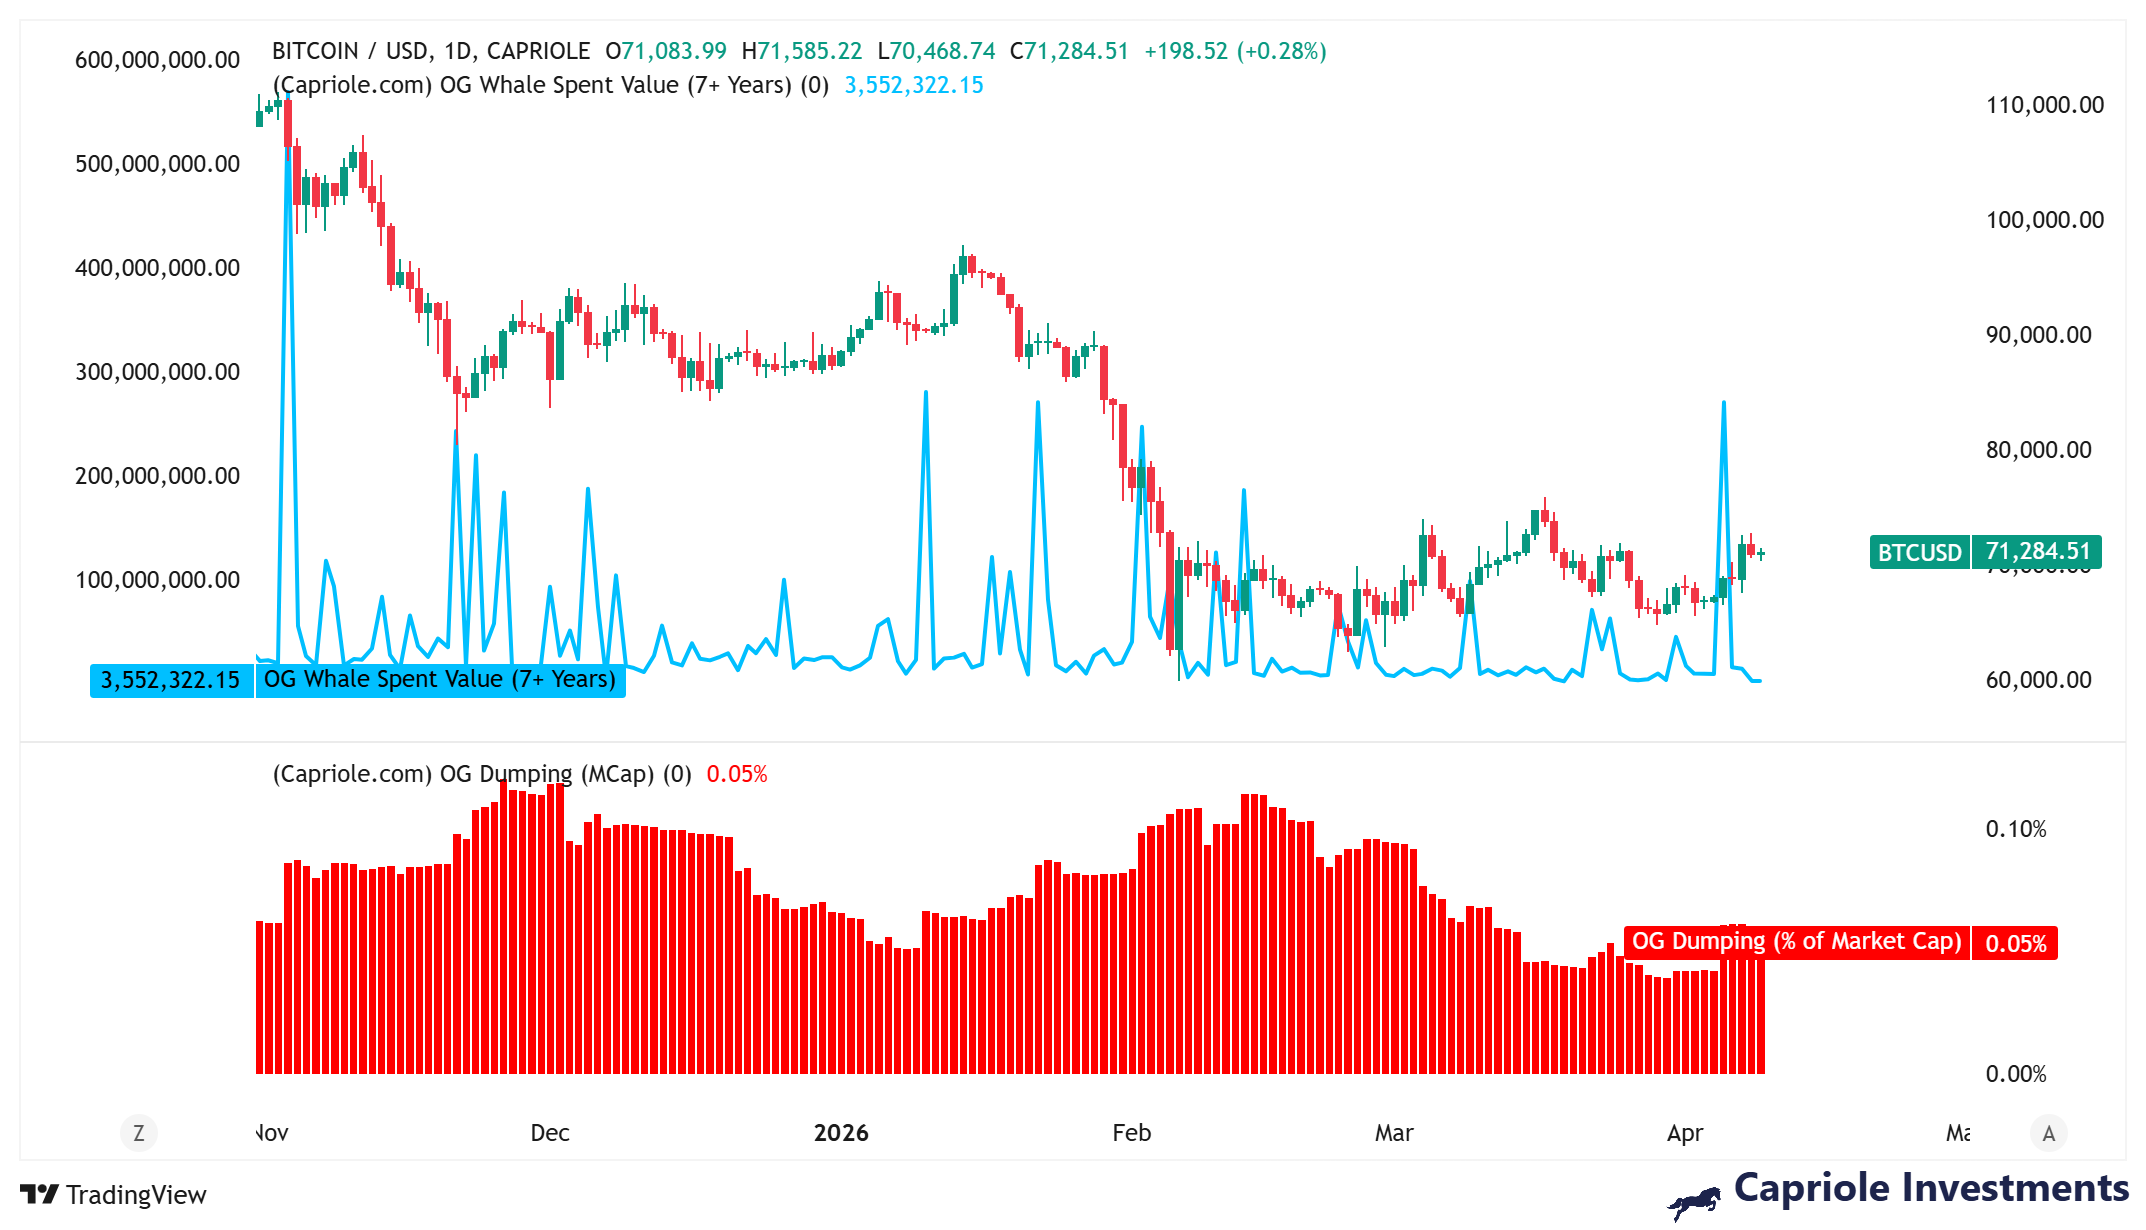 (Source: Capriole Investments)
According to data from Capriole Investments, this OG whale’s sell-off was concentrated on Sunday, totaling about $271 million, the highest daily spending activity for this group since January 10, 2026. Looking at the historical backdrop, the market conditions for the two sell-offs were completely different:
This time vs. the January sell-off: Key comparisons
January event: $280 million in capital outflows; within two weeks, Bitcoin fell from $90,000 to $78,700, a drop of about 13%. At the time, market demand was weak, and buyers couldn’t absorb the sell-off pressure.
This time: Glassnode data shows that as of April 9, the 30-day net position change for long-term holders turned positive, reaching +88,000 BTC; the large net outflow of -152,000 BTC that appeared in February has been fully reversed.
Positions keep increasing: As of Tuesday, this group’s total Bitcoin holdings have surpassed 4.3 million BTC, and by Thursday they climbed further to 4.5 million BTC.
Why this market is more resilient
Analysts generally believe that this OG whale sell-off aligns more with a “controlled profit-taking” model rather than the chaotic sell-off seen in January. The core difference lies in the demand side: on-chain data now indicates that Bitcoin is continuing to move toward more stable investors holding positions. The Bitcoin leaving old wallets is being absorbed more quickly, effectively easing overall supply pressure.
The current market structure is also different from January—back then, the market was fragile and buyer demand was insufficient; now, long-term holders’ accumulation actions are clearly visible, and after combining the two, overall buy-through capacity has improved markedly.
Technical indicators: Accumulation signals are starting to appear
CryptoQuant analyst MorenoDV pointed out two key technical indicators that further support the view that the market is nearing a bottom:
Short-term Sharpe Ratio: It has fallen to -40. Historically, this level corresponds to the major accumulation phases of 2015, 2019, 2020, and 2023, indicating that risk-adjusted returns are at an all-time historical low—often an early signal for putting capital to work on dips.
Delta (buy-sell pressure differential): It has moved from a strong sell-off zone below -0.05 into a neutral area, signaling that capitulation-style selling is nearing its end, liquidation pressure is easing, and demand is gradually recovering. The analyst noted: “For investors with a sense of cycles, the data shows we are closer to the start of opportunity than to the end.”
FAQ
Will the $271 million OG whale sell-off trigger a market breakdown?
Based on on-chain data, there is a fundamental difference between the sell-off backdrop this time and January—long-term holders’ net positions are positive (+88,000 BTC), Bitcoin’s total holdings have risen to 4.5 million BTC, and the market’s absorption capacity has significantly increased. Analysts therefore tend to view this activity as orderly profit-taking rather than a chaotic sell-off.
What trend is currently shown in long-term holders’ net position data?
Glassnode data shows that as of April 9, the 30-day net position change for long-term holders turned positive to +88,000 BTC, reversing the large -152,000 BTC net outflow seen in February. This reflects that institutions and long-term capital are actively absorbing the market’s sell-off.
What signals do Bitcoin’s current technical indicators convey?
The short-term Sharpe Ratio has fallen to -40, corresponding to the historical accumulation windows of 2015, 2019, 2020, and 2023. The buy-sell pressure differential is rebounding into the neutral area, indicating that forced sell pressure has eased. Analysts believe the current readings are between “demand has been exhausted” and “a confirmed recovery.”
Disclaimer: The information on this page may come from third parties and does not represent the views or opinions of Gate. The content displayed on this page is for reference only and does not constitute any financial, investment, or legal advice. Gate does not guarantee the accuracy or completeness of the information and shall not be liable for any losses arising from the use of this information. Virtual asset investments carry high risks and are subject to significant price volatility. You may lose all of your invested principal. Please fully understand the relevant risks and make prudent decisions based on your own financial situation and risk tolerance. For details, please refer to
Disclaimer.
Related Articles
Gate Daily Report (April 24): US Treasury sanctions Cambodian crypto “pig butchering” scams; Tether mints an additional 1 billion USDT
Bitcoin (BTC) rebound momentum is weakening, with a temporary quote around $78,030 as of April 24. The U.S. Treasury Department’s Office of Foreign Assets Control (OFAC) sanctioned a Cambodian politician linked to a crypto “pig butchering” scam center. Tether issued another 1 billion USDT on the Ethereum network; over the past 5 days, it has issued a total of 3 billion USDT on the Ethereum network.
MarketWhisper48m ago
Trump ordered the sinking of ships in the Strait of Hormuz, and Bitcoin’s rebound momentum weakened to 78k
U.S. President Donald Trump posted on Truth Social on April 24, announcing that the ceasefire agreement between Israel and Lebanon will be extended by three weeks. On the same day, he also ordered the U.S. Navy to “sink any vessel currently laying mines in the Strait of Hormuz,” and instructed the military to carry out mine-clearing operations with “three times the force.” Brent crude spot prices have returned above $100, and Bitcoin is trading near $78,000 under pressure and consolidating.
MarketWhisper1h ago
Crypto Fear and Greed Index Drops to 39, Market in Panic State
Gate News message, April 24 — The Crypto Fear and Greed Index dropped to 39 today, down from 46 yesterday, according to data from Alternative.me. The index indicates the market remains in a panic state.
GateNews2h ago
U.S.-Iran talks hit a deadlock, oil prices rise, and Bitcoin holds steady at 78K
U.S.-Iran talks have again fallen into a stalemate, and geopolitical tensions have pushed up oil prices; Brent is over $105 and WTI is near $97. The U.S. says it will open fire if the Strait of Hormuz is hit by a “Bure” missile. Iran’s parliamentary speaker withdraws from the negotiating team, and the Islamic Revolutionary Guard Corps tightens its control, which has raised concerns from outside observers. Bitcoin is trading steadily and has stabilized above 78K; spot Bitcoin ETFs have recorded net inflows for six consecutive days, and spot Ethereum ETFs have recorded net inflows for nine consecutive days. The Fear & Greed Index has declined, but it still leans optimistic; financing rates have turned slightly negative, and leverage has not grown significantly.
ChainNewsAbmedia2h ago
Bloomberg Analyst Mike McGlone Flags $75,000 as Critical Bitcoin Level for 2026
Gate News message, April 23 — Bloomberg analyst Mike McGlone has released an assessment of Bitcoin's performance relative to traditional markets, highlighting $75,000 as a critical threshold for BTC in 2026.
According to McGlone's analysis, Bitcoin and the S&P 500 have shown similar performance
GateNews6h ago
Dogecoin Holds $0.1018 as Whales Accumulate $330M
Dogecoin continues to trade below the critical $0.1018 resistance level after multiple failed breakout attempts, with the asset trading at $0.09625 at the time of writing amid ongoing downtrend momentum and active selling pressure.
Resistance Limits Upside Momentum
The $0.1018 level has
CryptoFrontier6h ago