
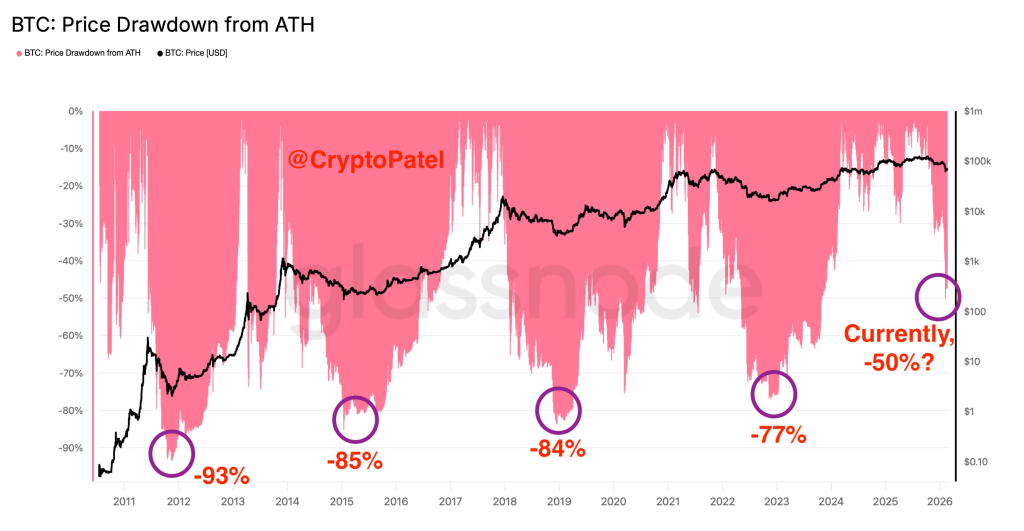
The chart shared by Crypto Patel puts Bitcoin’s current drawdown into long-term perspective by mapping every major peak-to-trough decline since 2011. What immediately stands out is not just how brutal past bear markets were, but how consistently Bitcoin has tested investor conviction before resetting for the next cycle. Compared to earlier crashes, today’s pullback still sits on the shallow end of Bitcoin’s historical spectrum.
The pink area on the chart tracks Bitcoin’s percentage drawdown from its all-time high, overlaid with the BTC price itself. Previous cycle lows were extreme: roughly -93% in 2011, -85% in 2015, -84% in 2018, and -77% in 2022. In contrast, the current cycle is hovering near a -50% drawdown, which is materially less severe than any prior major bottom. From a purely historical standpoint, that suggests Bitcoin has not yet experienced the type of capitulation that has defined past cycle lows.
Crypto Patel’s key observation is valid: each cycle’s maximum drawdown has become less aggressive over time. That trend aligns with Bitcoin’s maturation, deeper liquidity, broader ownership, and increasing institutional participation. However, the chart also delivers an uncomfortable reality check. Even if this cycle continues the pattern of “shallower” losses, a move toward a -70% drawdown would still be well within historical norms, and that would place Bitcoin near the $30,000 zone from current levels.
Source: X/@CryptoPatel
The most important takeaway is not a price prediction, but a framework. Bitcoin does not bottom quietly. Every prior cycle required prolonged pain, time, and psychological exhaustion before a durable low formed. The absence of a deep drawdown does not invalidate the bull thesis long-term, but it does indicate that downside scenarios remain very much alive. Markets rarely reward complacency, especially during transitions between expansion and contraction phases.
Crypto Patel’s conclusion is less about fear and more about preparation. History shows that Bitcoin survives every storm, but not everyone holding it does. Planning for multiple outcomes, including deeper volatility, has historically been the difference between forced exits and long-term survival. If this cycle ultimately bottoms at a higher level than the past, that will be constructive. Until proven otherwise, though, the chart argues for respect (not confidence) in what Bitcoin is still capable of doing on the downside.
Read also: Robert Kiyosaki Buys Another Bitcoin at $67,000 as BTC Price Shows Recovery Signs
Disclaimer: The information on this page may come from third parties and does not represent the views or opinions of Gate. The content displayed on this page is for reference only and does not constitute any financial, investment, or legal advice. Gate does not guarantee the accuracy or completeness of the information and shall not be liable for any losses arising from the use of this information. Virtual asset investments carry high risks and are subject to significant price volatility. You may lose all of your invested principal. Please fully understand the relevant risks and make prudent decisions based on your own financial situation and risk tolerance. For details, please refer to
Disclaimer.
Related Articles
North Carolina proposes bill to establish state Bitcoin reserve
North Carolina has proposed legislation to create a strategic Bitcoin reserve, allowing the state to invest in and manage Bitcoin. The initiative aims to enhance cryptocurrency adoption and could inspire other states to follow suit, diversifying state assets.
GateNews4m ago
BTC rises 0.77% in 15 minutes: rebound driven by active buyers overlapping with safe-haven fund resonance
From 2026-03-19 19:00 to 19:15 (UTC), BTC price fluctuated within the range of 69802.0 to 70547.9 USDT, with volatility reaching 1.07%, recording a return rate of +0.77%. Short-term trading activity drove increased market attention, with volatility strength exceeding the daily average, attracting rapid capital participation.
The main driver of this price movement was concentrated active buy orders in the spot market, pushing BTC price up sharply in the short term. On-chain data shows that transfer volume during the 19:00-19:15 interval exhibited no extreme changes, and there were no large whale transfers. Weighing spot market and
GateNews1h ago
BTC Breaks Through 70,000 USDT
Gate News bot message, Gate market data shows BTC has broken through 70000 USDT, current price 70010.6 USDT.
CryptoRadar1h ago
BTC Falls Below $69K Amid Iranian and Qatari Gas Field Strikes
Bitcoin dropped below $69,000 amid a global sell-off fueled by rising Middle East tensions and soaring energy prices. This led to significant liquidations in leveraged positions and a decline in the overall crypto market.
Coinpedia1h ago
2013 Dormant Whale Offloads 3,500 BTC Worth $442 Million, BTC Price Under Pressure
On March 19, a Bitcoin whale sold 3,500 BTC, triggering bearish market sentiment. A total of 44,459 BTC flowed into exchanges that day. Bitcoin's price was around $69,500, with analysts predicting a potential test of the $64,000 support level. Capital is also shifting toward new infrastructure projects.
GateNews1h ago
