
Humanity Protocol is having a really strong day. The H price is up about 13.6% in the last 24 hours, trading near $0.229 and clearly outperforming Bitcoin, which is slightly in the red.
When you see something like this, it usually comes down to one simple theme: traders are rotating out of large caps and into smaller altcoins that can move much faster when sentiment improves. And right now, Humanity Protocol is one of the projects catching that wave.
- What’s Actually Pushing the H Price Higher
- What the H Chart Looks Like Right Now
- Where the H Price Could Go Next
What’s Actually Pushing the H Price Higher
The biggest driver behind today’s pump is the broader shift into altcoins. The CMC Altcoin Season Index has jumped more than 54% this week, which is basically the market flashing a sign that risk appetite is coming back.
Interestingly, there isn’t one major headline or announcement behind Humanity Protocol’s move today. This looks more like a momentum breakout tied to the market environment, not a news spike. Trading activity has also picked up, which helps confirm that this isn’t just a random candle. Buyers are showing up.
Here’s Where Hedera (HBAR) Price Could Go This Week_**
What the H Chart Looks Like Right Now
On the 4-hour chart, the H price has been climbing steadily since the early February low near $0.10. It’s been a clean recovery with higher highs and higher lows, which is exactly what you want to see in a strong uptrend.
The latest push has brought H into the $0.23–$0.24 zone, which is now the big resistance area. Price has already tested it once and is hovering just under it again. Support is also pretty clear around $0.20. That level has become the breakout base, and it’s the zone buyers really need to hold if this move is going to stay alive.
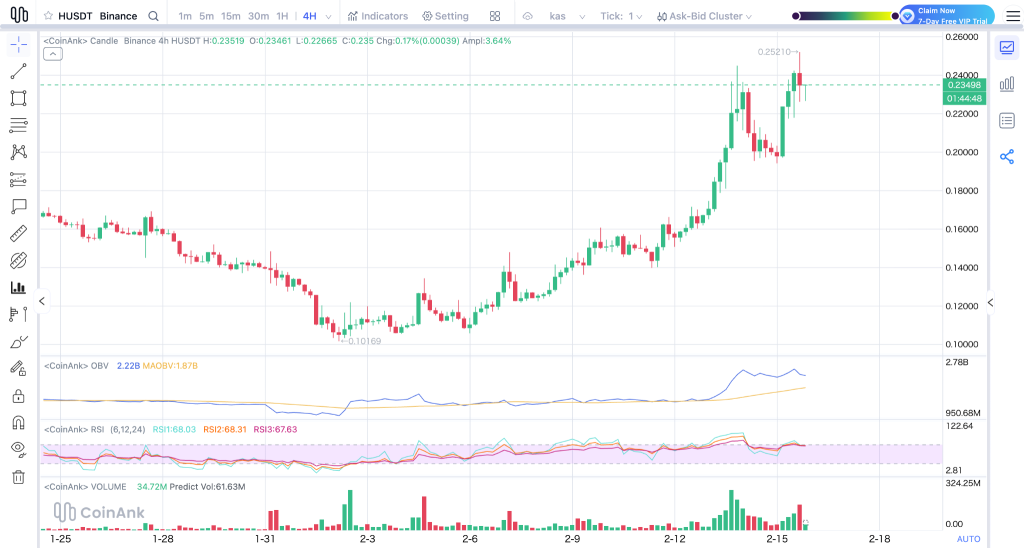
Source: CoinAnk
If the H price stays above $0.20, the trend still looks healthy. If it breaks below, a pullback toward $0.18 becomes more likely.
RSI is sitting in the high 60s, which shows strong momentum, but it also tells us the H price is starting to get a bit stretched in the short term. It’s not fully overbought yet, but it’s getting close to the area where cooling off often happens. MACD is still bullish and trending upward, which confirms that buyers remain in control for now.
As for net shorts vs net longs, resistance near $0.24 is usually where shorts start to step in, betting on a rejection. But the fact that price is holding up suggests longs are still pressing forward.
Jupiter Is Printing Revenue – So Why Is JUP Facing a Token Shock?_**
Where the H Price Could Go Next
If the altcoin rotation continues and the H price can break cleanly above $0.24, the next move could push toward $0.26 fairly quickly. On the flip side, if momentum fades, $0.20 is the key level to watch. Losing that support could send H back down toward $0.18 before buyers try again.
For now, Humanity Protocol is riding the altcoin wave strongly, and as long as traders stay in risk-on mode, the H price remains one of the more active charts today.
Disclaimer: The information on this page may come from third parties and does not represent the views or opinions of Gate. The content displayed on this page is for reference only and does not constitute any financial, investment, or legal advice. Gate does not guarantee the accuracy or completeness of the information and shall not be liable for any losses arising from the use of this information. Virtual asset investments carry high risks and are subject to significant price volatility. You may lose all of your invested principal. Please fully understand the relevant risks and make prudent decisions based on your own financial situation and risk tolerance. For details, please refer to
Disclaimer.
Related Articles
Crypto Fear & Greed Index drops to 10, market "fear" sentiment rises
BlockBeats News, March 26 — According to Alternative data, today’s cryptocurrency Fear and Greed Index is 10 (yesterday was 14), indicating increased market "fear" sentiment.
Note: The Fear and Greed Index threshold is 0-100, composed of indicators: volatility (25%), market trading volume (25%), social media activity (15%), market surveys (15%), Bitcoin’s proportion in the overall market (10%), and Google trending searches analysis (10%).
BlockBeatNews2m ago
Pi coin's 7-month low-volatility period has ended; an 108% rebound in volatility signals a major market move.
Pi Network (PI) is currently trading at approximately $0.1883, facing increased volatility and a decreasing correlation with Bitcoin. Recently, volatility has risen from 52% to 108%, indicating the end of the past seven months of compression and the potential for a significant move. However, the correlation coefficient between PI and Bitcoin has dropped to -0.30, suggesting that PI has not benefited from Bitcoin's upward trend. Technical analysis shows that if the price falls below $0.1894, it could drop to $0.1300, while holding above $0.2103 may lead to a rebound toward $0.2442.
MarketWhisper24m ago
The Futarchy of Privacy: Umbra's Fit in a Private Crypto World
The essay discusses the need for "Verifiable Privacy" in professional trading, highlighting Umbra's unique technical approach and performance-based tokenomics. It notes the privacy sector’s strong growth and upcoming catalysts for Umbra’s expansion.
CoinDesk31m ago
Bitcoin Consolidating, Is It Time to Enter? K33: Selling Pressure Easing, Bottom Signals Emerging
Bitcoin is oscillating between $60,000 and $75,000, with research firm K33 noting that selling pressure is subsiding and may signal a bottom formation. Long-term holders are maintaining their positions, and coupled with recent ETF fund inflows, the market may gradually improve. Despite economic uncertainty affecting short-term performance, the overall pattern is trending toward stabilization, and long-term investors can anticipate attractive entry opportunities.
区块客38m ago
Bitcoin ETF Ends Seven-Day Rally, Bitcoin Price Pressure Resurfaces
US Bitcoin spot ETFs have shifted to outflows after a period of continuous inflows, causing Bitcoin's price to decline and briefly break below the $70,000 mark. Although there were modest net inflows earlier this week, market sentiment has turned conservative due to macroeconomic uncertainties, indicating reduced institutional risk appetite. The $70,000 level has become a near-term battleground between bulls and bears, reflecting insufficient market confidence.
区块客42m ago
XRP volatility hits cycle lows as $1.40 support comes into focus
XRP is currently trading in a narrow range just above $1.40, with low volatility suggesting an imminent breakout. Recent price movements show resistance at $1.43 and support around $1.40, keeping traders attentive to upcoming shifts.
CoinDesk50m ago
