
Bitcoin (BTC) retraced some of its weekend gains on April 7, trading near $68,800 in the short term. This decline was driven by two forces at the same time: an explosion in the Jubail Industrial Area in Saudi Arabia sharply raised geopolitical risk in the Middle East, and a statement from U.S. President Trump applying “maximum pressure” on Iran further intensified global risk-hedging sentiment; at the same time, on the daily technical side, the stochastic indicator (STOCH) shows overbought conditions, and with the release of profit-taking pressure concentrated under the backdrop of external shocks.
Geopolitical shock: Middle East situation sparked off in a concentrated way on April 7
In the early hours of April 7, Iran cited unnamed sources, saying that Saudi Arabia’s northeastern Jubail Industrial Area was hit broadly and an explosion occurred. Jubail is a major global petrochemical production hub, with annual output of about 60 million tons of petrochemical products, accounting for 6% to 8% of the global total. The area includes Saudi basic industrial companies, the U.S. Dow Chemical Sadaara project, and joint investment projects between Saudi Aramco and TotalEnergies.
On the same day, Trump issued a final warning to Iran at a press conference at the White House, claiming that U.S. troops could destroy all bridges and power plants within Iran in 4 hours, and saying, “The entire country can be wiped out in a single night.” Trump also refused to accept Tehran’s ceasefire counterproposal, saying the deadline “will not be changed again,” and proposed charging tolls on ships in the Strait of Hormuz by the U.S. side.
Three pathways for geopolitical risk to transmit into the crypto market
Energy supply shock: The Jubail explosion threatens the global petrochemical supply chain, lifts expectations for energy inflation, and steers hedging capital toward traditional assets
War escalation repricing: Trump’s “wiped out in a single night” remarks trigger the market’s panic expectations for a full-scale Middle East conflict, pressuring Bitcoin in the short term
Strait of Hormuz risk: About 20% of global oil transit passes through here, and tolling or a blockade plan directly impacts global energy cost expectation
Technical picture: Overbought signals provide built-in momentum for the decline
From the perspective of technical indicators, today’s Bitcoin drop has a self-driven correction logic. The daily RSI is 53, MACD (12,26) is 499.5, and ADX (14) is 37.847; overall momentum still leans bullish. However, the STOCH indicator has entered the overbought range, and against the backdrop of geopolitical shock-driven risk sentiment shifting, short-term profit-taking pressure has been released in a concentrated way.
This week, a TradingView analyst pointed out that, “The bearish trend has not yet been confirmed,” and that the current decline is more like a healthy correction rather than a trend reversal.
Key support: Three lines of defense determine the market outlook
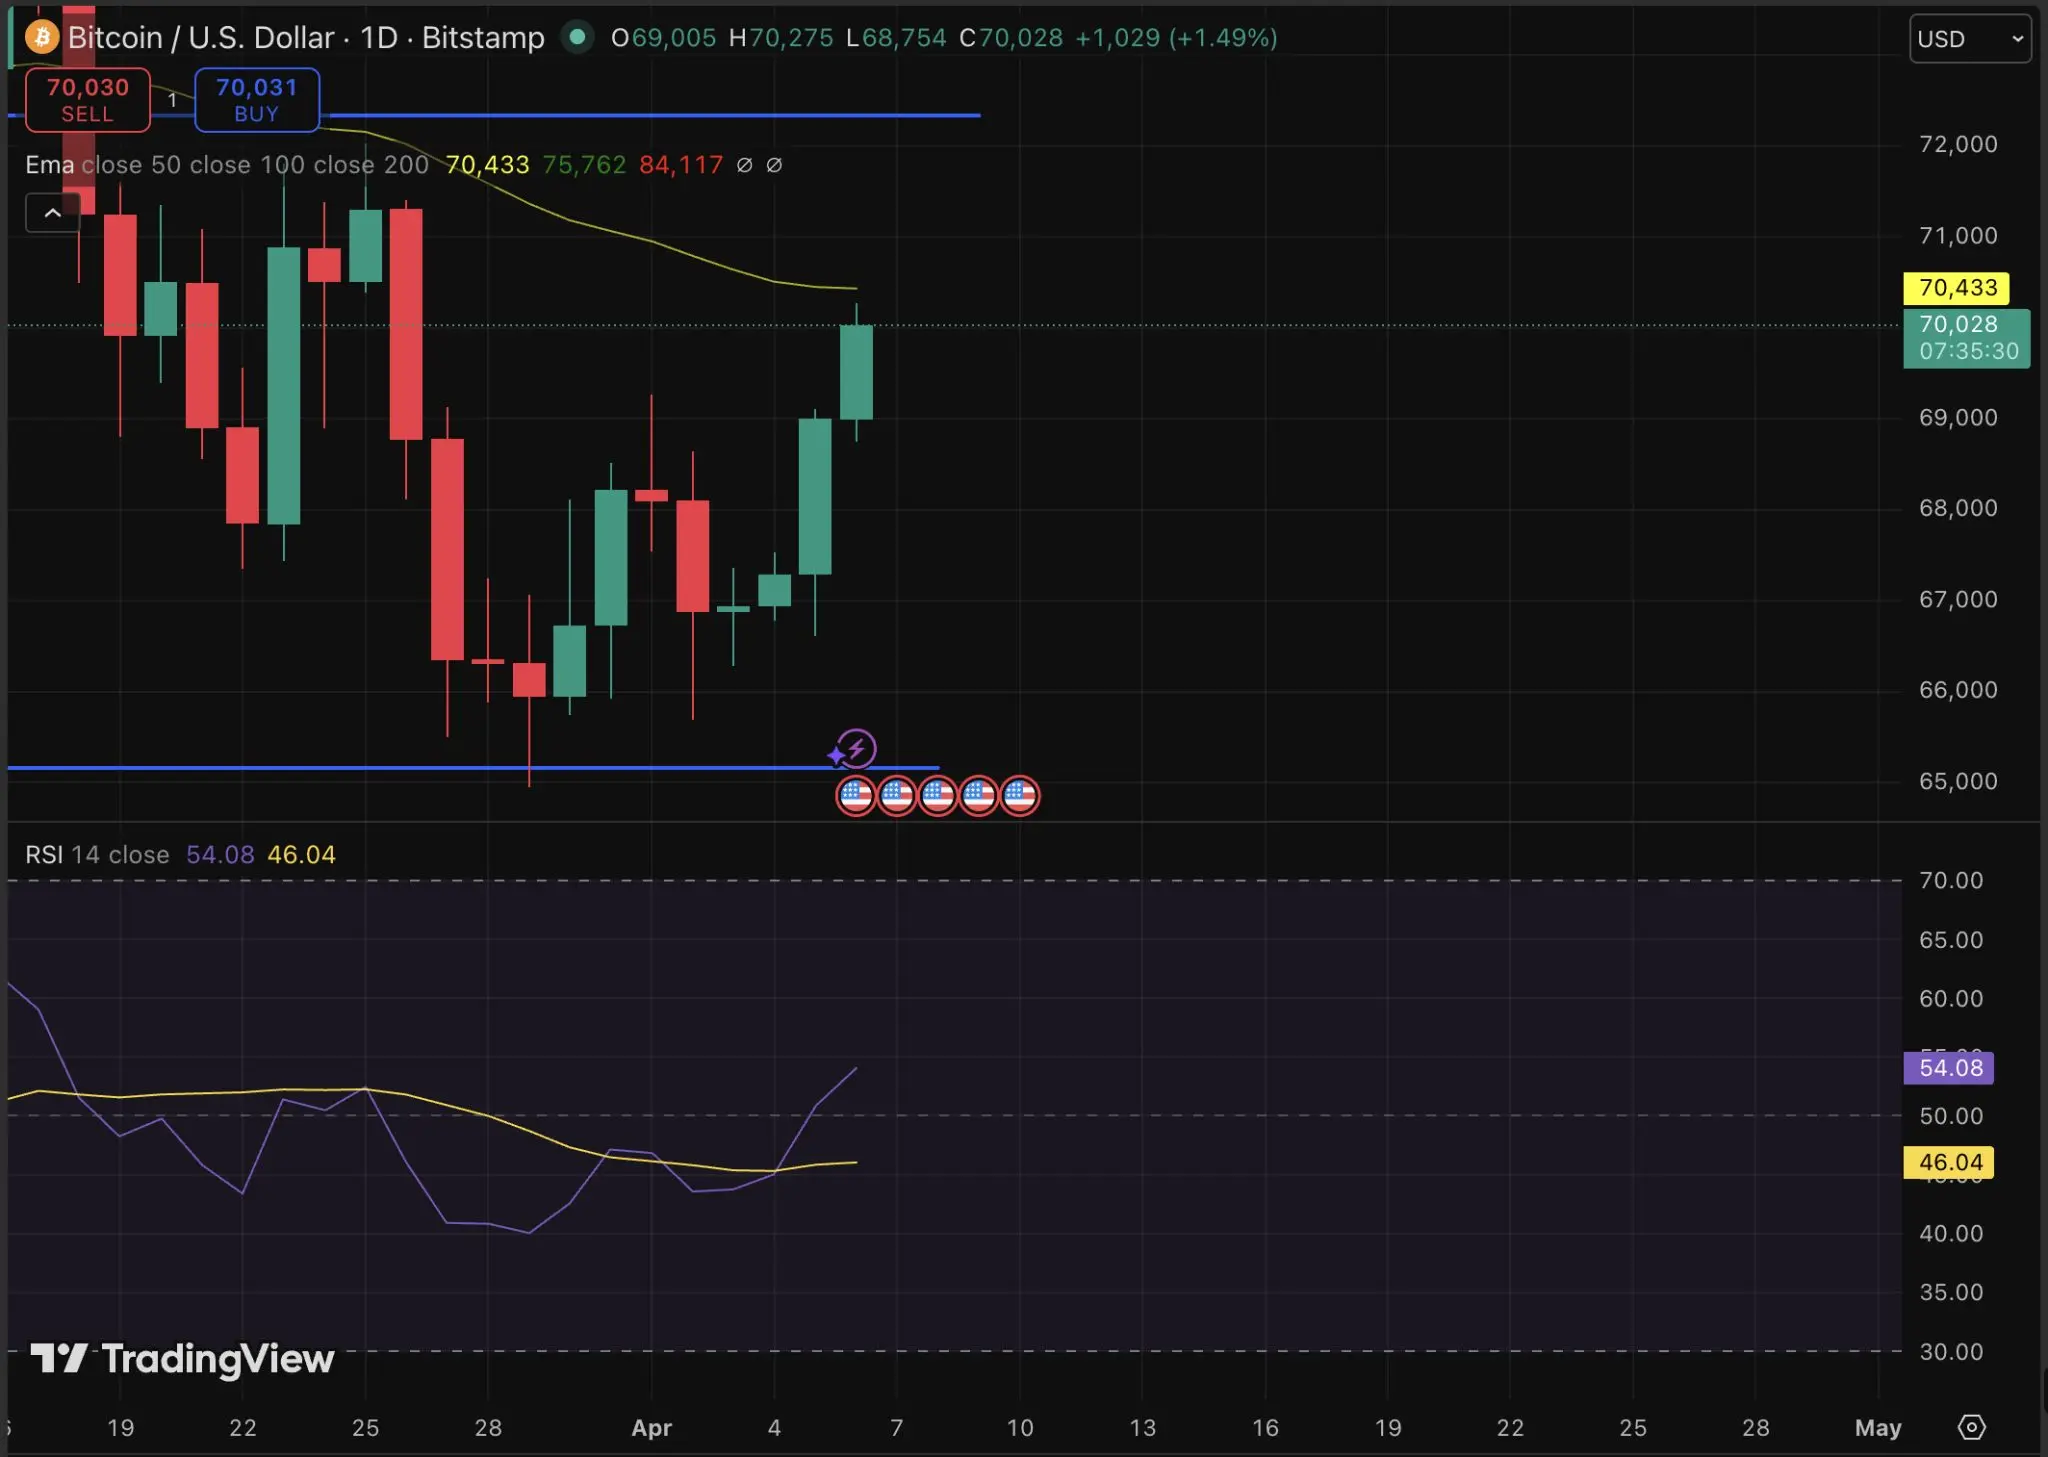 (Source: Trading View)
Bitcoin is currently under pressure near $69,500, and the following key reference zones exist for the outlook:
Short-term consolidation zone: $67,500 to $69,500, expected to stay in range-bound trading for several days
Long-term trend line: $66,000; a break below would confirm a bearish structure
Extreme downside level: $64,000, the main risk zone after the trend line breaks down
If Bitcoin can hold above $69,500 and effectively close, then the upside technical targets will point in sequence to $72,000 and $74,000. The main variables to watch going forward are U.S. employment and inflation data; if the data are weaker than expected, it will reinforce expectations for Federal Reserve rate cuts and provide momentum for BTC. The persistence of net inflows into Bitcoin ETFs is also an important indicator.
Frequently Asked Questions
Why is Bitcoin down today?
Bitcoin’s decline on April 7 was driven by two factors: the explosion in the Jubail Industrial Area triggered a sharp rise in Middle East geopolitical risk, and Trump’s maximum-pressure statement on Iran intensified the market’s hedging sentiment; the STOCH overbought signal in the technicals also provides built-in momentum for a short-term pullback.
Where is Bitcoin’s key support?
Bitcoin’s key short-term support lies in the $67,500 to $69,500 consolidation range. If it breaks below $66,000, the long-term trend line, the downside risk zone extends to $64,000. Multiple technical analysts have noted that the current bearish trend has not yet been confirmed.
Does this decline mean a trend reversal?
Currently, technical indicators have not shown a trend reversal. The daily RSI at 53 and the positive MACD suggest that medium-term momentum is still bullish. The current price action is more like a short-term correction, and the direction going forward depends on macro data and the dynamics of ETF inflows.
Disclaimer: The information on this page may come from third parties and does not represent the views or opinions of Gate. The content displayed on this page is for reference only and does not constitute any financial, investment, or legal advice. Gate does not guarantee the accuracy or completeness of the information and shall not be liable for any losses arising from the use of this information. Virtual asset investments carry high risks and are subject to significant price volatility. You may lose all of your invested principal. Please fully understand the relevant risks and make prudent decisions based on your own financial situation and risk tolerance. For details, please refer to
Disclaimer.
