As stats indicate, bulls now have gained control of markets. This is seen from the global market cap, which has jumped by 1.22% from its previous 24-hour mark, as the total cap stands at $1.66T as of press time. The fear and greed index is 68, as the greed sentiment fades
Bitcoin Price Analysis
Bitcoin (BTC) has managed to post minor gains as the Bitcoin price stood at $44K as of press time, representing a 0.71% increase in the last 24 hours as the weekly rise also stood at 3.2%. However, Bitcoin’s trading volume has dropped by 40% to $15.7B.
The future price trajectory for Bitcoin looks bullish as the Relative Strength Index indicator has maintained movement above 50 to show some bull pressure on BTC. The MACD indicator, on the other hand, is reverting towards the green zone, showing bullish prospects for the Bitcoin price as well.
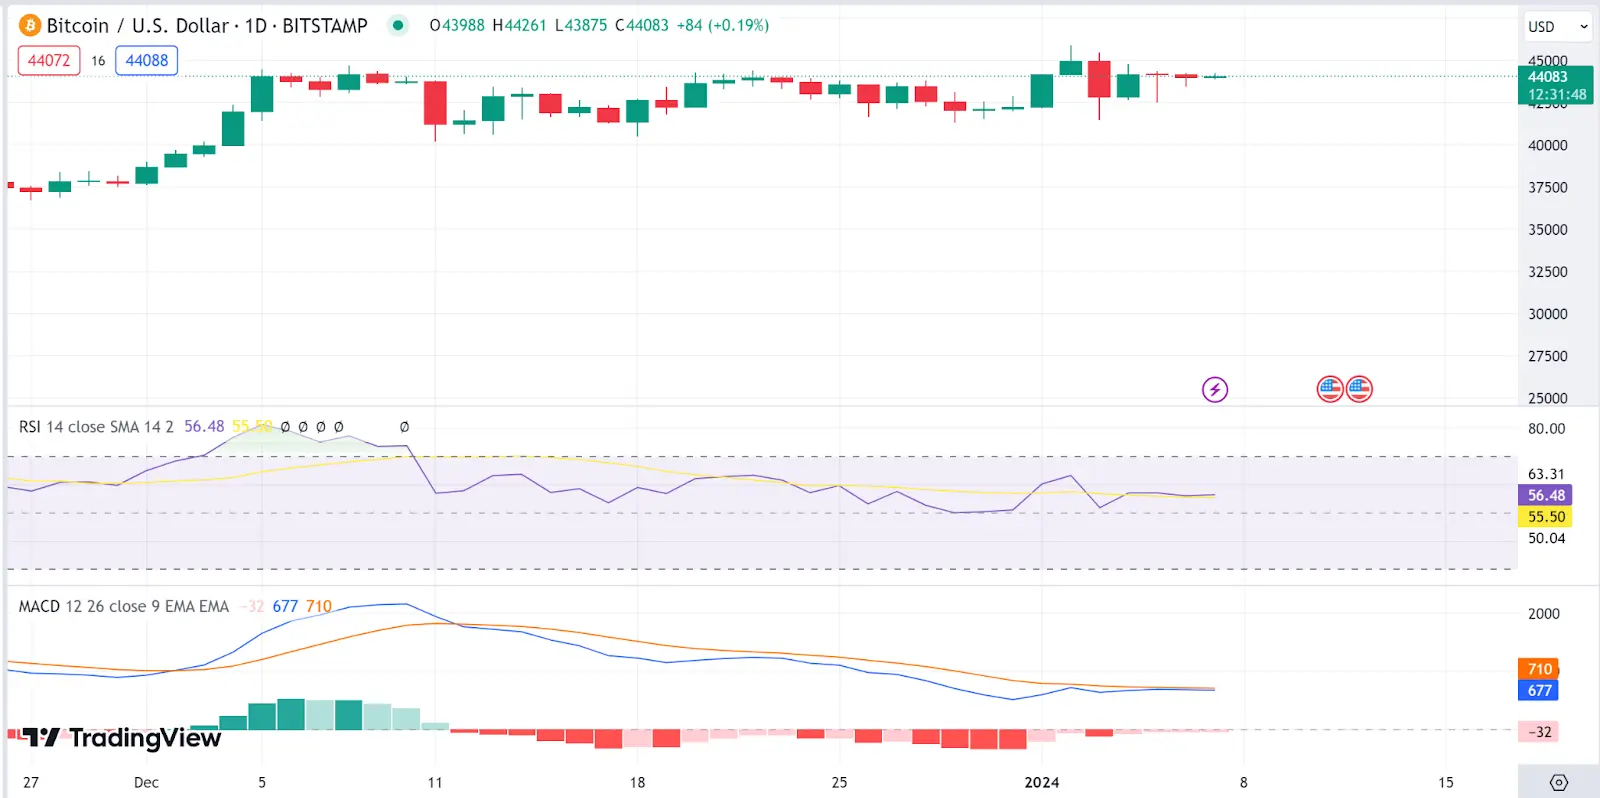 BTC 1-day chart | Source: TradingView## Ethereum Price Analysis
Ethereum (ETH) has started with some bull action today as the Ethereum price stood at $2241 as of press time, representing a 0.12% increase in the last 24 hours as the weekly drop stood at 3%. The trading volume has also dropped by 37% to $5.4B.
An in-depth analysis of the ETH/USD charts reveals uncertainty on ETH’s future trajectory, as shown by the Relative Strength Index indicator, which is currently on a northern trajectory after deviating from its downside movement, showing bull action. At the same time, the MACD moves in the red zone, showing bear action on the Ethereum price.
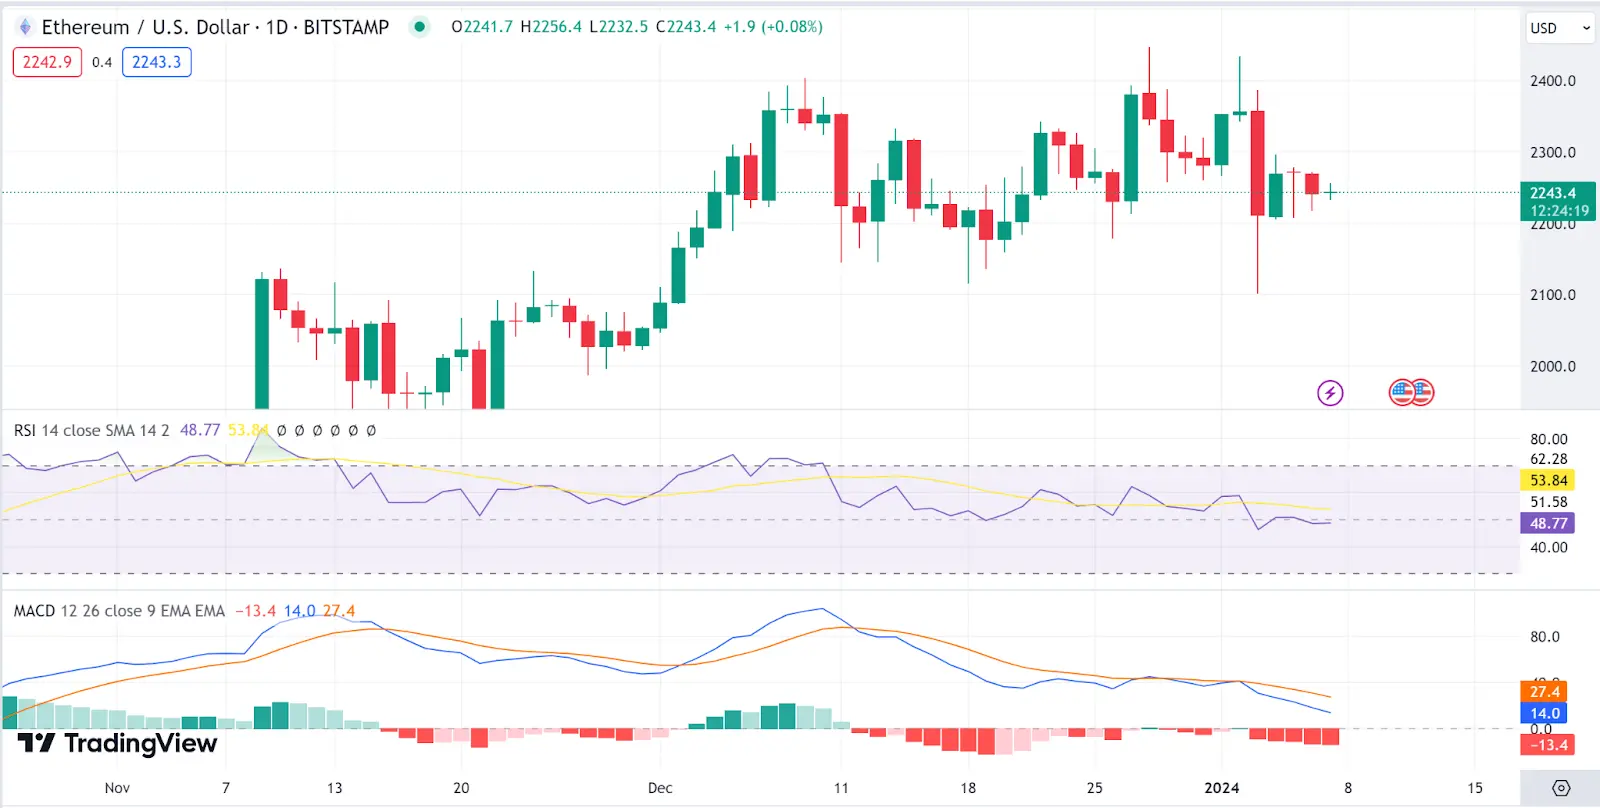 ETH 1-day chart | Source: TradingView## Toncoin Price Analysis
Toncoin (TON)) is another gainer today as the Toncoin price stood at $2.2 as of press time, representing a 3.8% increase in the last 24 hours as the weekly drop stood at 5.4%. The trading volume has also jumped by 15% to $562M.
An in-depth analysis of the TON/USD charts points towards a bullish short term, as shown by the Relative Strength Index indicator, which is currently on a northern trajectory, showing bull action. At the same time, the MACD is reverting towards the green zone, showing mounting bull dominance.
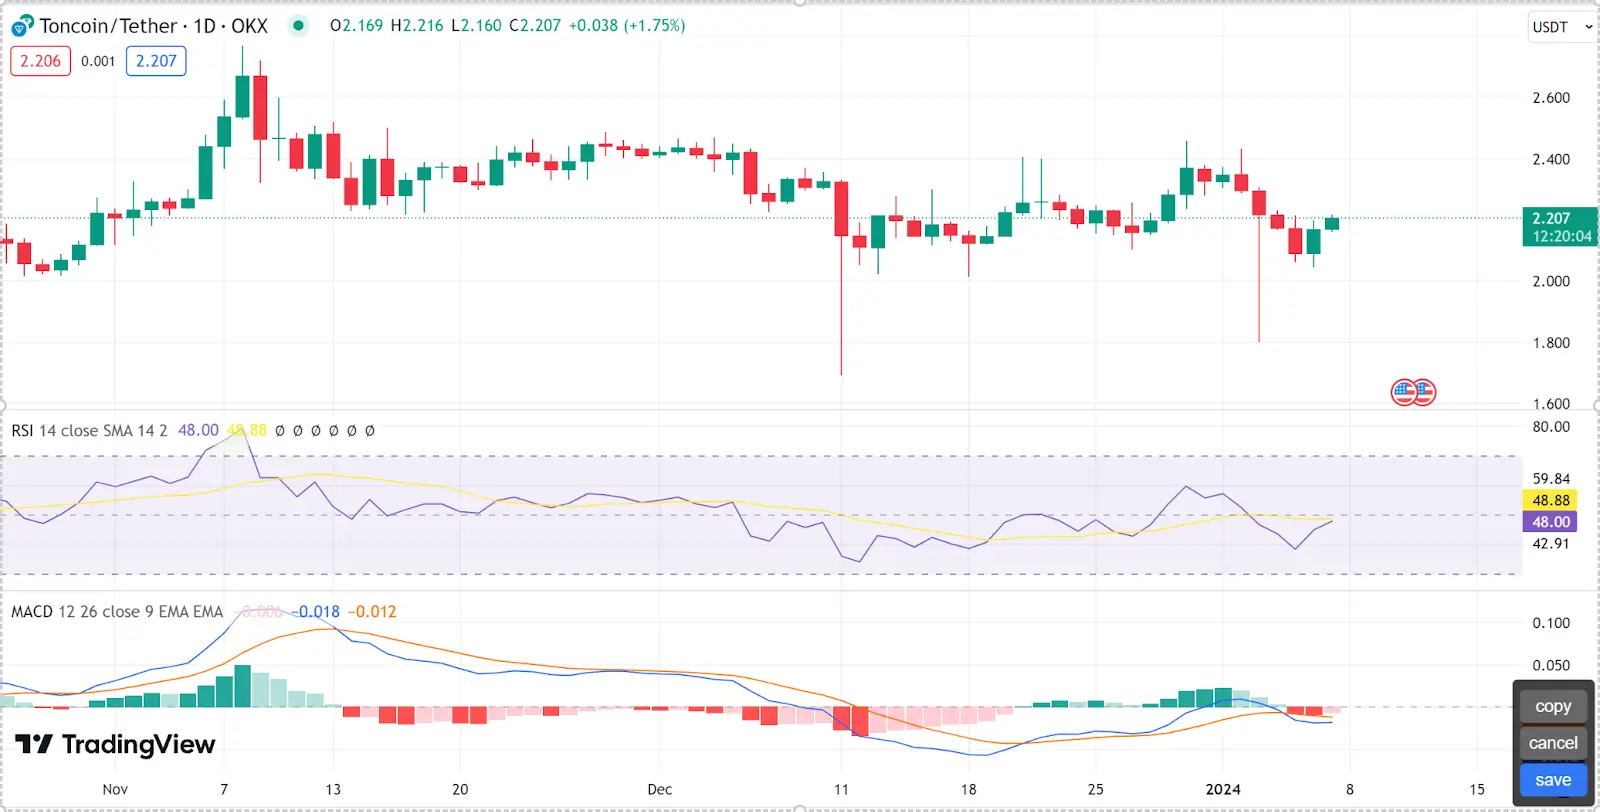 TON 1-day chart | Source: TradingView## Stacks Price Analysis
Stacks (STX) is another top gainer today as the Stacks price stood at $1.66 as of press time, representing a 12.1% increase in the last 24 hours as the weekly rise stood at 13.3%. The trading volume has also jumped by 0.34% to $180M.
Daily STX/USD charts point towards a bullish short term, as shown by the Relative Strength Index indicator, which is currently on a northern trajectory, showing bull action. At the same time, the MACD is reverting toward the green zone, showing mounting bull dominance.
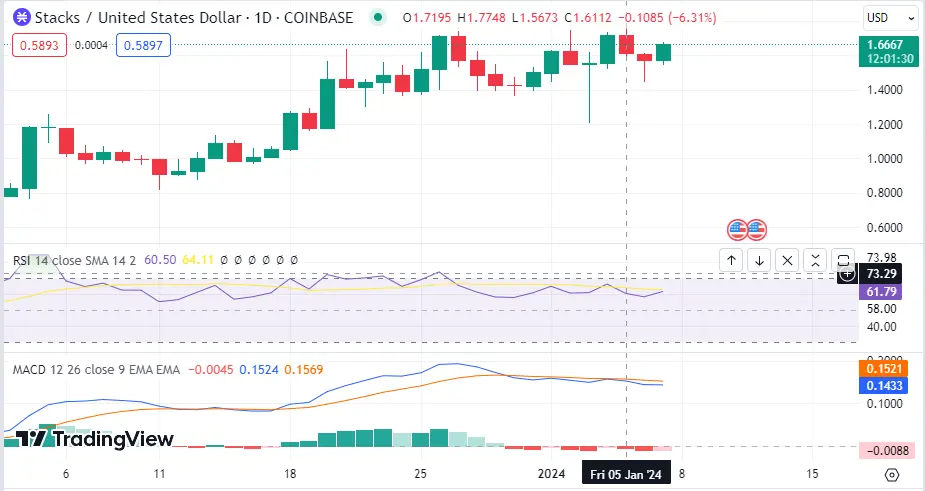 STX 1-day chart | Source: TradingView## Maker Price Analysis
Maker (MKR) is our last top gainer of the day as the Maker price stood at $1797 as of press time, representing a 4.4% increase in the last 24 hours as the weekly rise stood at 10%. The trading volume has also dropped by 20% to $63M.
The Maker price short-term trajectory is however uncertain as seen from its indicators. The Relative Strength Index indicator moves north as it approaches the overbought region while the MACD indicator reverts towards the red zone showing a struggle between bulls and bears.
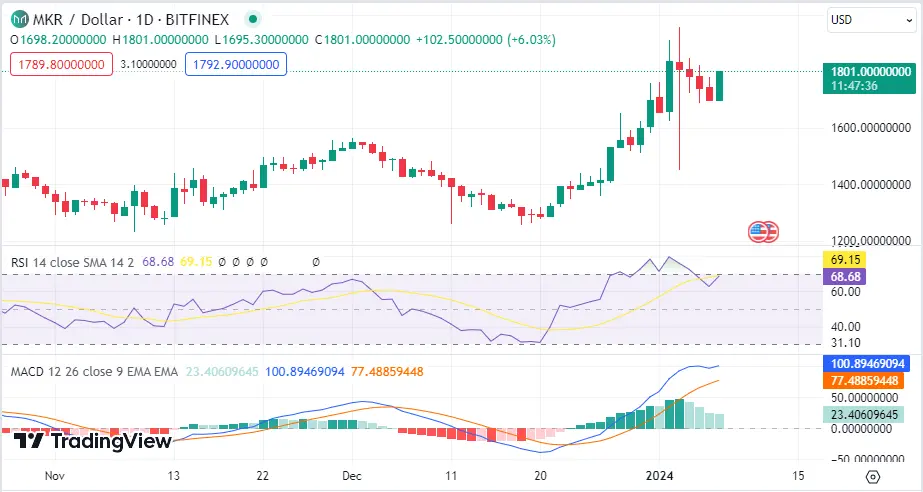 MKR 1-day chart | Source: TradingView
Disclaimer: The information on this page may come from third parties and does not represent the views or opinions of Gate. The content displayed on this page is for reference only and does not constitute any financial, investment, or legal advice. Gate does not guarantee the accuracy or completeness of the information and shall not be liable for any losses arising from the use of this information. Virtual asset investments carry high risks and are subject to significant price volatility. You may lose all of your invested principal. Please fully understand the relevant risks and make prudent decisions based on your own financial situation and risk tolerance. For details, please refer to
Disclaimer.
