Markets are on slight bull activity today, with the global market cap sitting 0.51% above its previous 24-hour mark, as the total cap stands at $1.58T as of press time. The fear and greed index is 74, as greed now fades. The global trading volume is 12% up in 24 hours, at $79.6B as of press time
Bitcoin Price Analysis
Bitcoin (BTC) is riding on bear activity, as the Bitcoin price stood at $41.2K as of press time after recording a daily decrease of 1.5% and a weekly drop of 5.9%. As a result of the Bitcoin price, the token’s trade volume dropped by 24% during the same period and is presently at $24.3B.
The Bollinger bands are far apart, showing high volatility levels on the Bitcoin price. The Relative Strength Index (RSI) is below the average line, showing bear dominance on the Bitcoin price today.
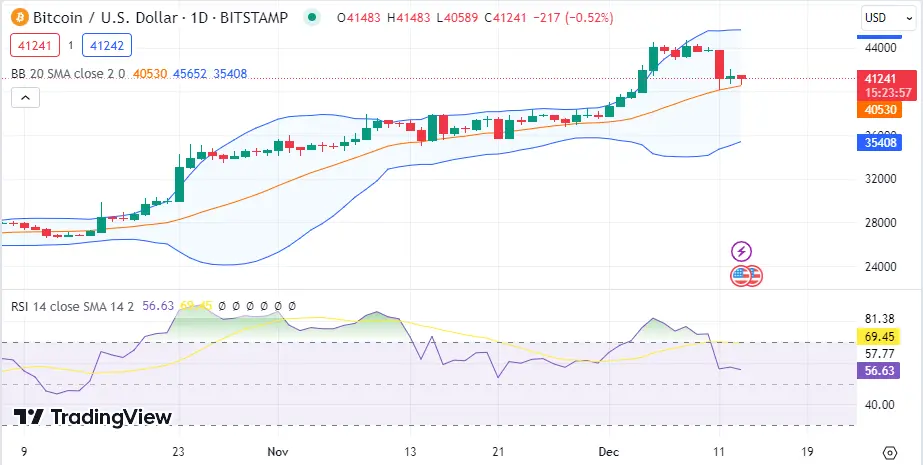 BTC 1-day chart | Source: TradingView## Ethereum Price Analysis
Ethereum (ETH) is also riding on slight bear activity, as the Ethereum price stood at $2,181 as of press time after recording a daily decrease of 2.1% and a weekly drop of 4%. As a result of the Ethereum price, the token’s trade volume dropped by 12% during the same period and is presently at $12.2B.
The Bollinger bands are far, showing high volatility levels on the Ethereum price. The Relative Strength Index (RSI) is below the average line, showing bear dominance on the Ethereum price.
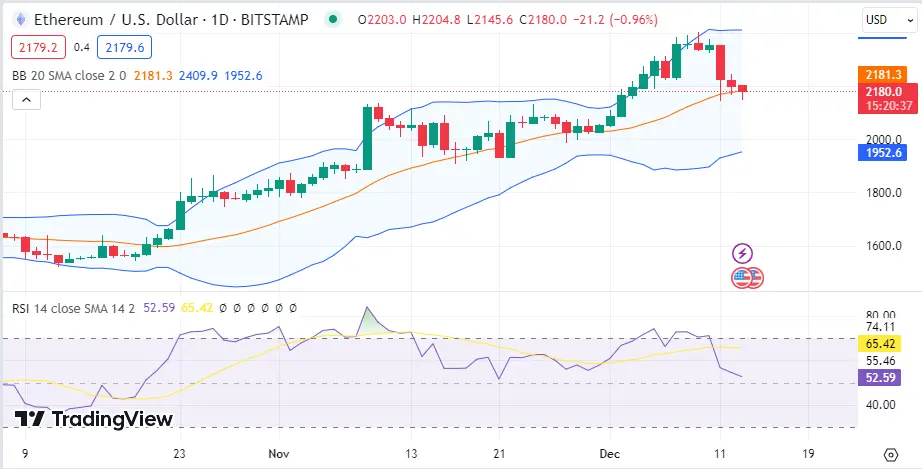 ETH 1-day chart | Source: TradingView## Cardano Price Analysis
Cardano (ADA) is riding on bull activity, as the Cardano price stood at $0.5872 as of press time after recording a daily increase of 5.5% and a weekly rise of 46%. As a result of the Cardano price, the token’s trade volume dropped by 2.7% during the same period and is presently at $1.1B.
The Bollinger bands are far, showing high volatility levels on the Cardano price. The Relative Strength Index (RSI) is above the average line in the overbought region, showing bull dominance on the Cardano price.
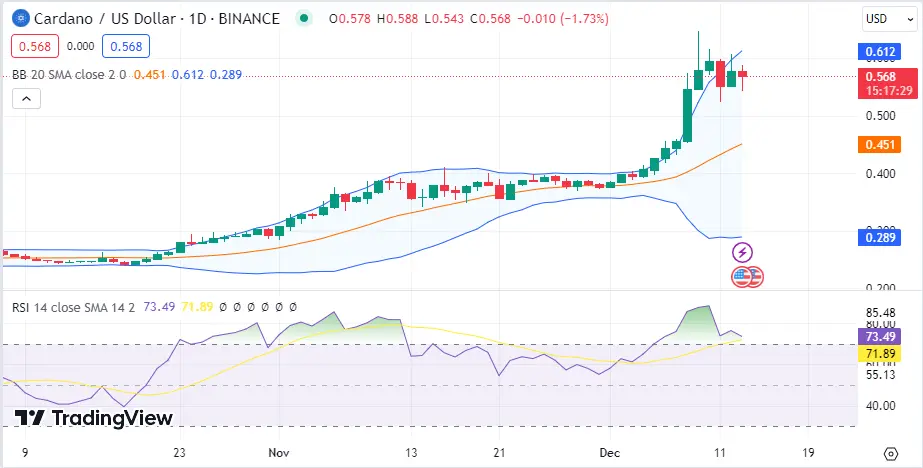 ADA 1-day chart | Source: TradingView## BNB Price Analysis
BNB (BNB) is riding on slight bull activity, as the BNB price stood at $249.4 as of press time after recording a daily increase of 0.1% and a weekly rise of 7%. As a result of the BNB price, the token’s trade volume dropped by 10% during the same period and is presently at $1.3B.
The Bollinger bands are far, showing high volatility levels on the BNB price. The Relative Strength Index (RSI) is above the average line, showing bull dominance on the BNB price.
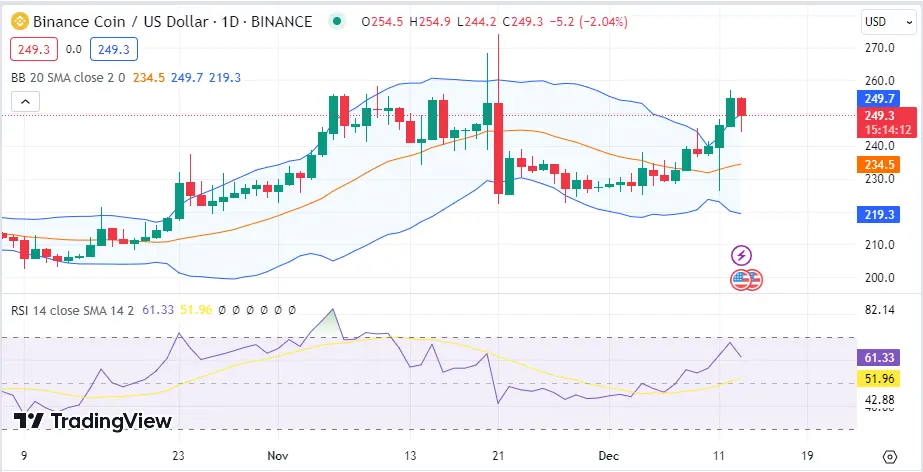 BNB 1-day chart | Source: TradingView## Avalanche Price Analysis
However, Avalanche (AVAX) is riding on bear activity, as the Avalanche price stood at $35.97 as of press time after recording a daily decrease of 12.6 as it faces corrections after its recent pump saw it rise 37% in the last seven days. As a result of the Avalanche price, the token’s trade volume dropped by 34% during the same period and is presently at $2B.
The Bollinger bands are far, showing high volatility levels on the Avalanche price. The Relative Strength Index (RSI) is above the average line in the overbought region, showing bull activity on the Avalanche price despite today’s drop.
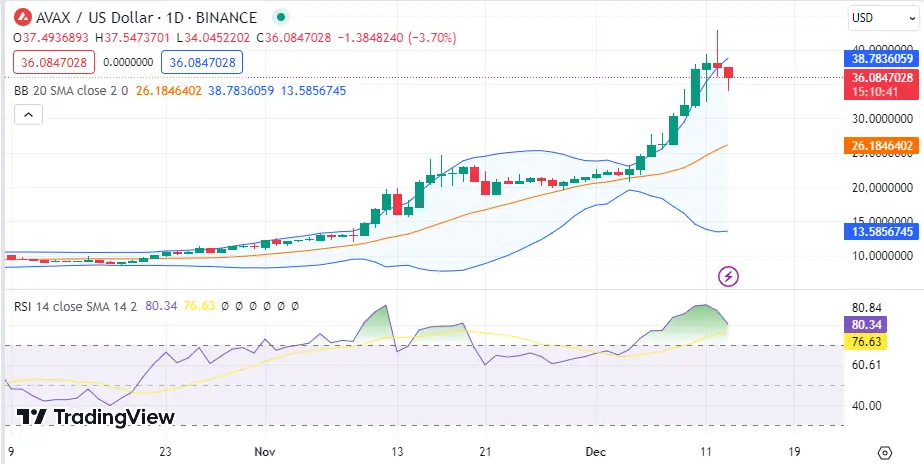 AVAX 1-day chart | Source: TradingView
Disclaimer: The information on this page may come from third parties and does not represent the views or opinions of Gate. The content displayed on this page is for reference only and does not constitute any financial, investment, or legal advice. Gate does not guarantee the accuracy or completeness of the information and shall not be liable for any losses arising from the use of this information. Virtual asset investments carry high risks and are subject to significant price volatility. You may lose all of your invested principal. Please fully understand the relevant risks and make prudent decisions based on your own financial situation and risk tolerance. For details, please refer to
Disclaimer.
