Technical Analysis
By Shayan
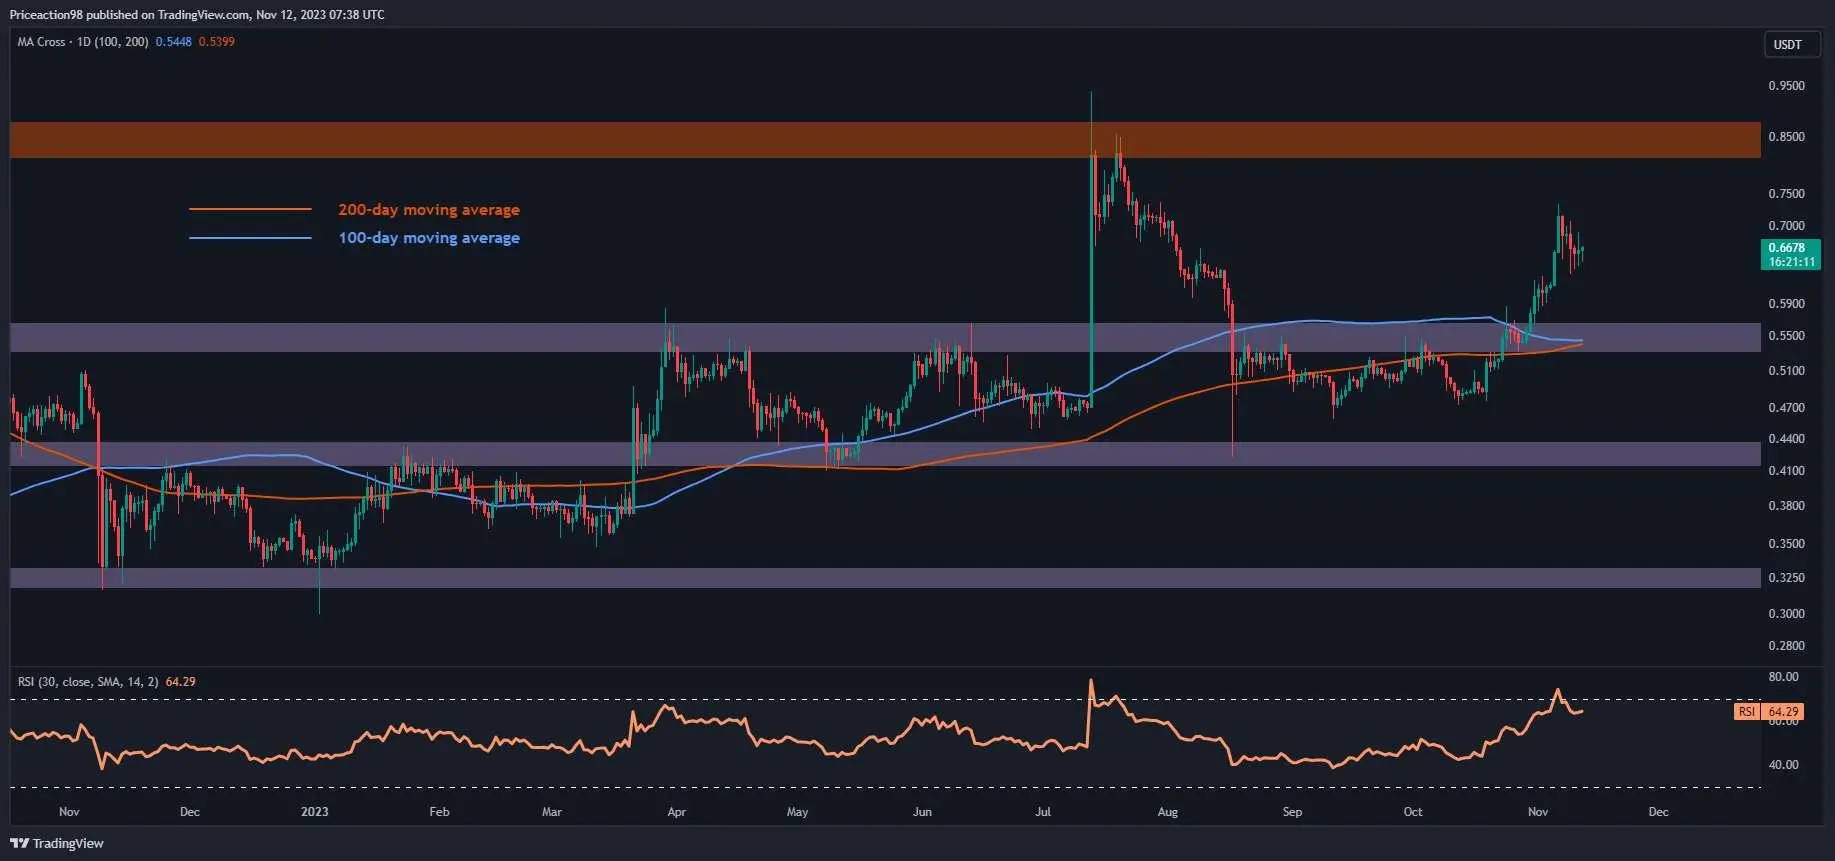
Following a breakout above the 100 and 200-day moving averages, Ripple’s price gained momentum and embarked on a robust uptrend, approaching its previous daily swing high. If the current surge continues, it could target the critical resistance region around $0.8.
The Daily Chart
Upon careful examination of the daily chart, Ripple’s price exhibited a period of sideways consolidation, followed by a promising uptrend that eventually reclaimed the 100-day and 200-day moving averages, roughly located at $0.54.
Continuing its upward trajectory, the price developed higher highs and higher lows, hinting at the presence of buyers in the market. However, it’s essential to note that the price is nearing a significant resistance region, marked by the previous major daily swing high of around $0.75.
In case the buyers overcome this pivotal price range, the uptrend might be extended toward higher critical resistance levels. However, despite the existing bullish momentum, a temporary rejection followed by a decline remains a possibility, as this resistance has significantly halted Ripple’s uptrend in mid-August.
 Source: TradingView### The 4-Hour Chart
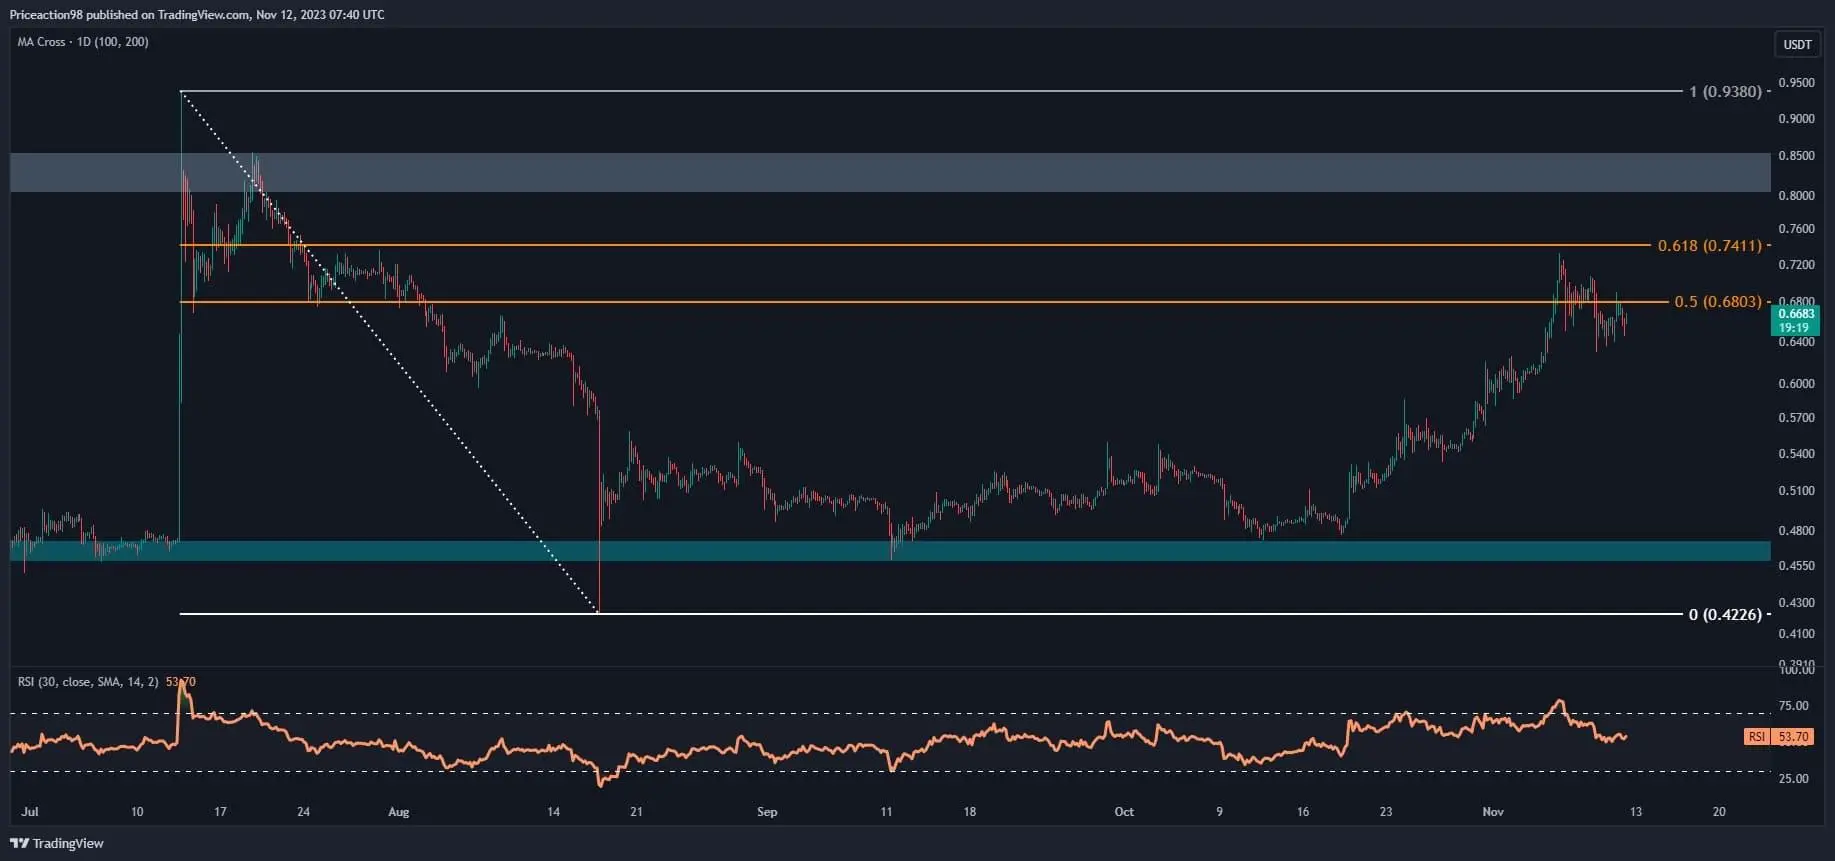
Shifting the focus to the 4-hour chart, a prolonged downtrend found substantial support at $0.47, leading to a brief period of sideways movement. The subsequent revival of bullish momentum saw buyers entering the market and propelling Ripple’s price upward. This resulted in a notable uptrend, reaching a pivotal resistance region.
The resistance region, defined by the price range between the 0.5 and 0.618 levels of the Fibonacci retracement, represents a formidable barrier for buyers.
Currently, the price has encountered a slight rejection at this pivotal region, indicating a potential reversal. If this reversal unfolds, the price may undergo a consolidation correction, retracing back toward the $0.53 support region.
However, if XRP successfully breaches the 0.618 level of the Fibonacci retracement, this scenario would be invalidated, potentially opening the door for further upward movement.
 Source: TradingView
Disclaimer: The information on this page may come from third parties and does not represent the views or opinions of Gate. The content displayed on this page is for reference only and does not constitute any financial, investment, or legal advice. Gate does not guarantee the accuracy or completeness of the information and shall not be liable for any losses arising from the use of this information. Virtual asset investments carry high risks and are subject to significant price volatility. You may lose all of your invested principal. Please fully understand the relevant risks and make prudent decisions based on your own financial situation and risk tolerance. For details, please refer to
Disclaimer.