Ripple’s price has been trending down over the past few days. The market is targeting key support levels against both USDT and BTC.
Technical Analysis
By Edris
The USDT Paired Chart
Against USDT, the price has been declining since the rejection from the $0.55 resistance area. It has also broken below both the 50-day and 200-day moving averages, which are located around the $0.5 and $0.54 levels, respectively.
The RSI indicator is showing values below 50%, indicating bearish momentum. Consequently, a drop toward the $0.43 support level appears likely in the short term.
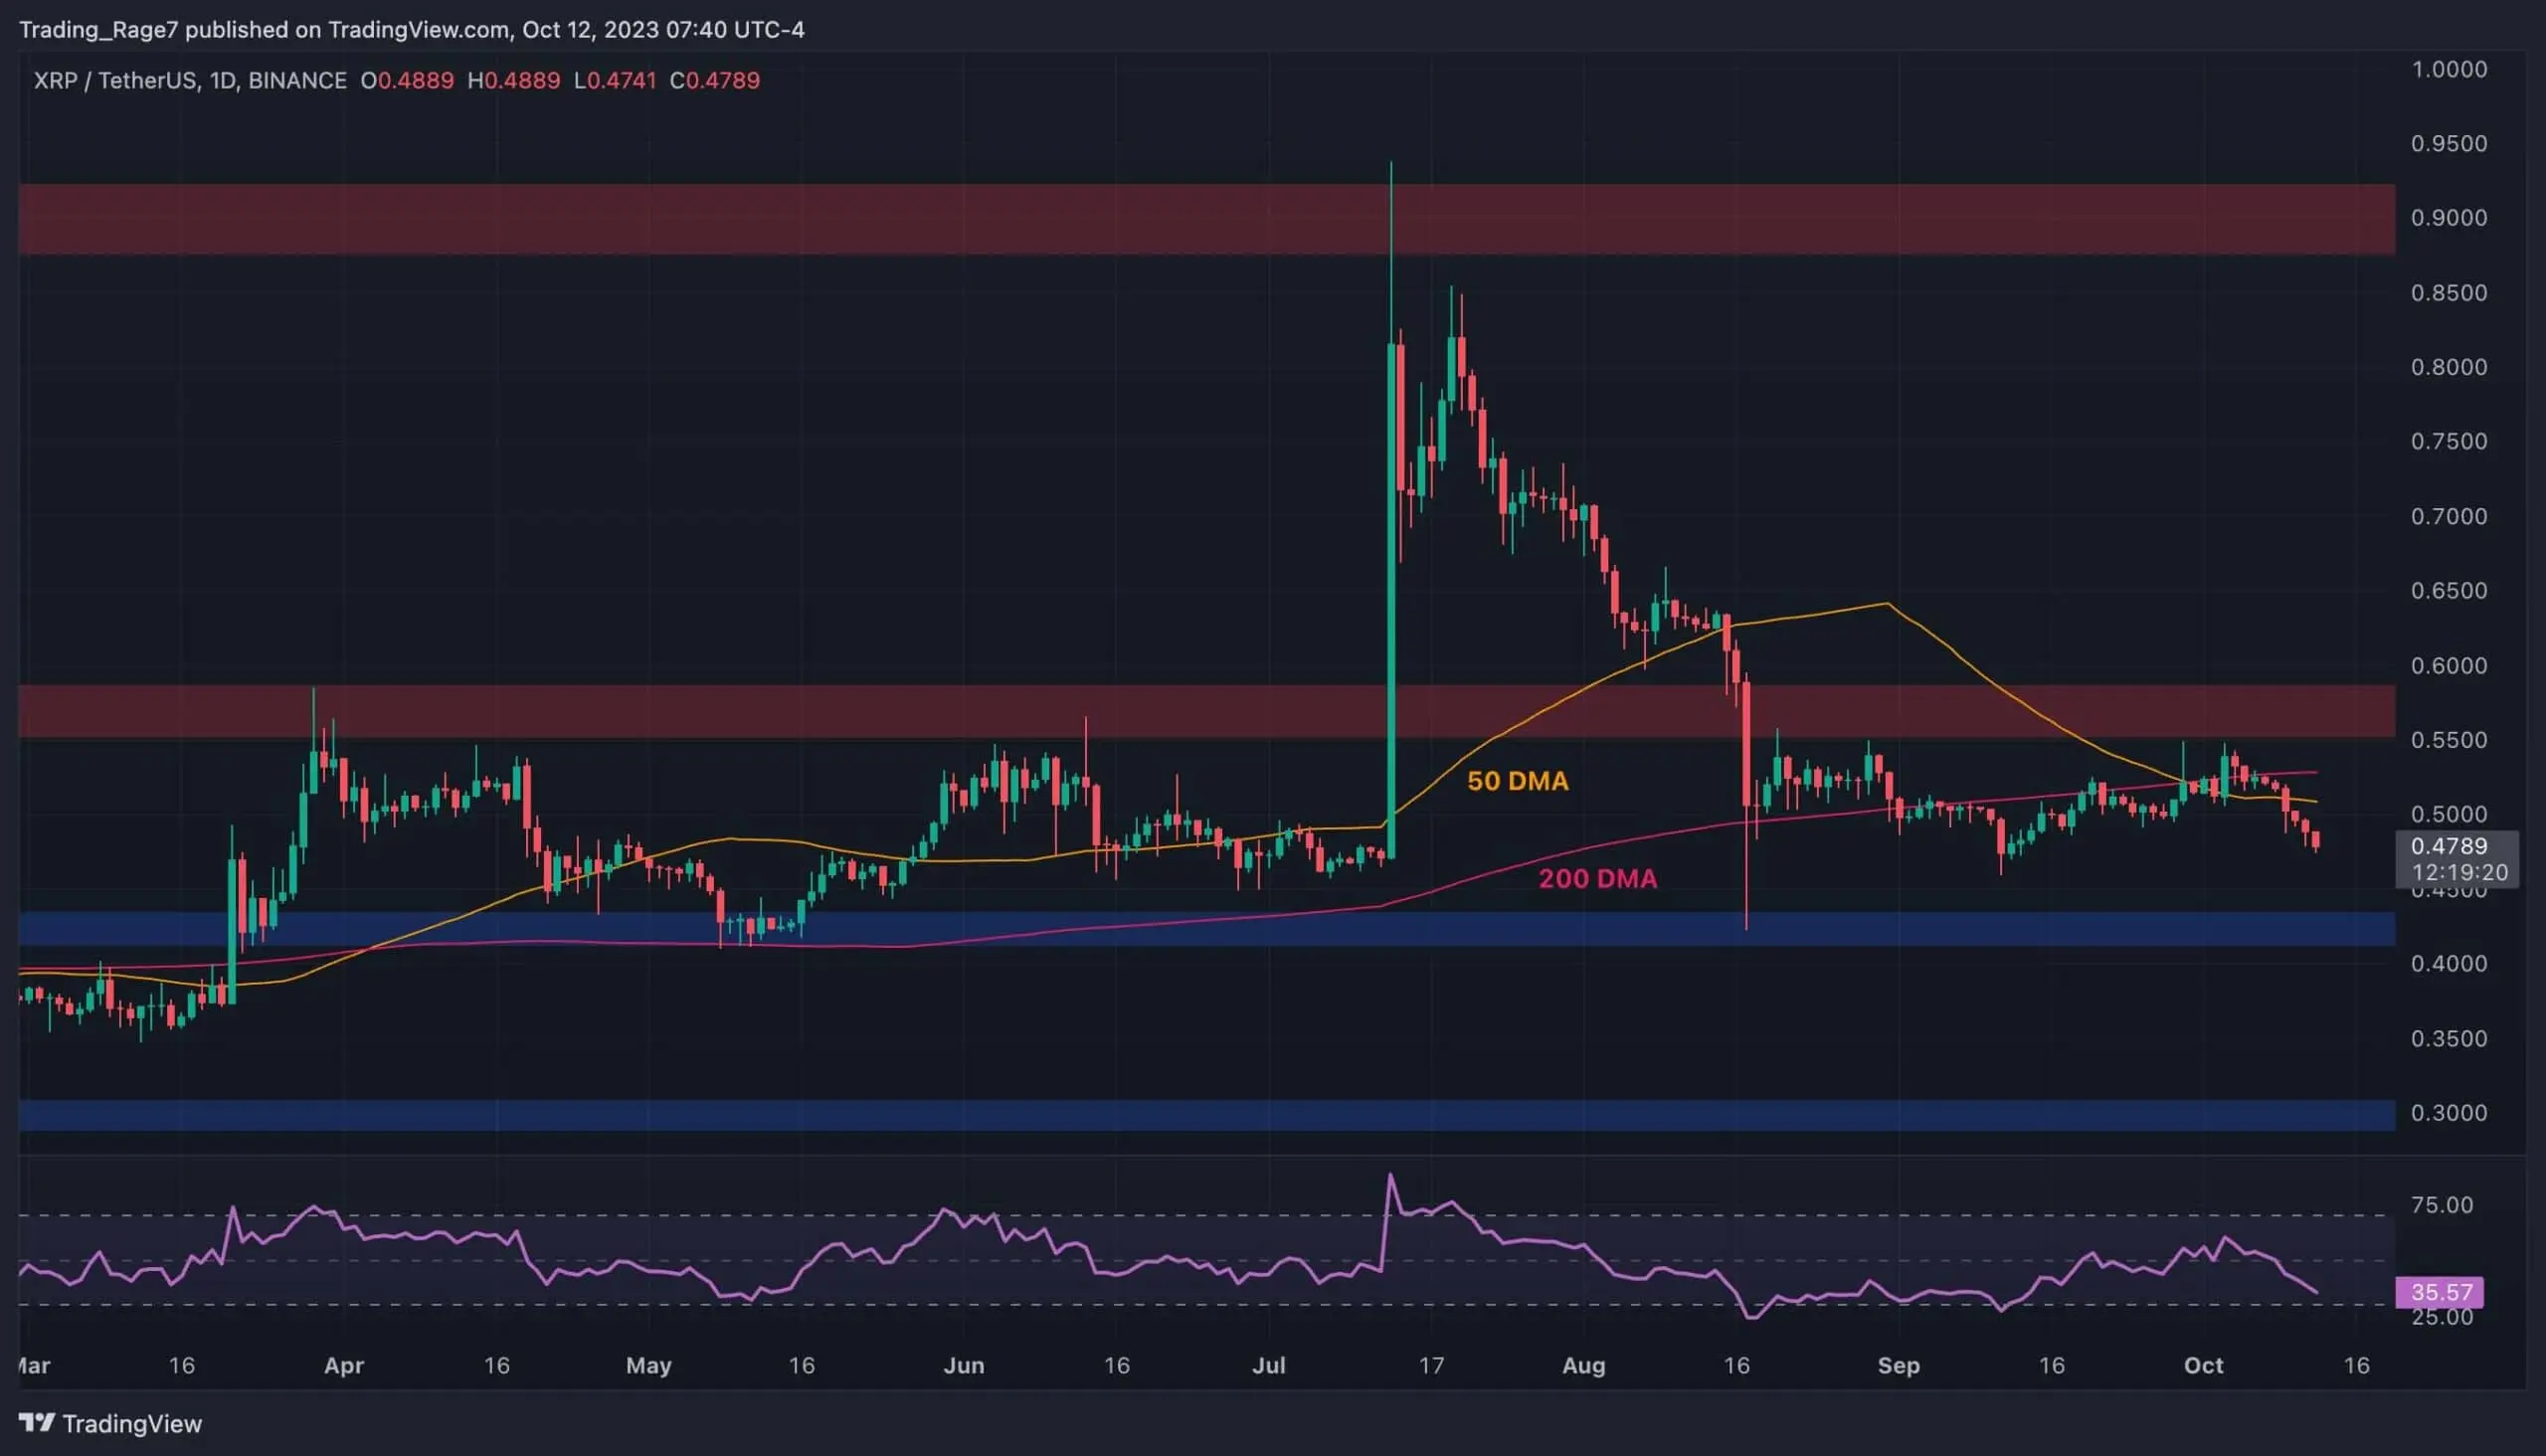 Source: TradingView### The BTC Paired Chart
The situation looks worse against BTC. The 50-day and 200-day moving averages are converging around the 1900 SAT level, potentially leading to a bearish crossover with the 50-day dropping below the 200-day. Moreover, the 1800 SAT support level seems to be breaking downwards, which could result in a rapid decline towards the 1600 SAT area.
Similar to the USDT paired chart, the RSI again suggests that momentum favors the sellers, making a bearish continuation more probable than a rebound.
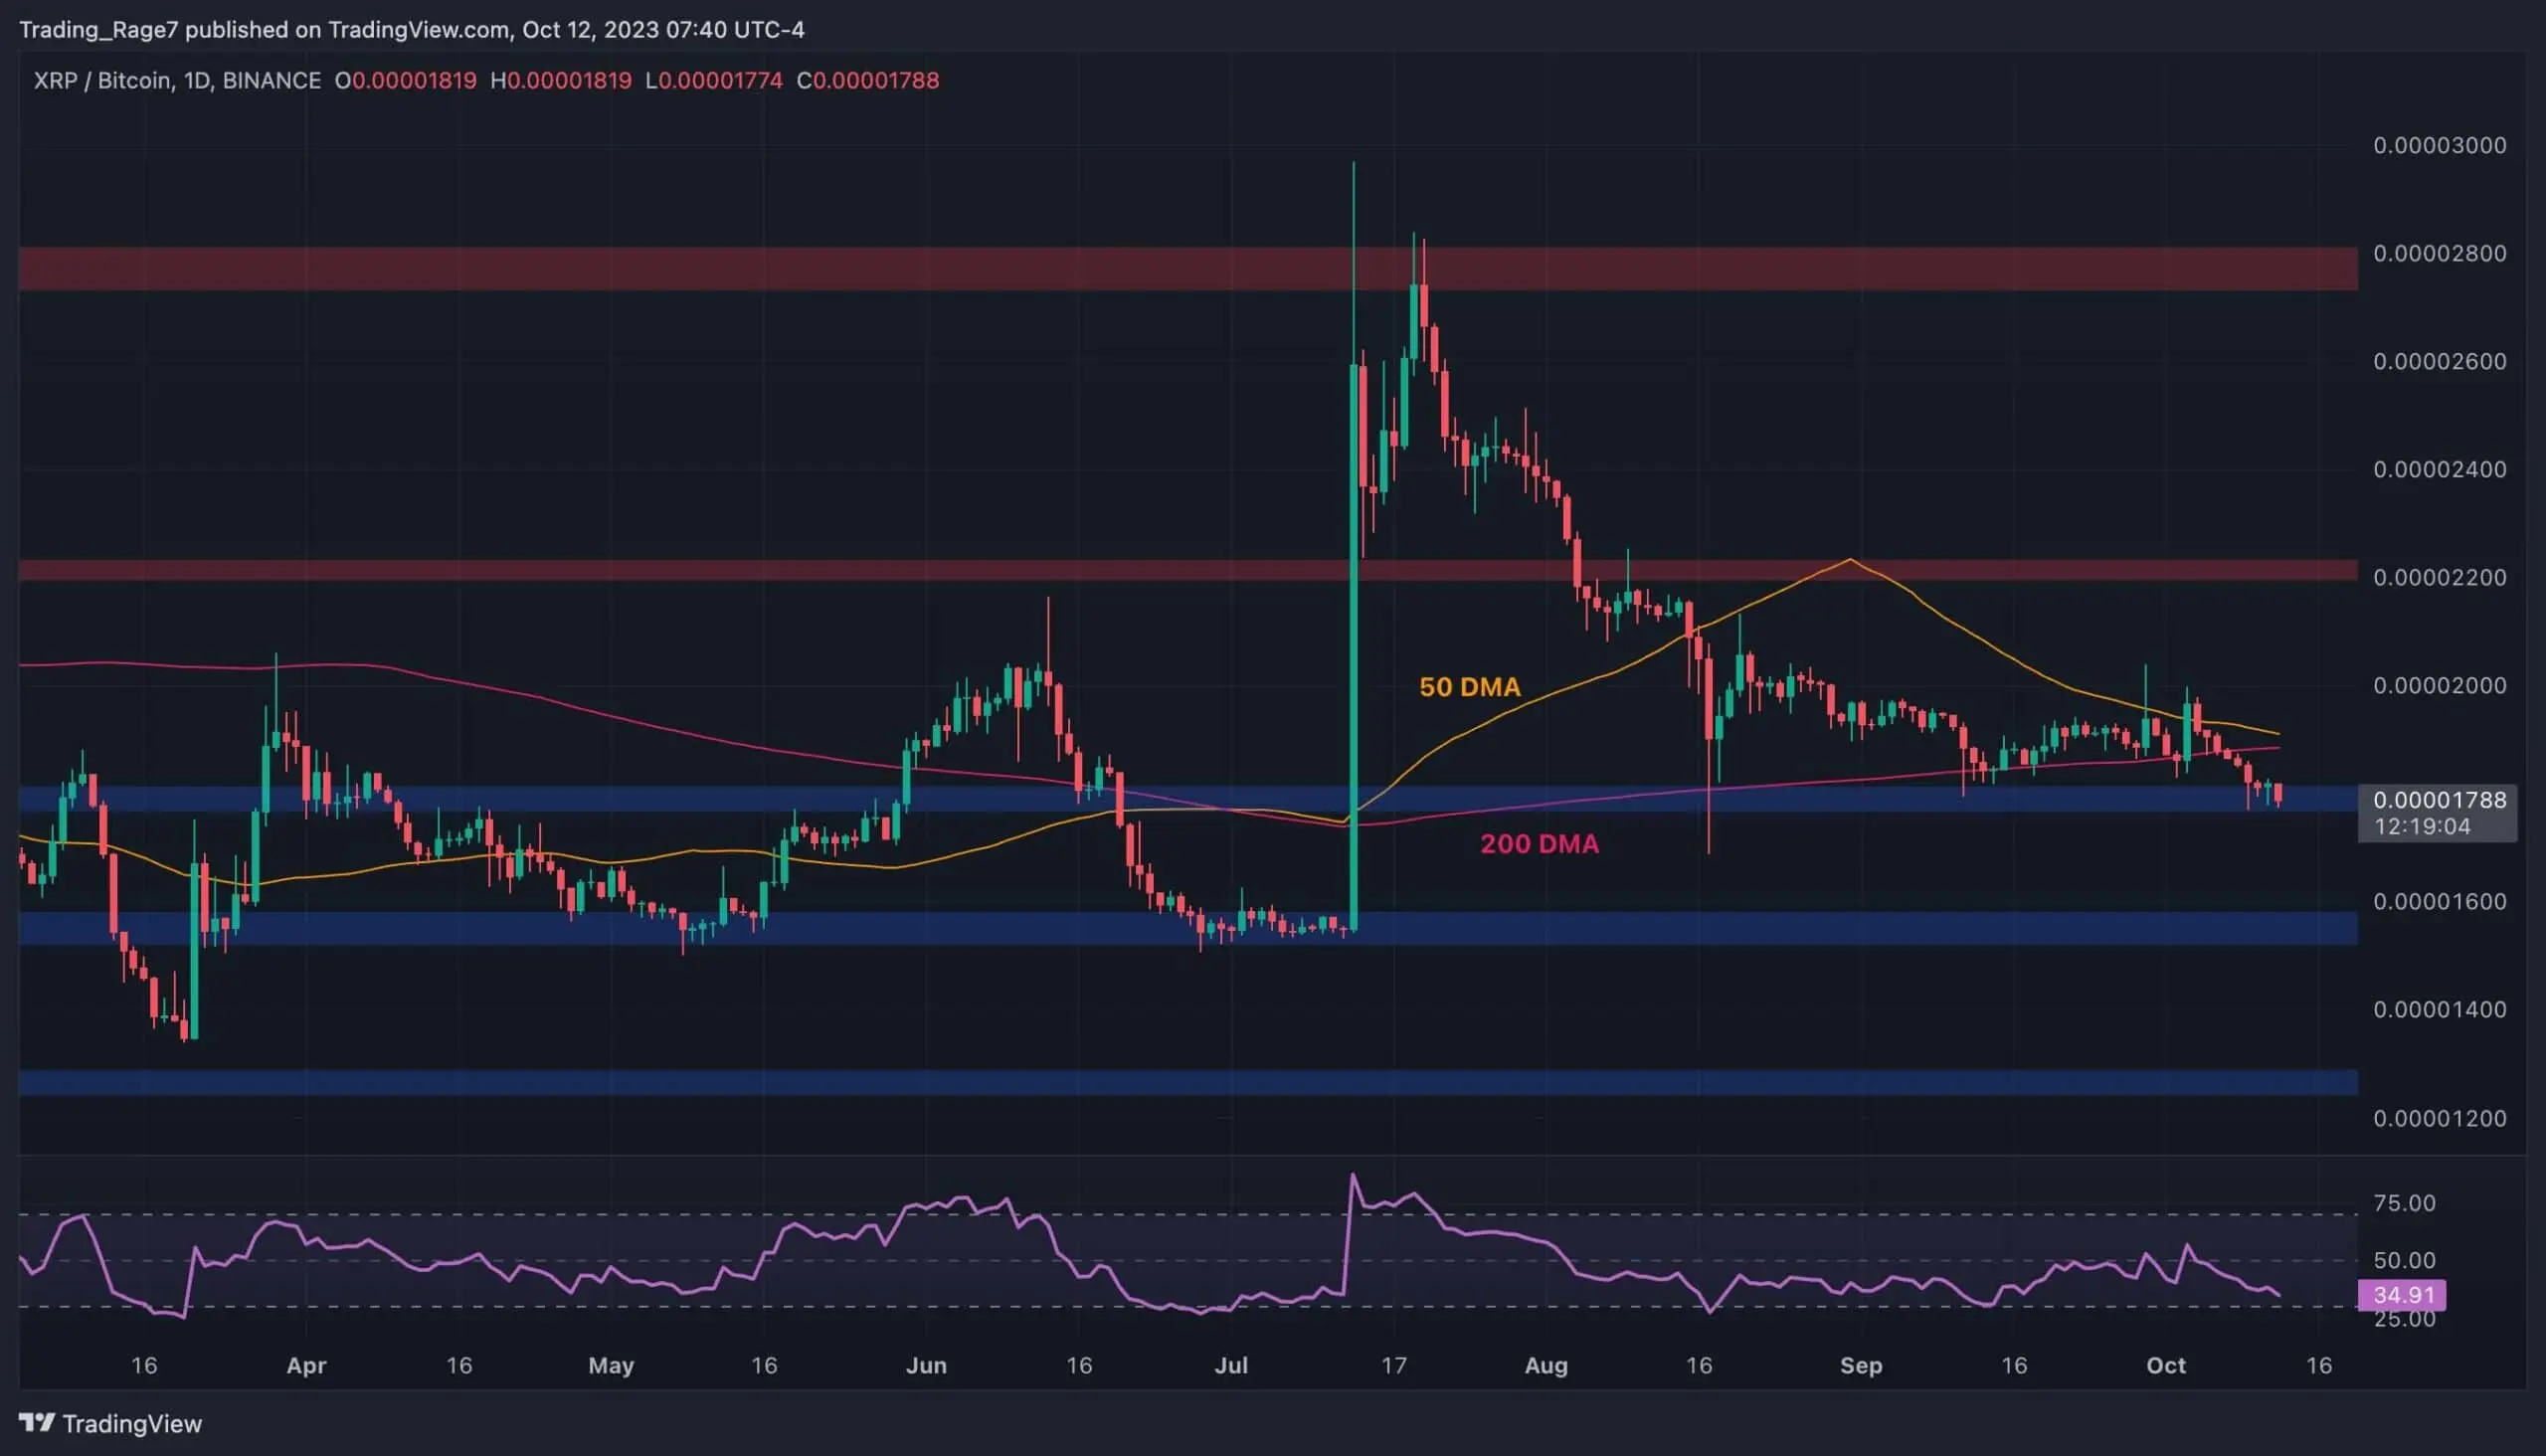 Source: TradingView
Disclaimer: The information on this page may come from third parties and does not represent the views or opinions of Gate. The content displayed on this page is for reference only and does not constitute any financial, investment, or legal advice. Gate does not guarantee the accuracy or completeness of the information and shall not be liable for any losses arising from the use of this information. Virtual asset investments carry high risks and are subject to significant price volatility. You may lose all of your invested principal. Please fully understand the relevant risks and make prudent decisions based on your own financial situation and risk tolerance. For details, please refer to
Disclaimer.