Ripple’s price has been gradually declining over the past few days, and the situation does not look promising for XRP at the moment.
Technical Analysis
By Edris
The USDT Paired Chart
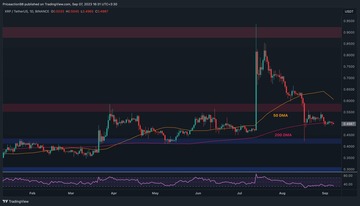
On the USDT-paired chart, the price has been struggling to rebound after the recent drop from the $0.9 resistance level. The 200-day moving average, located around the $0.5 mark, is also failing to hold the market, as the price has been closing below it in recent days.
Considering the current market structure and the RSI indicator showing values deep below 50%, there is a high likelihood of a drop towards the $0.43 support level in the short term.
 Source: TradingView### The BTC Paired Chart
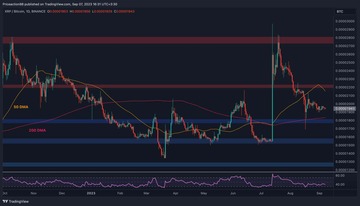
Looking at the BTC-paired chart, things are quite similar. While the 200-day moving average, trending around the 1850 SAT level, is still intact on this chart, the price is making clear lower highs and lows, indicating a bearish market structure.
If the 200-day moving average and the 1800 SAT support level are broken to the downside, things will get ugly for Ripple, and the price could drop toward the 1500 SAT area in no time.
 Source: TradingView
Disclaimer: The information on this page may come from third parties and does not represent the views or opinions of Gate. The content displayed on this page is for reference only and does not constitute any financial, investment, or legal advice. Gate does not guarantee the accuracy or completeness of the information and shall not be liable for any losses arising from the use of this information. Virtual asset investments carry high risks and are subject to significant price volatility. You may lose all of your invested principal. Please fully understand the relevant risks and make prudent decisions based on your own financial situation and risk tolerance. For details, please refer to
Disclaimer.