Has the Bitcoin market activity during Ramadan come to an end? Anomalous signals under familiar patterns in 2026
Over the past seven Ramadan months, Bitcoin has repeated a structural script in six cases: an early surge followed by oscillation and weakening, creating a strong seasonal expectation in the market. However, the start of 2026 has gone against this pattern—opening with a decline rather than a rally, disrupting the sequence and throwing off the rhythm. On-chain data suggests a potential rebound signal, but demand remains subdued. The trajectory of this Ramadan may not be as clear-cut as historical expectations.
Seven Years of Data Reveal the Market Structure Code
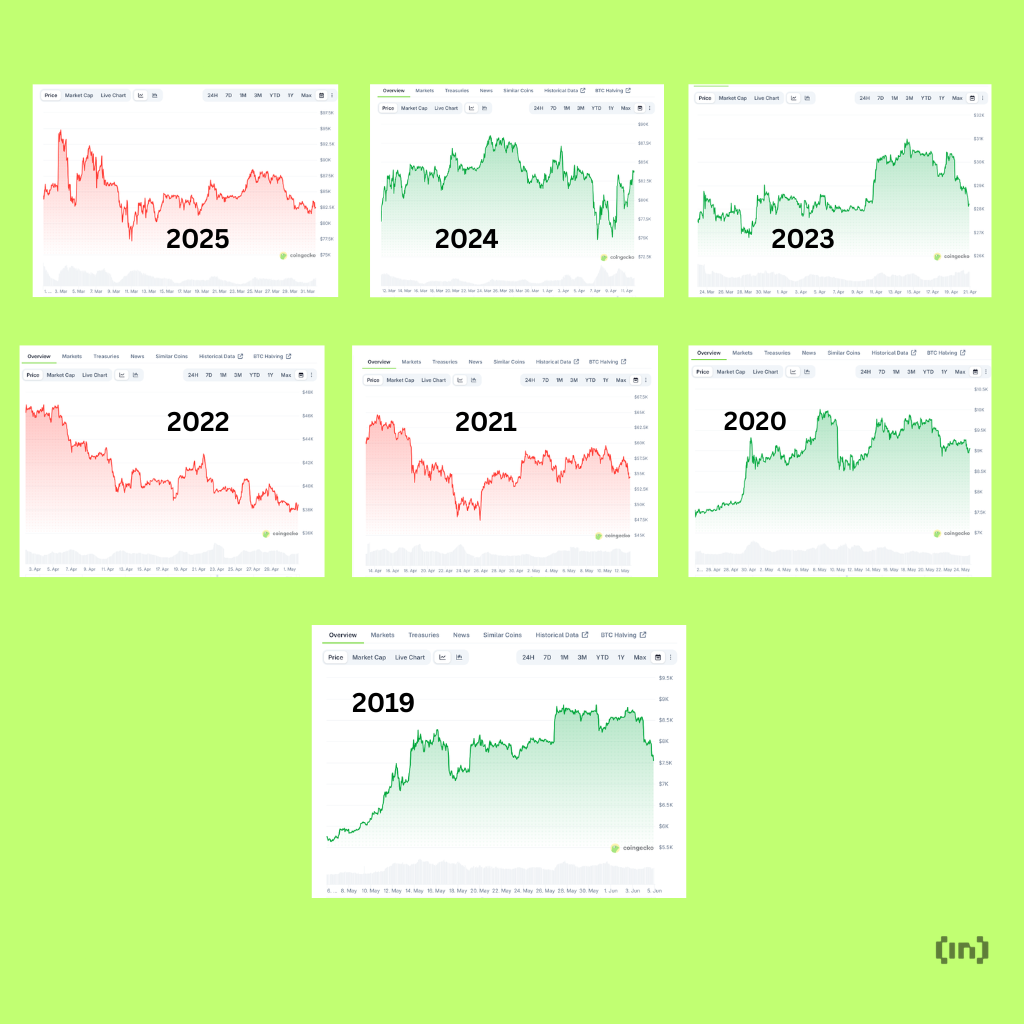
(Source: BeInCrypto)
Reviewing the seven Ramadan months from 2019 to 2025, Bitcoin exhibits a highly consistent market structure: a strong rally at the beginning of the month, followed by oscillation and weakening, with a bearish close at month-end. This pattern held true in six of the seven years, with the only exception being 2020—when a robust macroeconomic recovery completely overrode the seasonal pattern.
This is not a myth that “Ramadan always rises.” What repeatedly appears is a more refined timing structure—volatility front-loaded, mid-term momentum waning—almost never missing a significant pullback after the mid-month high, even if the month ends higher.
Three Core Features of Ramadan Market Trends Over Six Years
Early Concentrated Rally: The first few days after the month begins are often the most volatile period, with bullish momentum densely released during this window.
Mid-term Momentum Exhaustion: The rally noticeably diminishes in the middle of Ramadan, with traders taking profits and creating persistent selling pressure.
Weakening Month-End Structure: Even if the month closes higher, the end of the month often remains significantly below the mid-month high, forming a head-heavy, tail-light market profile.
2026: Familiar Emotions, Reversed Script
The difference this year is clear from the first week. Bitcoin did not follow the usual pattern of a strong rally to start; instead, it oscillated first and then sharply declined, struggling to rebound. Volatility was intense, emotions swung rapidly, and recovery was uncertain—these elements are still present, but the sequence has been completely disrupted.
For traders, this “familiarity” could be the most dangerous cognitive trap. Interpreting 2026 through the old scripts of 2019–2025 may lead to misjudging entry points and making the worst decisions at the most familiar emotional moments. The pattern remains faintly visible, but the critical early strong foundation of the past six years is missing, greatly undermining the reliability of the seasonal logic.
On-Chain Data: The Battle Between Rebound Potential and Demand Weakness
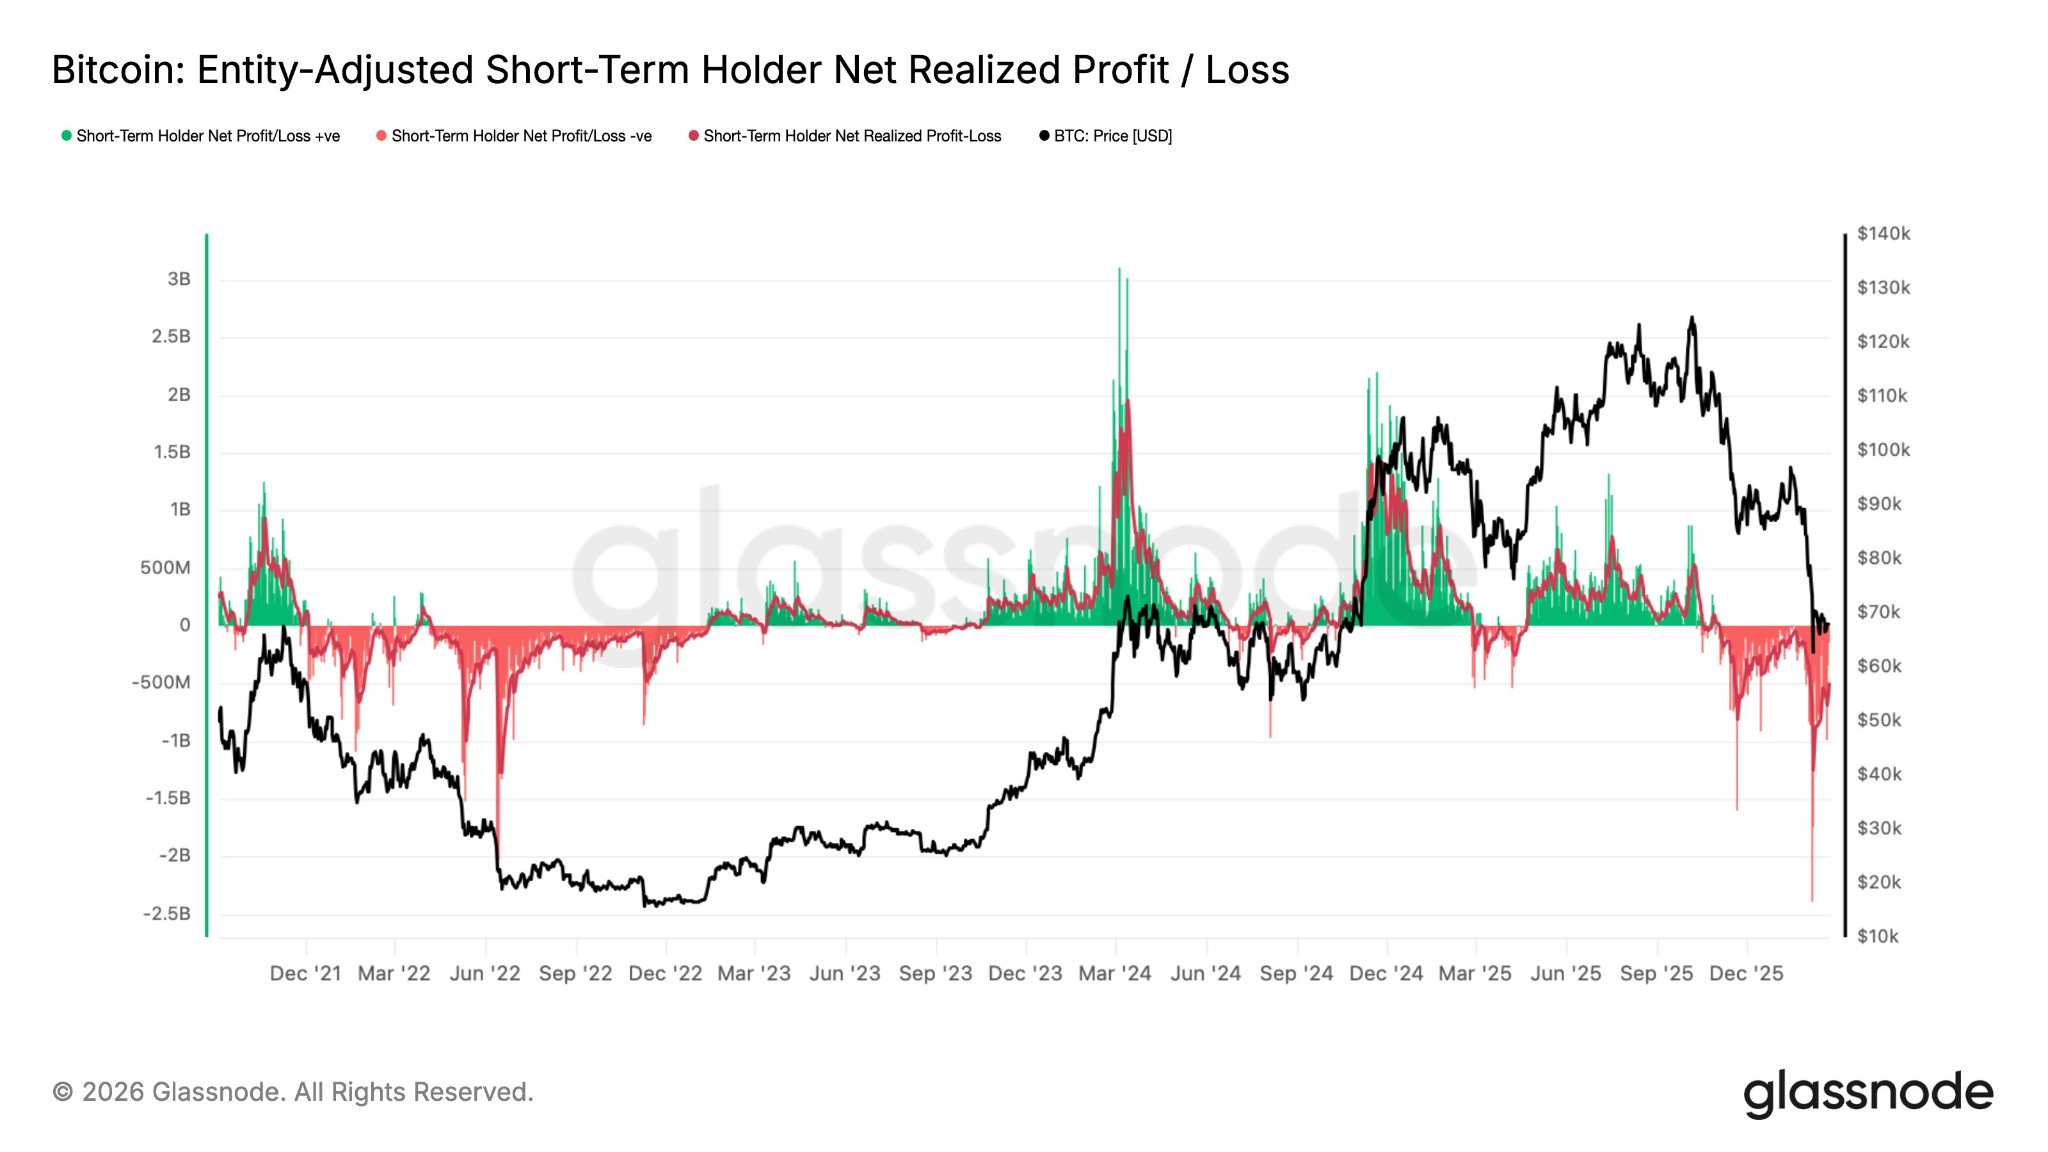
(Source: Glassnode)
On-chain indicators currently present mixed signals, with optimism and caution coexisting.
The Binance Purchase Power Index has fallen back to near historically exhausted lows. This is a contrarian bullish signal—when selling pressure wanes, conditions for a technical rebound gradually mature.
However, active Bitcoin addresses have been weakening for six consecutive months, indicating a more fundamental structural warning. Persistent low user activity suggests demand lacks solid support, and any rebound may face heavy resistance above, making sustained upward movement difficult.
Short-term holder (STH) realized profits and losses also convey complex messages. Panic selling has clearly slowed, but many recent buyers are still deep in loss. This situation often occurs during bottom formation but does not confirm an uptrend—bottoming and trend reversal are separated by a volatile, choppy accumulation phase.
Overall, Bitcoin in the 2026 Ramadan month has the technical conditions for a rebound, but demand remains fragile, and upside potential may be limited. The outline of the historical pattern is still discernible, but this time, the first act has already been rewritten, and the uncertainty of subsequent moves is much higher than in previous years.
Related Articles
Glassnode: Over 400,000 Bitcoins are accumulated in the $60,000 to $70,000 range, forming a dense cost support zone
ONDO Bleeding in a Weak Market, But Tokenized Stocks and New L1 Could Flip the Entire Narrative
F2Pool Co-founder Wang Chun: ETH rebounded from $1,386 to $4,956 within 4 months, and investors should not be swayed by short-term panic emotions.
SUI Extends Decline as Technicals Signal Further Downside