Decred (DCR) is maintaining an impressive breakout momentum, increasing by an additional 5% at the time of writing on Monday, marking its fifth consecutive rally. This upward trend occurs amid bullish efforts to challenge a key resistance zone in the market.
Notably, the limited circulating supply—stemming from continuous user staking and persistent treasury accumulation—is creating significant upward pressure on DCR’s price. From a technical perspective, Decred is at a critical juncture, as increasing buying pressure could determine the next direction of the trend.
Limited Supply Drives DCR Demand
On-chain data shows that 10.9 million DCR are currently staked, accounting for 67.4% of the total mined supply (16.2 million DCR) and locked for 142 days. Additionally, the treasury holds over 873,000 DCR, removing another 5.4% from the circulating supply and reducing actual market liquidity to approximately 4.40 million DCR. This scarcity of supply is significantly boosting demand, attracting increasing investor interest in this privacy-focused coin.
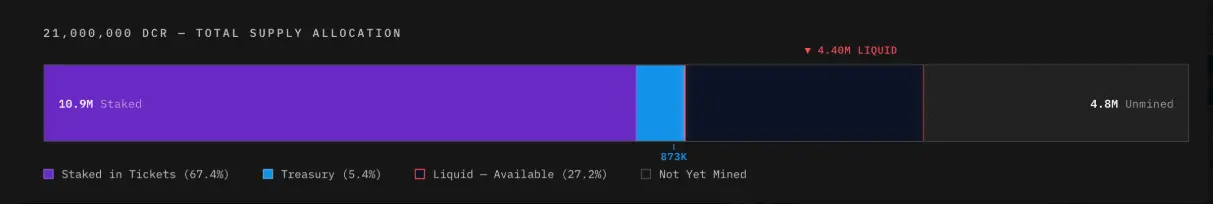 DCR Supply Distribution | Source: Decred.supply## Technical Outlook: Will Decred Continue Its Uptrend?
Decred has gained about 5% at the time of writing on Monday, breaking above the $25.00 level. The short-term recovery is currently challenging the 38.2% Fibonacci retracement at $26.13, calculated from the November 4 high of $70 down to the December 23 low of $14.21. This is a key resistance zone that has repeatedly halted upward attempts since late November, reflecting ongoing significant selling pressure.
If the price can convincingly close above the $26.13 level, the bullish trend may be reinforced, opening the door toward higher Fibonacci retracement levels at $31.54 (50%) and $38.07 (61.8%).
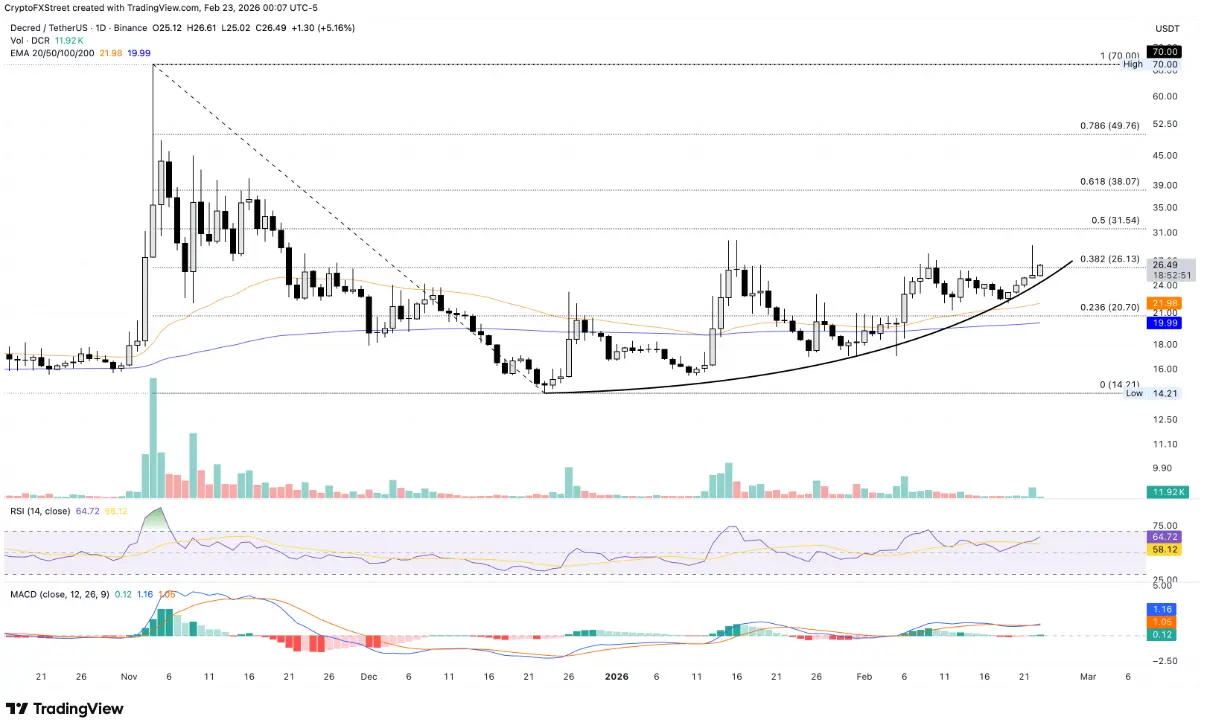 Daily DCR/USDT Chart (Logarithmic) | Source: TradingView In terms of momentum, the Relative Strength Index (RSI) on the daily timeframe is around 63 and continues to rise, indicating increasing buying strength and a sustained recovery from the neutral zone. More importantly, the RSI still has room to grow before entering overbought territory, supporting the scenario of continued price advancement. Additionally, the MACD line has crossed above the signal line, signaling positive momentum and the potential formation of a new bullish impulse.
Conversely, if the price fails to break above and reverses from the $26.13 zone, a correction scenario could unfold, with Decred retreating to test the 50-day Exponential Moving Average (EMA) around $21.96.
Disclaimer: The information on this page may come from third parties and does not represent the views or opinions of Gate. The content displayed on this page is for reference only and does not constitute any financial, investment, or legal advice. Gate does not guarantee the accuracy or completeness of the information and shall not be liable for any losses arising from the use of this information. Virtual asset investments carry high risks and are subject to significant price volatility. You may lose all of your invested principal. Please fully understand the relevant risks and make prudent decisions based on your own financial situation and risk tolerance. For details, please refer to
Disclaimer.
Related Articles
Bitcoin drops to $70,600, Ethereum holds at 2,055. Analysts: Bull market score is only 10; don't put too much faith in this rebound.
Bitcoin has recently continued to hit new lows, currently trading at $70,923, and CryptoQuant has warned that the recent rebound is only a short-term rally in a bear market, with a bull market score of only 10 points. The US stock market has declined across the board, and the crypto market is also under pressure. The future trend depends on whether spot demand turns positive. There are multiple scenarios in the market, including possible sideways consolidation or a drop to the $56,000-$60,000 support zone. Ethereum has shown relative strength in this wave of market movement, but if Bitcoin continues to decline, its support levels will need to be observed.
動區BlockTempo32m ago
Bitcoin Reclaims $70K As ETF Flows Stabilize and Selling Pressure Eases
Glassnode reports that Bitcoin's ETF flows are stabilizing after outflows, coinciding with a price rebound above $70,000. Healthy inflows into ETFs indicate a cautious optimism among institutions, but macro risks persist, necessitating continued monitoring of market trends.
BlockChainReporter43m ago
Culper Research announces short positions on ETH and related securities, claiming that Fusaka's upgraded token economic model has been damaged
Short-selling firm Culper Research announced that it is shorting Ethereum and related securities, believing that the Fusaka upgrade in 2025 will harm the ETH tokenomics model. The upgrade resulted in a larger-than-expected decrease in Gas fees, and on-chain data shows that the growth in active addresses and transaction volume is driven by low-value transactions. Culper believes Vitalik is aware of this and will continue to sell ETH, expecting ETH prices to decline further.
GateNews44m ago
Why did Bitcoin drop today? The US warns of a ground invasion in Iran, and Trump demands to lead the next Supreme Leader.
Bitcoin prices fluctuate due to escalating geopolitical tensions, dropping from $72,000 to $70,000 on March 6. Trump's tough rhetoric on the Iran situation, Iran's refusal to cease fire, and the U.S. military announcing increased strikes have heightened risk aversion. Market sentiment is divided, with some predicting Bitcoin will reach $80,000, but some analysts remain skeptical about a rebound. $72,000 is a key technical level; failure to break above it could lead to a drop toward $64,000.
MarketWhisper56m ago
Today, the Fear and Greed Index dropped to 18, indicating the market is in a "Extreme Fear" state.
Foresight News reports that, according to Alternative.me data, the cryptocurrency Fear and Greed Index dropped to 18 today (yesterday the index was 22, indicating "Extreme Fear"), indicating that the market is in a "Extreme Fear" state.
GateNews1h ago

