HBAR is approaching the $0.10 mark again as the buyers return — but still holding the resistance level
Hedera (HBAR) is striving to regain upward momentum after several weeks of trading within a narrow range. Recently, the price approached the $0.10 level but has yet to break through clearly. Since the beginning of the month, resistance around this level has continuously limited HBAR’s upward movement.
Although HBAR temporarily surpassed the $0.10 mark, the bullish momentum quickly weakened when encountering a significant technical barrier. Traders have adjusted their strategies, but there is still no clear consensus on a sustainable upward trend.
Capital inflows into HBAR are increasing sharply
Data from the Money Flow Index (MFI) indicates that buying pressure on HBAR is gradually rising. The MFI, a momentum indicator based on trading volume, measures the flow of funds in and out based on price and volume. Currently, this index is above the neutral 50 level, suggesting buyers are gaining dominance.
The positive MFI reading signals accumulation activity is underway. Increasing capital flow often precedes price increases, especially when supported by higher trading volume. If this trend continues, HBAR could benefit from sustained accumulation, strengthening its chances of breaking through key resistance levels in the short term.
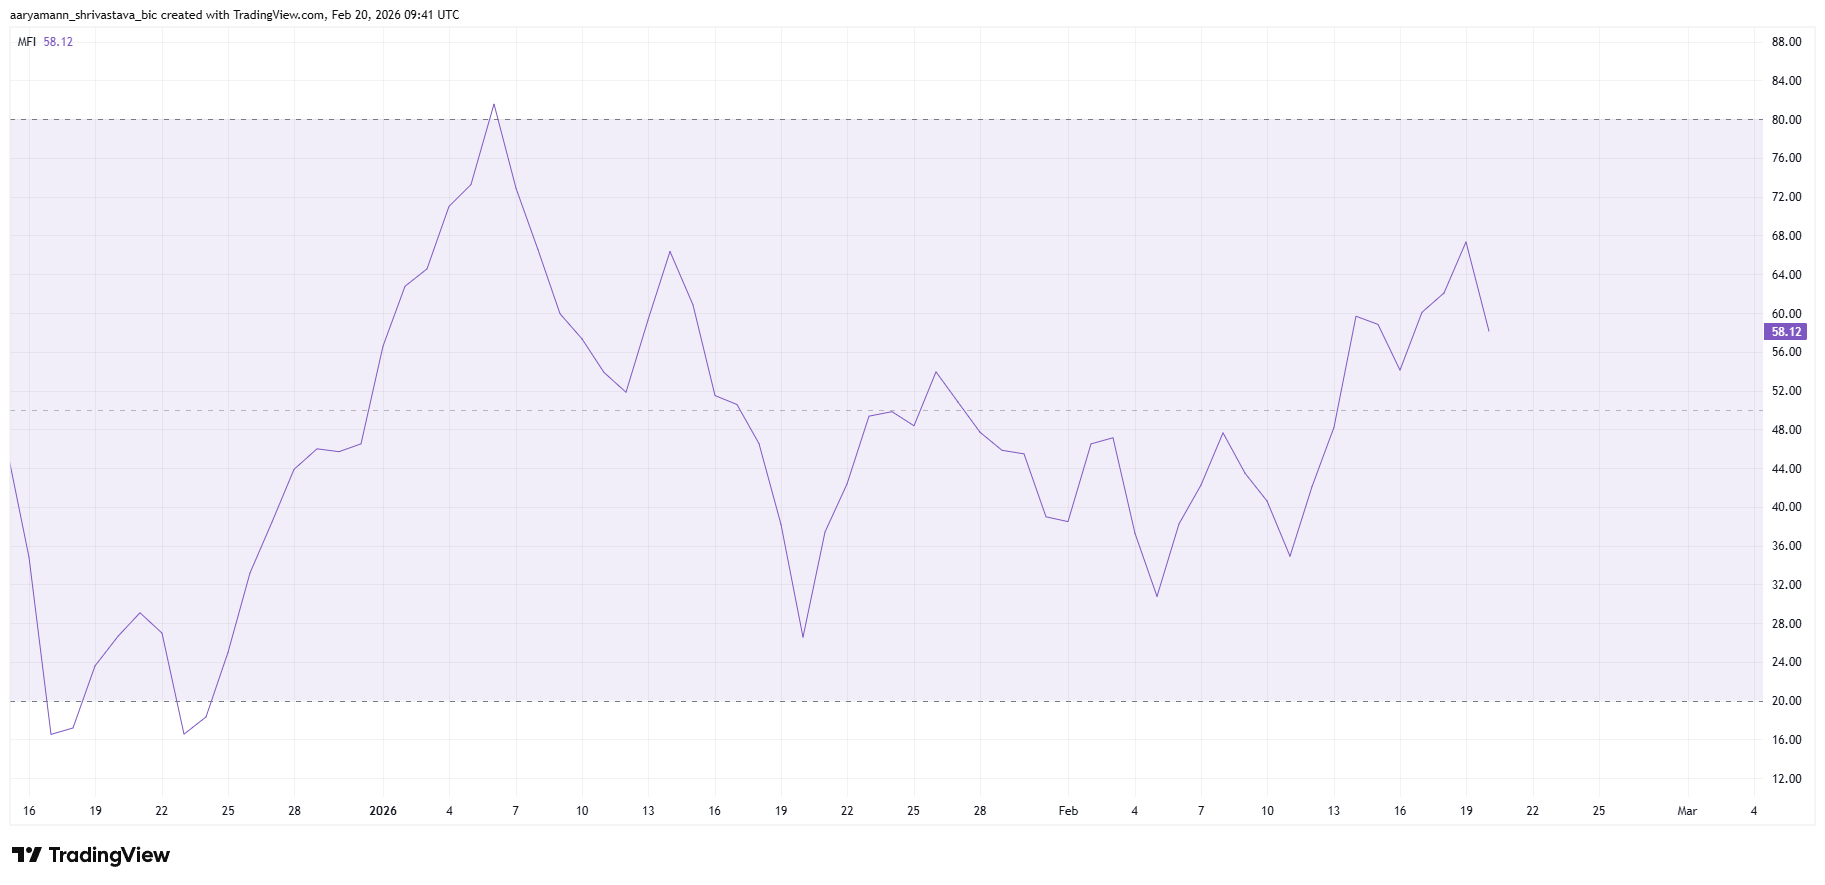 HBAR MFI Index | Source: TradingView
Market sentiment remains cautious
Data from the derivatives market provides a mixed outlook—both optimistic and cautious. Currently, HBAR’s funding rate favors long positions, indicating traders are willing to pay fees to hold long contracts, reflecting expectations of rising prices.
However, the volatility in the funding rate over the past two weeks shows market sentiment remains uncertain. From February 6 to 11, short contracts dominated open interest, exerting downward pressure on HBAR. This was quickly reversed, turning positive again, then declining once more.
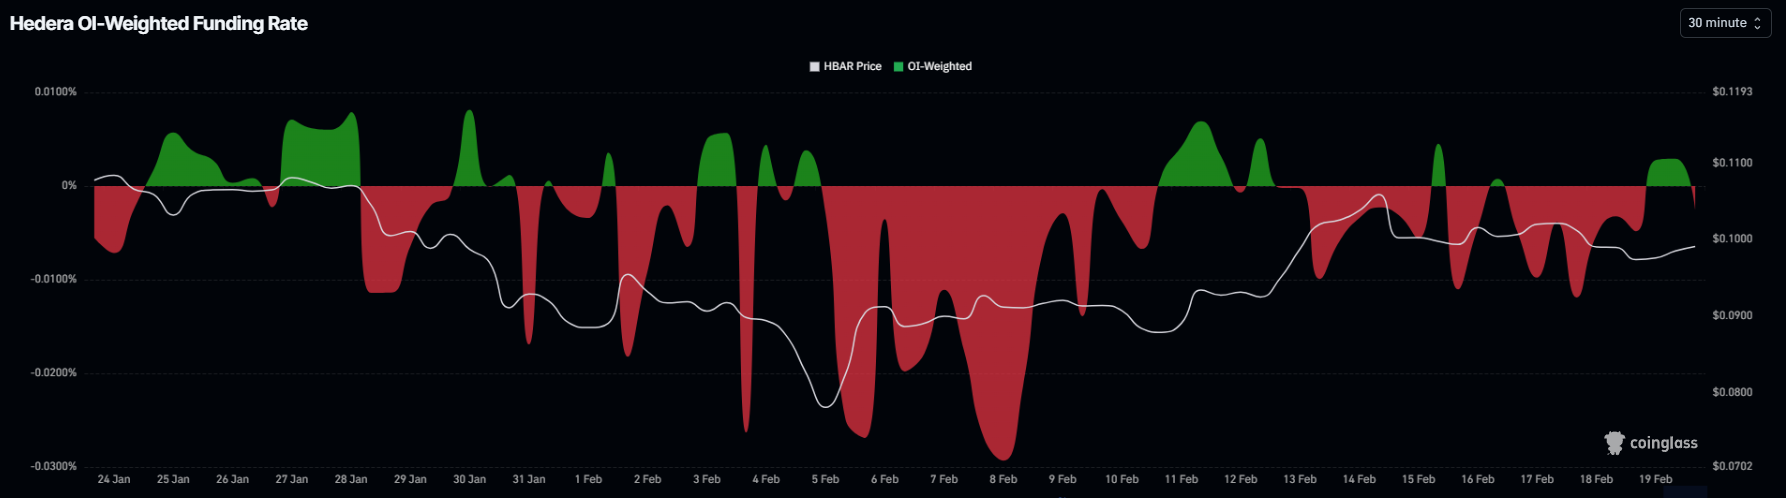 Funding Rate HBAR | Source: Coinglass
These fluctuations reflect hesitation among leveraged traders. Although downward pressure from short contracts has eased, confidence in an upward trend is not yet solid. A stable, positive funding rate would reinforce bullish prospects, but current data suggests market sentiment is reacting to short-term volatility rather than long-term confidence.
HBAR price targets
At the time of writing, HBAR is trading at $0.0992, maintaining above the critical support level of $0.0961—corresponding to the 38.2% Fibonacci retracement. Holding this support is technically significant, as it serves as a key point to sustain the bullish trend.
However, resistance at $0.1035, the 50% Fibonacci retracement level, remains a major obstacle preventing HBAR from making a decisive breakout.
If the price decisively breaks above $0.1035, it would signal a short-term structural change. When this resistance turns into support, it could trigger renewed buying interest, especially if buying pressure continues to grow.
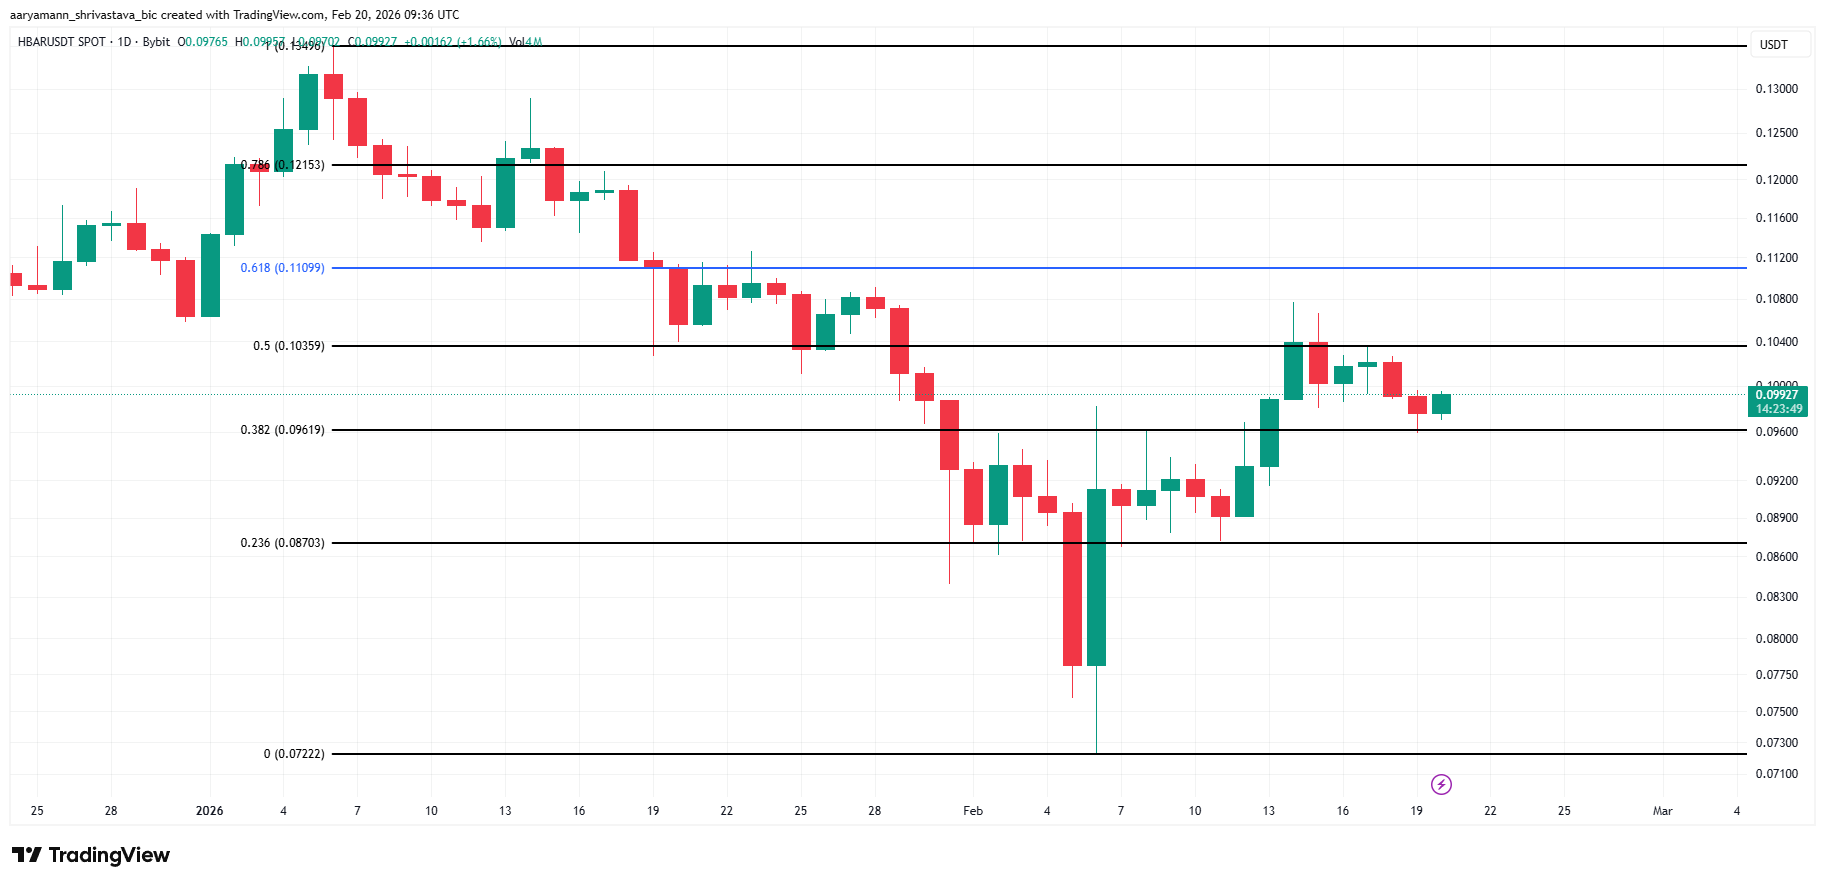 HBAR Price Analysis | Source: TradingView
The next target for HBAR is $0.1109, the 61.8% Fibonacci retracement level, a closely watched technical threshold by traders. This often acts as a strong support zone once surpassed.
Conversely, if bullish indicators are not strong enough to sustain the rally, the price may continue to fluctuate within the current range. Declining capital flow would weaken breakout efforts and reinforce resistance at $0.1035.
In a worst-case scenario, if the price falls below the support level of $0.0961, the short-term structure would shift to a downtrend. In that case, HBAR could decline further toward $0.0870, undermining recovery hopes and giving control back to the sellers.
In summary, HBAR faces a critical crossroads with increasing buying pressure, but market skepticism still persists. A breakout above $0.1035 would confirm an uptrend, while falling below $0.0961 could signal a negative reversal.