Silver Price Eyes $92 Pump Next Week as Bulls Complete a Powerful Reversal Pattern
Silver (XAG) has been drifting lower for weeks, but that may be changing. Analyst Rashad Hajiyev, followed by over 96,000 traders, shared a chart that points to a possible bullish reversal.
The pattern is a popular signal that often leads to a strong move higher if silver breaks above resistance.
In his tweet, Hajiyev explains that the silver price is now finalizing the formation of the right shoulder of an Inverse Head and Shoulders pattern. This is often the last piece of the puzzle before buyers attempt to flip the trend.
He notes that immediate resistance sits just under the $80 zone, and that the bigger target at $92 could already be challenged as early as next week if momentum accelerates.
- The Silver Chart Shows a Classic Inverse Head and Shoulders Setup
- The $80 Resistance Zone Is the Breakout Trigger
- Silver Price Outlook
The Silver Chart Shows a Classic Inverse Head and Shoulders Setup
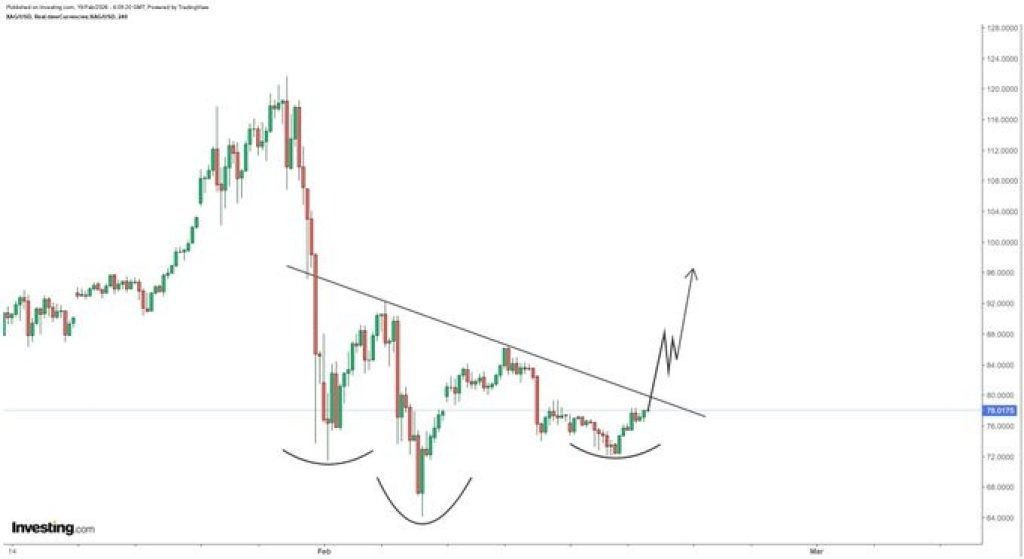
The chart structure is fairly clean and follows a textbook reversal formation. Silver experienced a steep sell-off earlier in the year, which created the left shoulder. After a brief bounce, price flushed even deeper to form the head, marking the lowest point of the entire move.
Since then, the silver price has recovered again and is now shaping the right shoulder, a phase that usually signals sellers are losing control.
What stands out is that silver is no longer printing fresh lows. Instead, price is stabilizing, and the market is starting to build a base. This type of behavior is often the early foundation for a trend reversal, especially after an extended period of weakness.
Source: X/RashadHajiyev
The $80 Resistance Zone Is the Breakout Trigger
A key feature on the Silver chart is the descending trendline that has capped silver’s recovery attempts. This trendline represents the main barrier bulls need to break.
The area just below $80 has become the immediate decision point, and a clean move above it would confirm that the downtrend is finally breaking.
This is why the next few sessions matter. If the silver price can push through resistance with strength, it could trigger a wave of momentum buying and force short sellers to exit, which often fuels sharp upside continuation moves.
_****This JasmyCoin (JASMY) Unique Tokenomics Could Become the Main Trigger for Next Rally**
Meanwhile, the $92 level is emerging as the major upside target because it lines up with the projected breakout move of the Inverse Head and Shoulders pattern. Once price clears the neckline, rallies tend to accelerate quickly, especially if the market has spent weeks compressing under resistance.
Silver has been holding steady during the right shoulder. Instead of dropping again, price has stayed supported and started forming higher lows, which shows buyers are stepping in calmly.
Silver Price Outlook
Silver is entering a critical technical moment. With the right shoulder nearly complete and resistance pressing near $80, bulls are now approaching the breakout zone that could define the next move.
Rashad Hajiyev, followed by more than 96K traders, believes the $92 level could come into play as soon as next week if silver breaks higher.
The Silver chart supports that outlook, but confirmation still depends on a decisive breakout. If silver clears $80, the path toward $92 may open quickly.
Related Articles
After 5 Years of Pain, Altcoins Just Flashed the Same Signal as 2020
Altcoin Market Cap to Revenue Ratios Reach Low Levels Amid Price Decline
Analyst: Bitcoin has entered a historically significant bottoming zone; the real test is the entry timing, not the price.