Bitcoin is back in compression mode on Feb. 17, 2026, trading at $68,021 after probing an intraday range between $67,381 and $69,999. With $36.58 billion in 24-hour volume and a $1.37 trillion market cap, this is not a sleepy tape — it is a market pausing, recalibrating, and daring traders to overreact.
Bitcoin Chart Outlook
The daily chart continues to frame the broader narrative: stabilization within a descending structure. Price remains below the prior peak near $97,900 and is oscillating between $68,000 and $70,000, reflecting balance rather than breakout conditions. Major support stands at $60,000 to $62,000, with intermediate support at $66,500 to $68,000. Overhead, $72,000 to $75,000 remains the primary resistance band, and only a decisive daily close above $75,000 would invalidate the prevailing macro structure. Until then, the bias is cautious. This is digestion, not ignition.
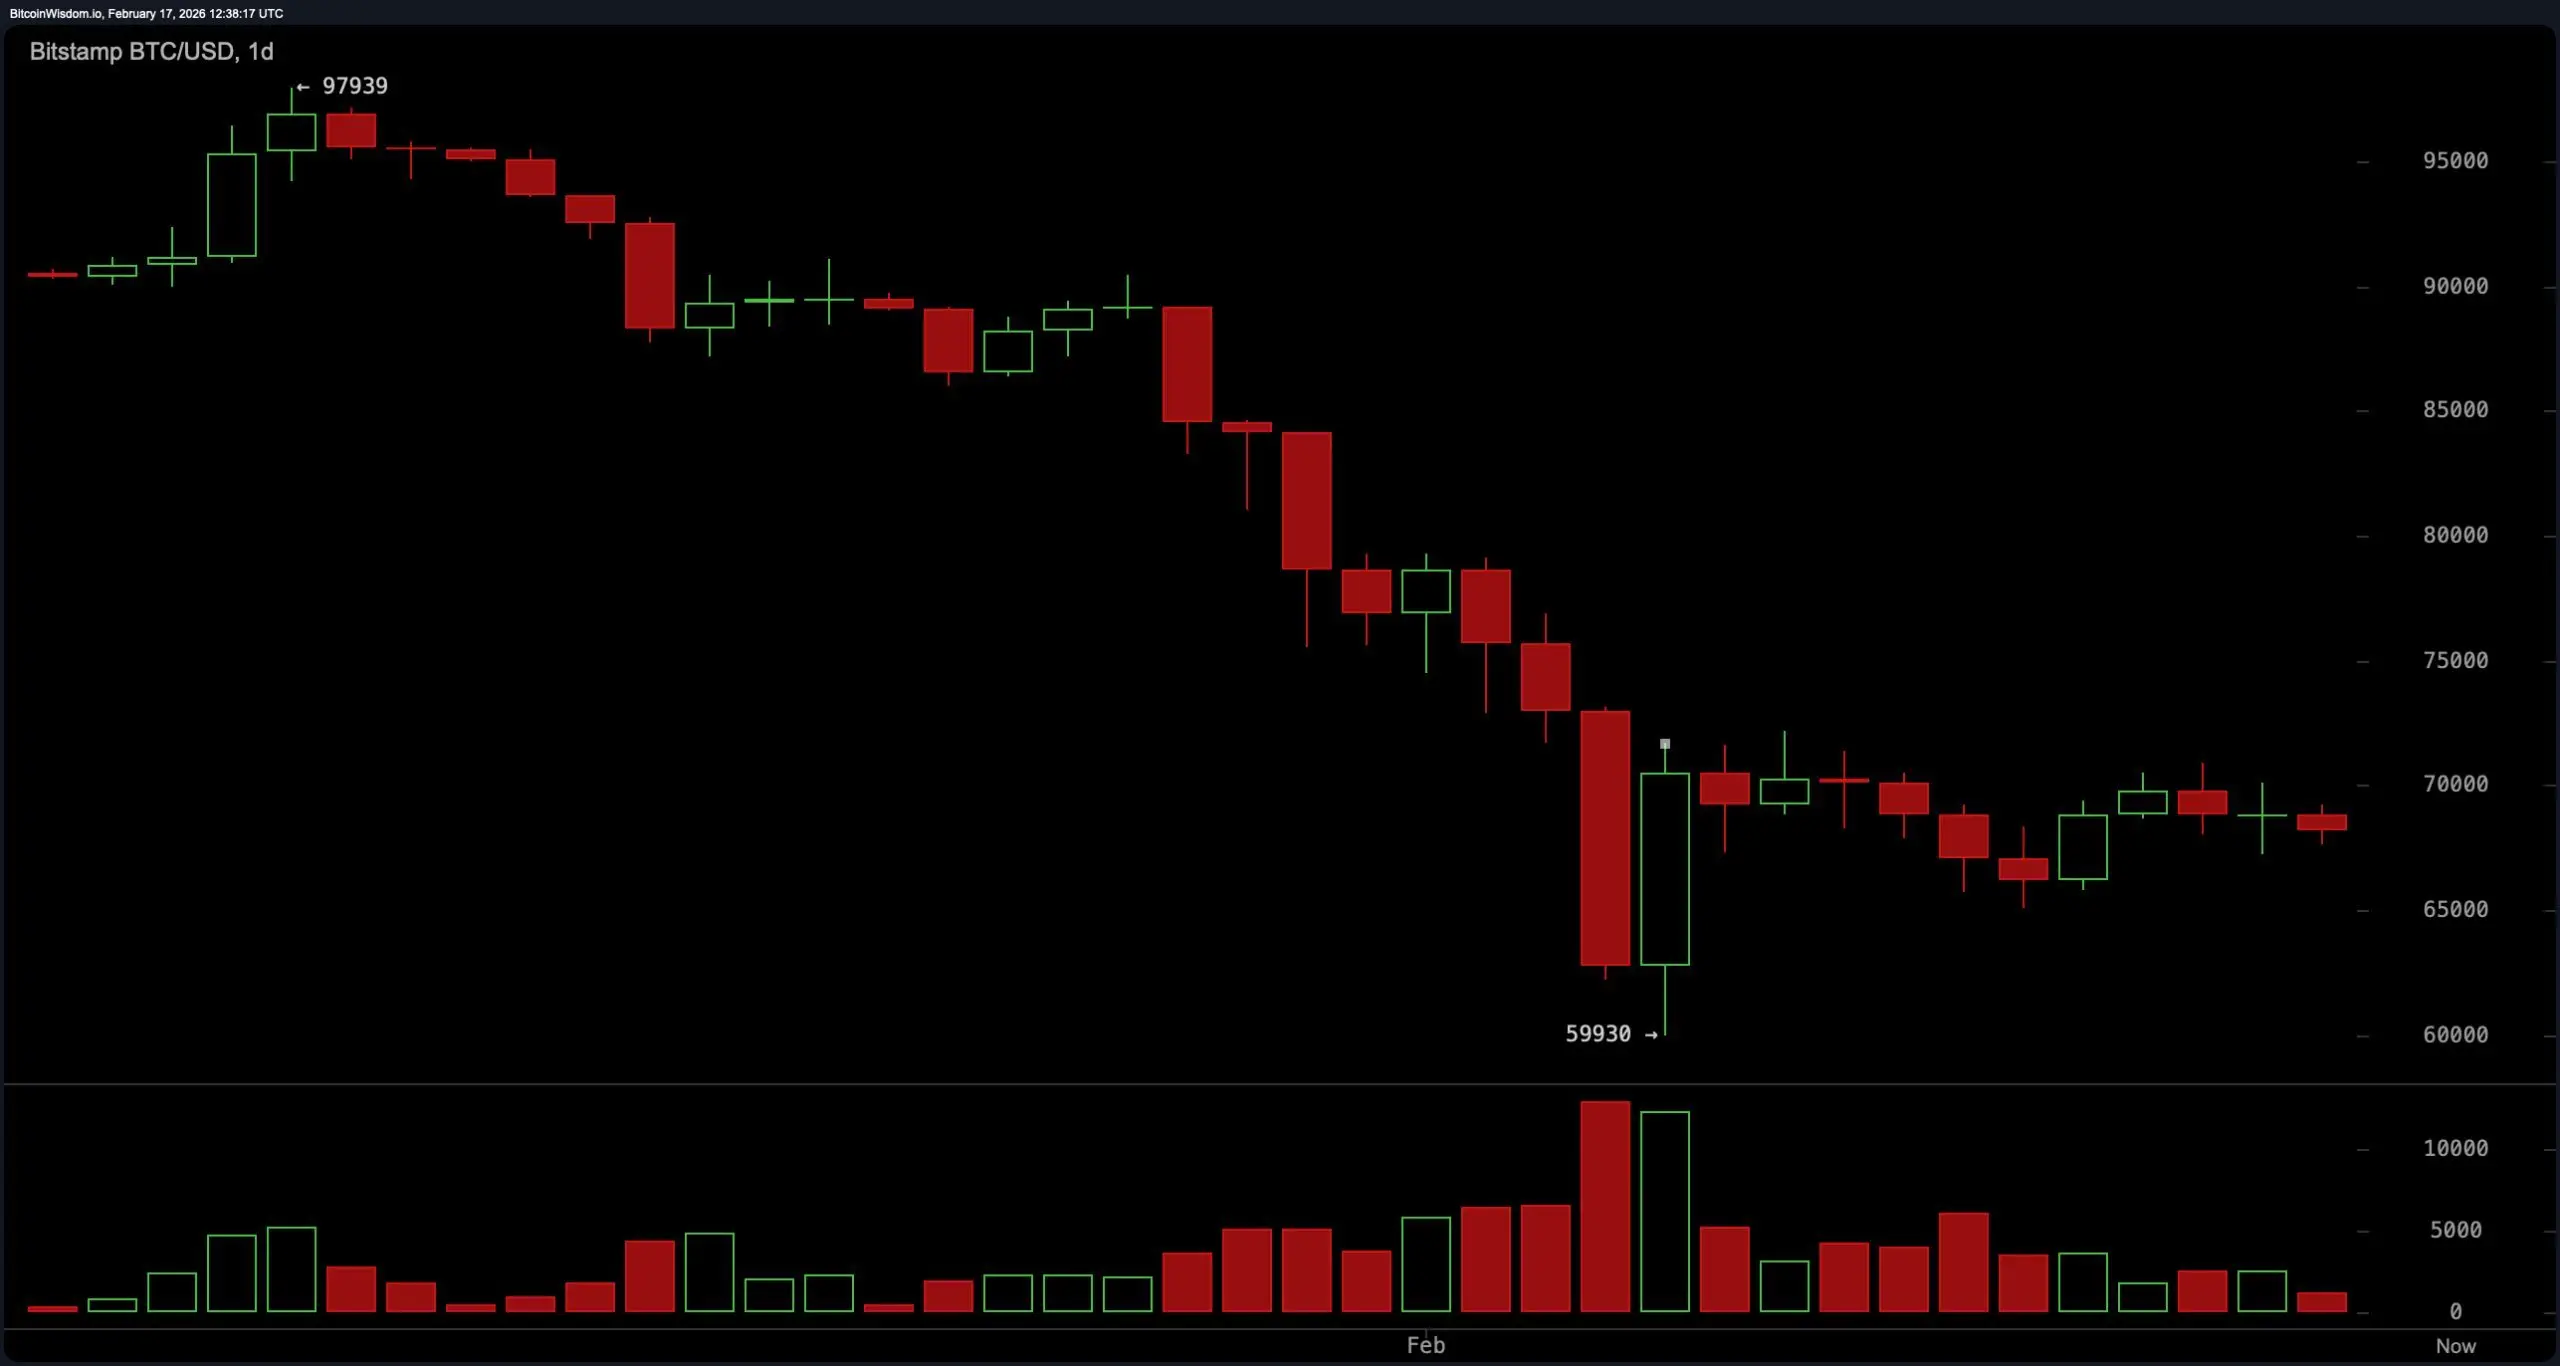 BTC/USD 1-day chart via Bitstamp on Feb. 17, 2026.
On the four-hour chart, bitcoin is fluctuating within a defined range following its vigorous recovery from the $60,000 threshold. A sequence of descending peaks is emerging, gradually compressing price action into lateral consolidation. Volume has diminished during upward attempts, signaling limited conviction behind rallies. The defined trade zones remain clear: support between $66,500 and $68,000 and resistance between $72,000 and $73,000. Mean-reversion dynamics dominate this time frame, as neither side has delivered the decisive expansion required to shift structure. In plain terms, this is a range trader’s playground — not a breakout artist’s stage.
BTC/USD 1-day chart via Bitstamp on Feb. 17, 2026.
On the four-hour chart, bitcoin is fluctuating within a defined range following its vigorous recovery from the $60,000 threshold. A sequence of descending peaks is emerging, gradually compressing price action into lateral consolidation. Volume has diminished during upward attempts, signaling limited conviction behind rallies. The defined trade zones remain clear: support between $66,500 and $68,000 and resistance between $72,000 and $73,000. Mean-reversion dynamics dominate this time frame, as neither side has delivered the decisive expansion required to shift structure. In plain terms, this is a range trader’s playground — not a breakout artist’s stage.
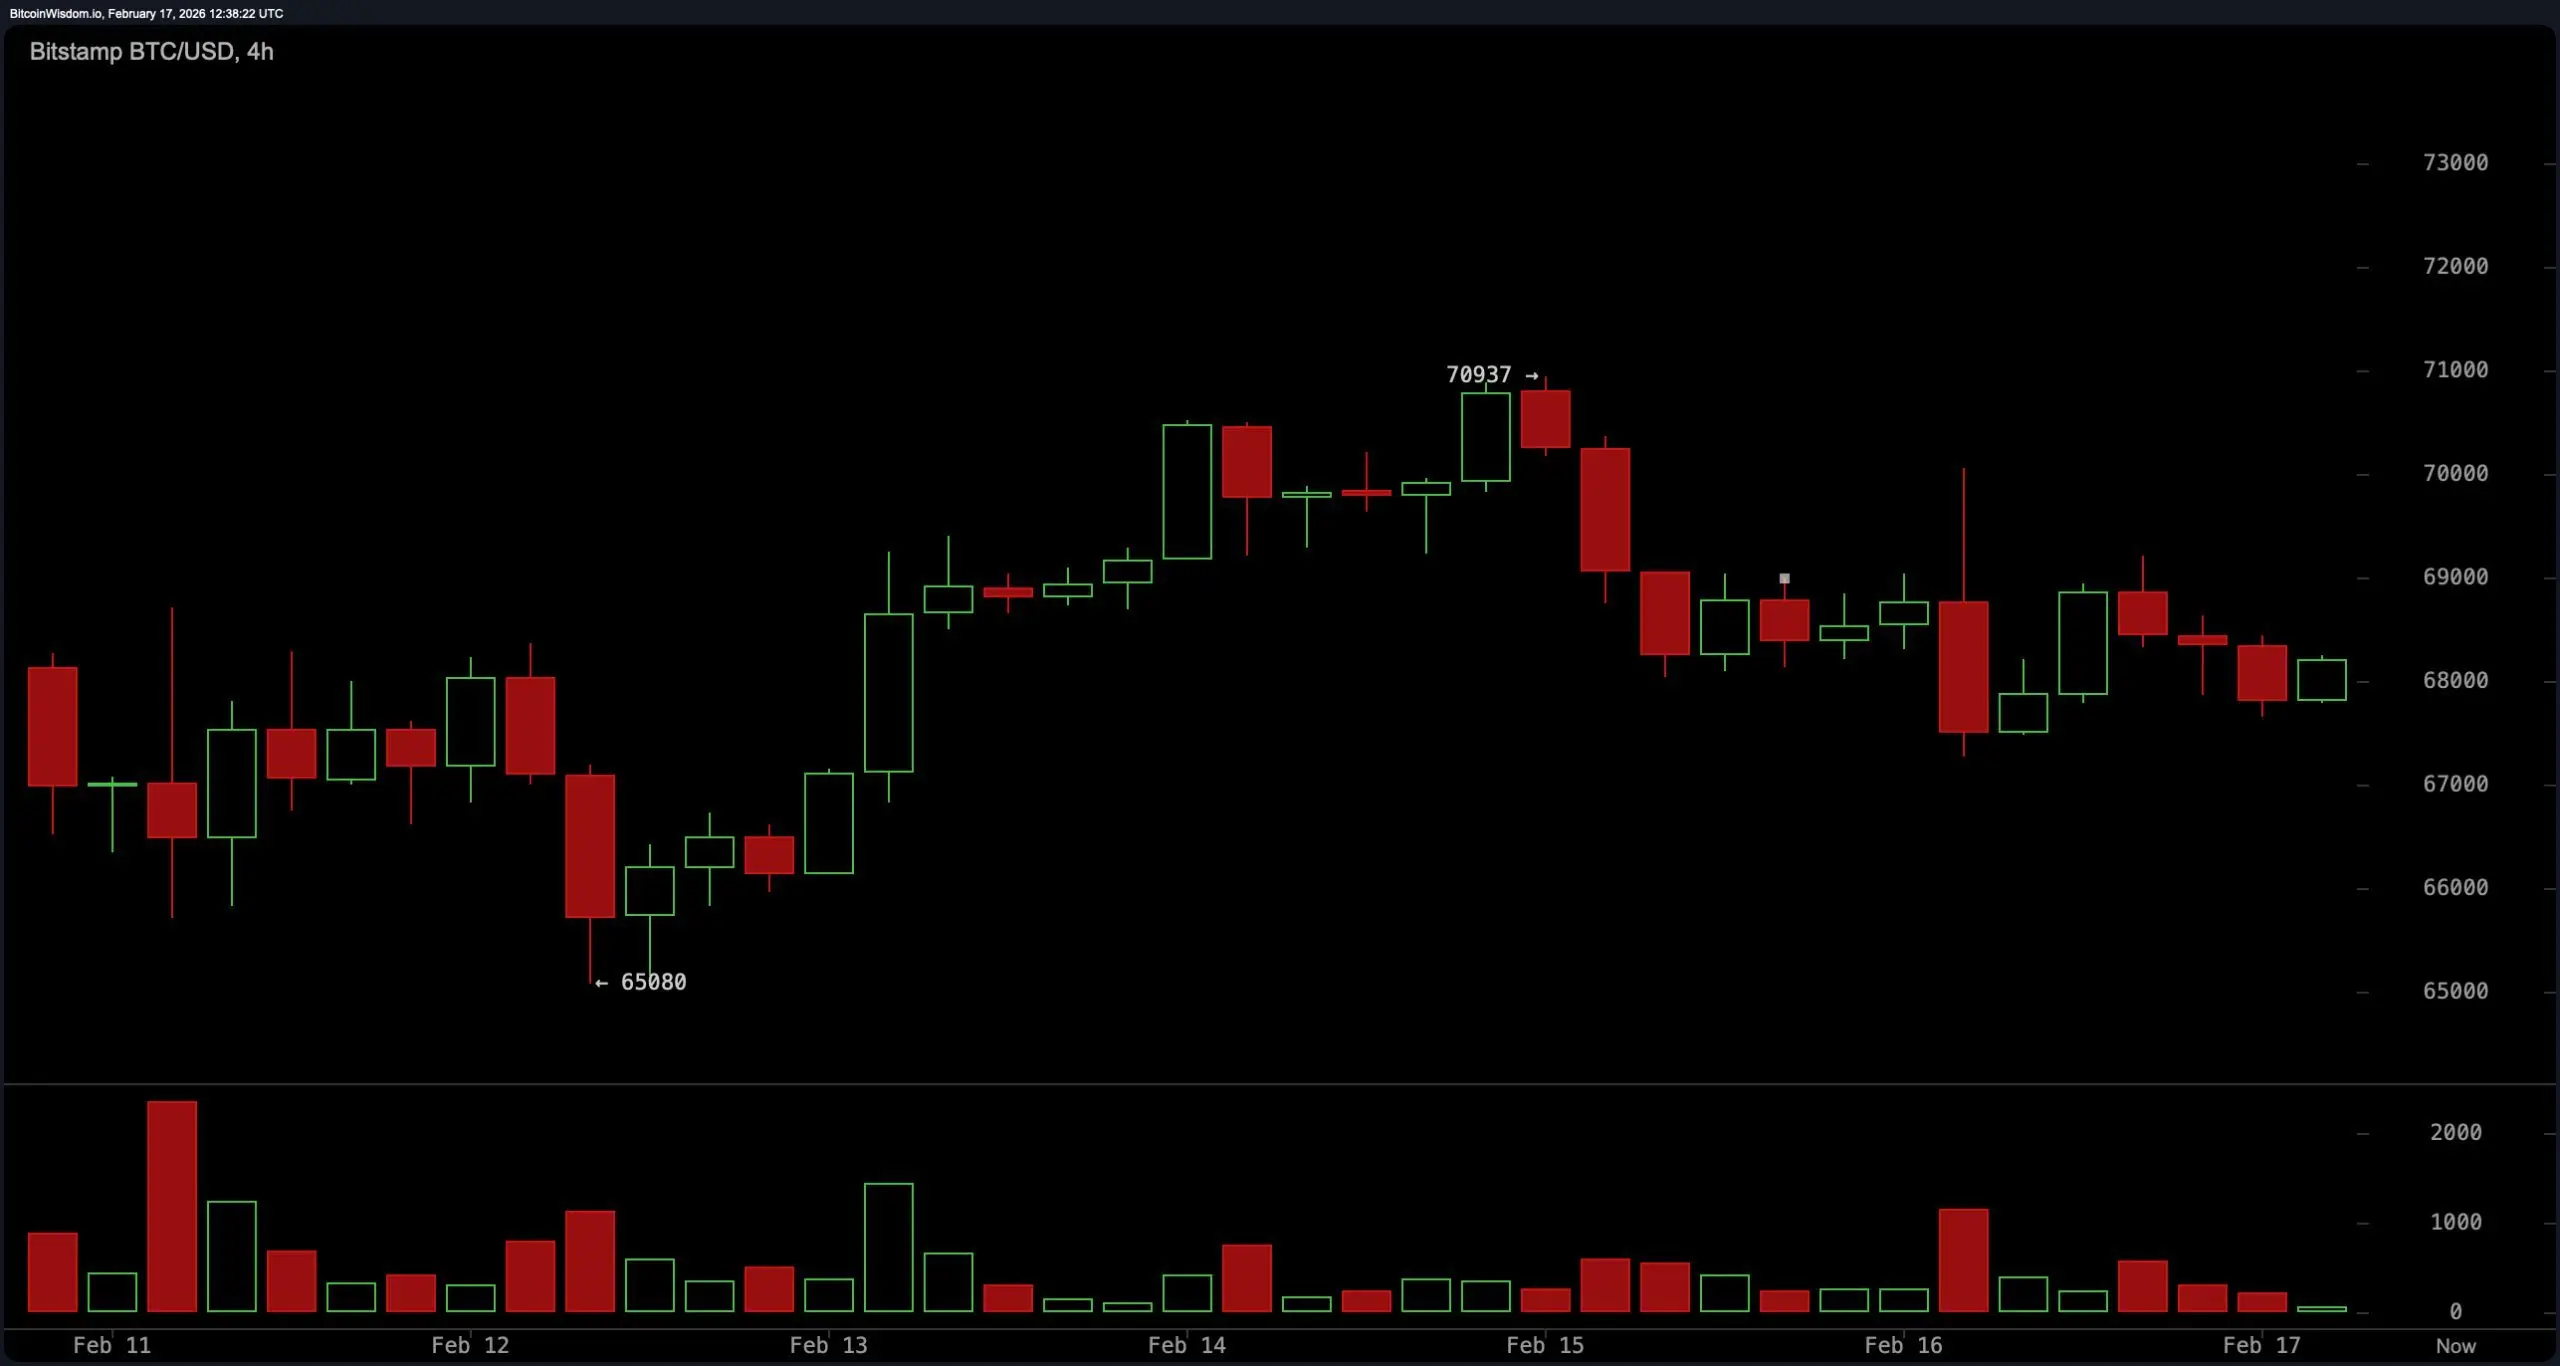 BTC/USD 4-hour chart via Bitstamp on Feb. 17, 2026.
The one-hour chart leans softer. Descending peaks and marginal new lows characterize the short-term trend, while momentum appears subdued. Recoveries have been corrective in nature rather than impulsive, reinforcing the idea that intraday strength lacks sustained follow-through. The $68,000 to $68,500 zone has functioned as a bounce area, while failed recoveries near $70,500 to $71,000 have attracted renewed pressure. Sellers maintain influence over intraday flows, and until that sequence of lower highs is disrupted, the short-term structure remains tactically fragile.
BTC/USD 4-hour chart via Bitstamp on Feb. 17, 2026.
The one-hour chart leans softer. Descending peaks and marginal new lows characterize the short-term trend, while momentum appears subdued. Recoveries have been corrective in nature rather than impulsive, reinforcing the idea that intraday strength lacks sustained follow-through. The $68,000 to $68,500 zone has functioned as a bounce area, while failed recoveries near $70,500 to $71,000 have attracted renewed pressure. Sellers maintain influence over intraday flows, and until that sequence of lower highs is disrupted, the short-term structure remains tactically fragile.
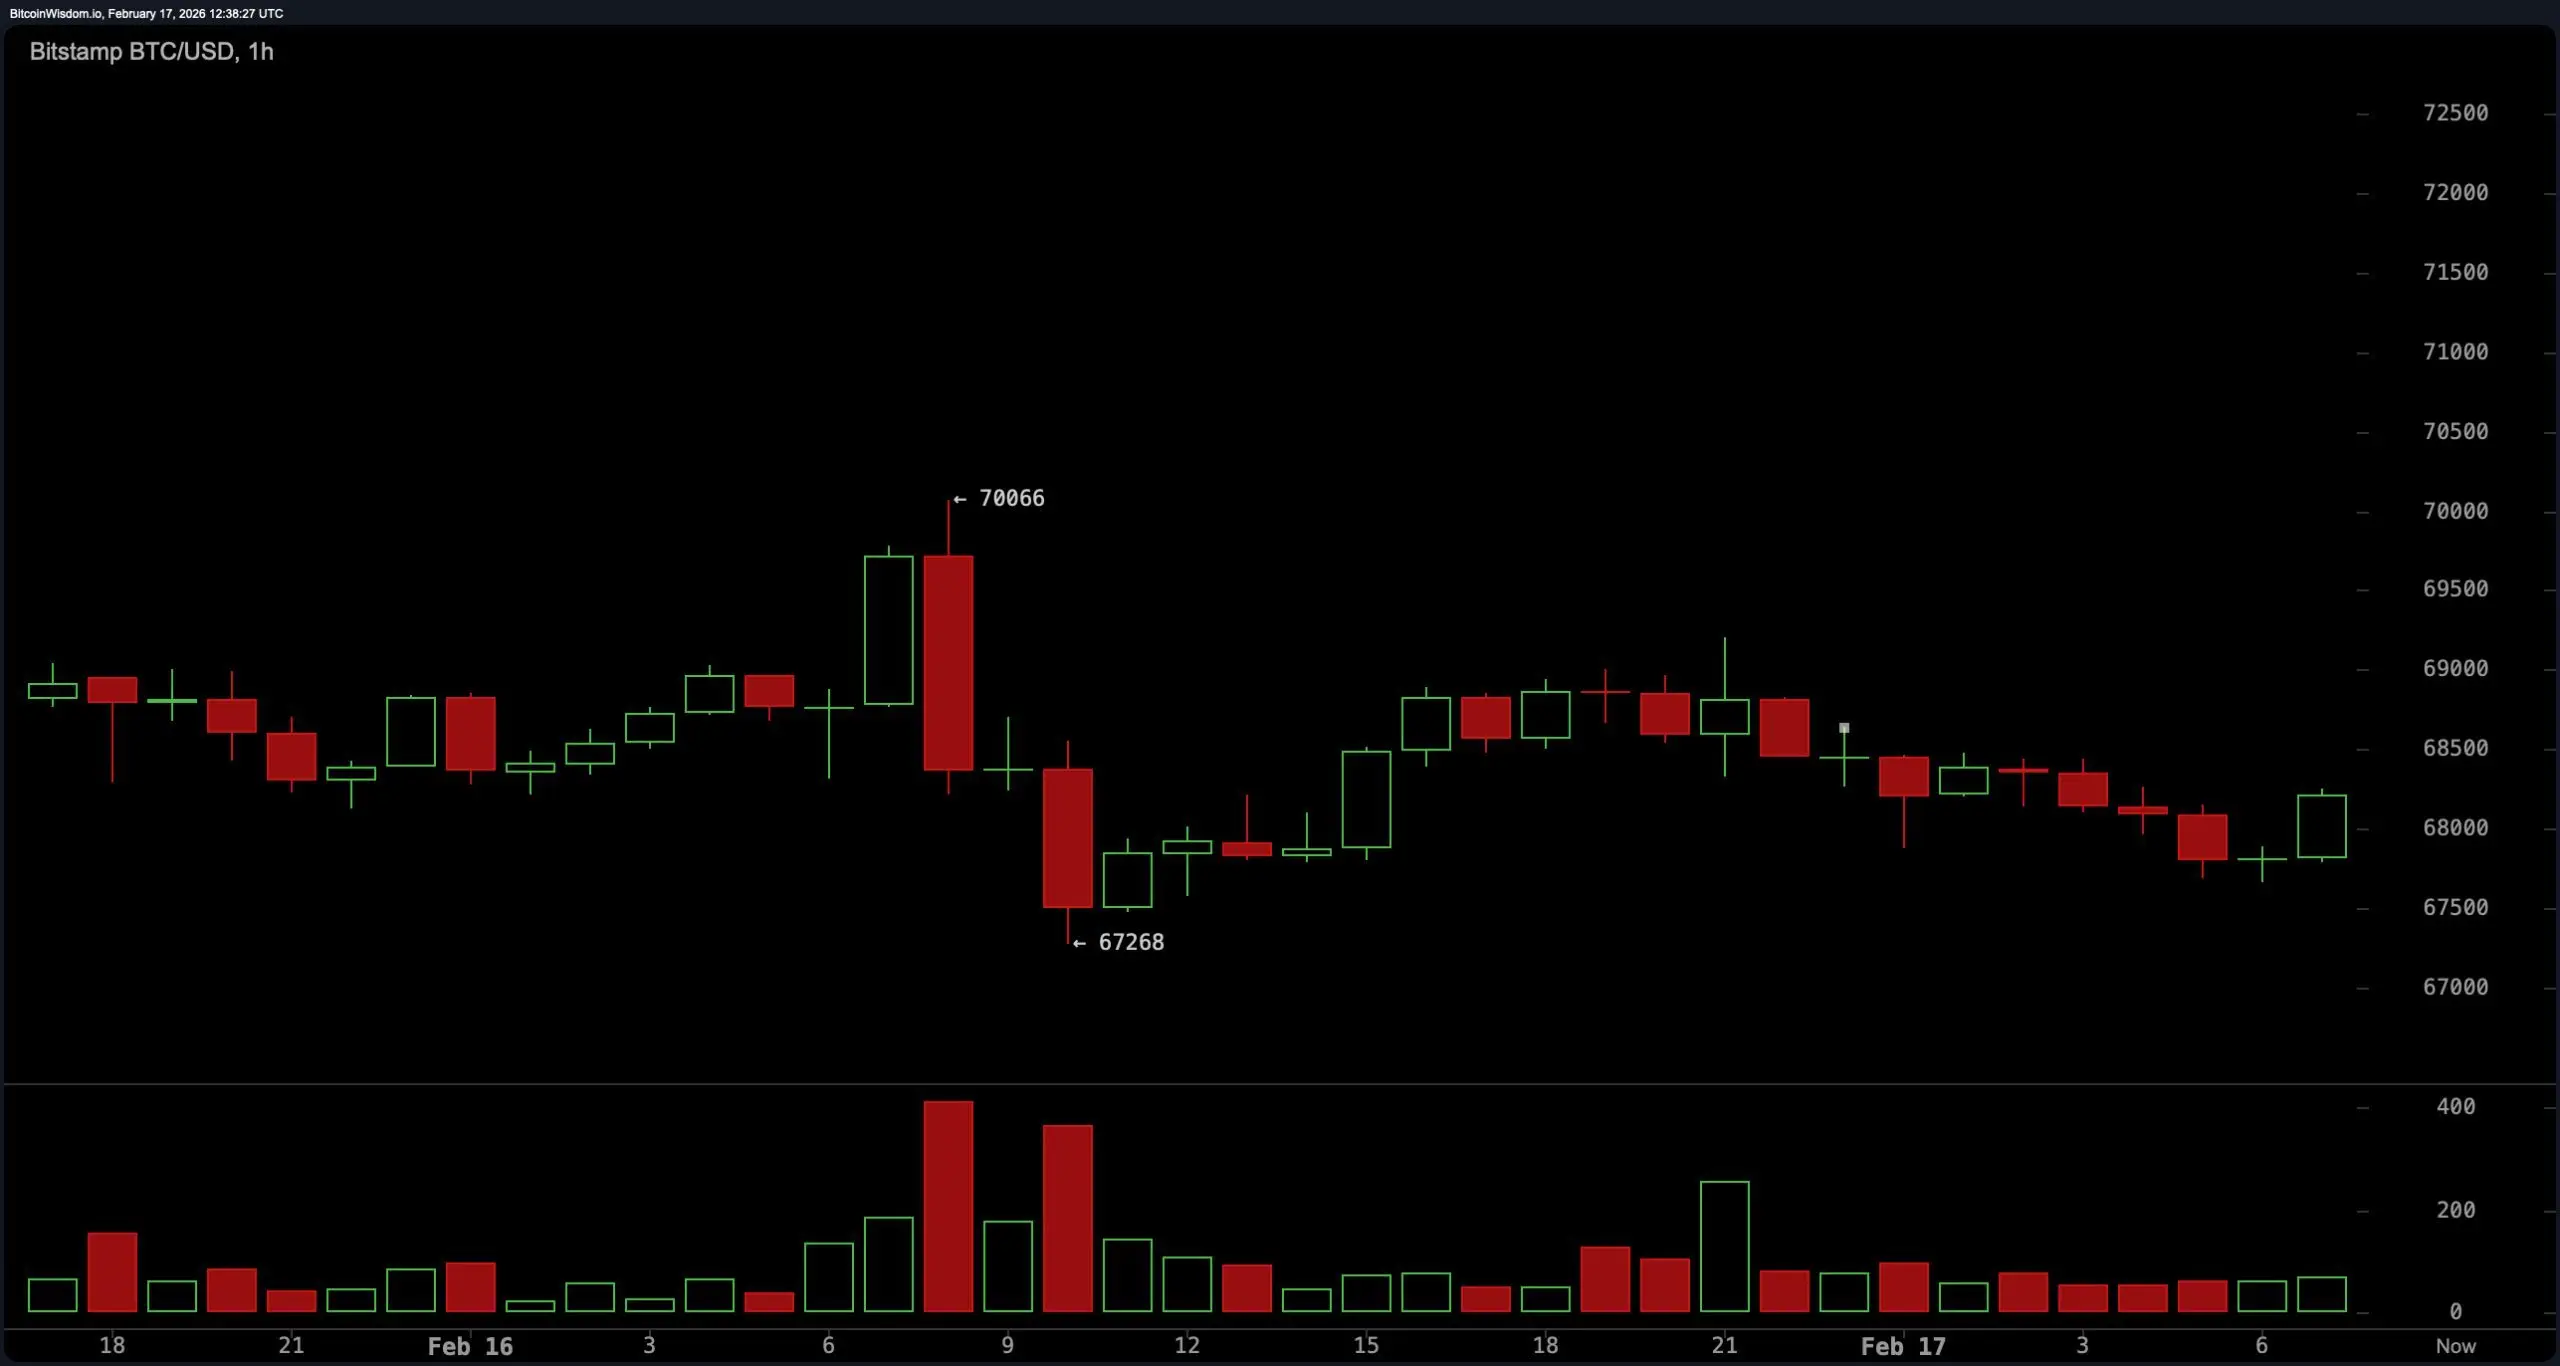 BTC/USD 1-hour chart via Bitstamp on Feb. 17, 2026.
Oscillators reflect a market in equilibrium rather than exhaustion. The relative strength index ( RSI) at 36, Stochastic at 48 and commodity channel index (CCI) at negative 47 all register neutral readings. The average directional index (ADX) at 57 signals strong trend conditions, though not necessarily directional clarity. The Awesome oscillator prints negative 11,127, while momentum at negative 453 and the moving average convergence divergence ( MACD) level at negative 4,643 show constructive signals within the report’s framework. Internally, there are flickers of stabilization — but no fireworks.
BTC/USD 1-hour chart via Bitstamp on Feb. 17, 2026.
Oscillators reflect a market in equilibrium rather than exhaustion. The relative strength index ( RSI) at 36, Stochastic at 48 and commodity channel index (CCI) at negative 47 all register neutral readings. The average directional index (ADX) at 57 signals strong trend conditions, though not necessarily directional clarity. The Awesome oscillator prints negative 11,127, while momentum at negative 453 and the moving average convergence divergence ( MACD) level at negative 4,643 show constructive signals within the report’s framework. Internally, there are flickers of stabilization — but no fireworks.
Moving averages (MAs) continue to lean heavy. The exponential moving average (EMA) (10) at $69,519 contrasts with the simple moving average (SMA) (10) at $68,739. The EMA (20) at $72,810 and SMA (20) at $72,074 reinforce near-term overhead resistance, while the EMA (50) at $80,180 and SMA (50) at $83,491 sit well above the current price. Higher still, the EMA (100) at $87,067 and SMA (100) at $86,987, along with the EMA (200) at $93,608 and SMA (200) at $100,105, underscore the broader technical gravity bitcoin must eventually overcome.
Bull Verdict:
A decisive four-hour close above $72,500 with expanding participation would shift short- and mid-term structure, opening the door toward the $72,000 to $75,000 resistance corridor and challenging the descending framework on the daily chart. Sustained strength above $75,000 would invalidate the broader bearish structure and signal that compression has resolved to the upside.
Bear Verdict:
A breach of $66,000 would confirm weakening support on the lower time frames and expose bitcoin to a move back toward the $60,000 to $62,000 major support zone. Failure to defend that corridor would reinforce the prevailing descending formation on the daily chart and extend the current corrective phase rather than conclude it.
FAQ ❓
- What is bitcoin’s price on Feb. 17, 2026? Bitcoin is trading at $68,827.93, consolidating between key support at $66,500 and resistance near $72,000.
- Is bitcoin bullish or bearish right now? Bitcoin remains range-bound within a descending structure, with cautious bias until a decisive break above $75,000 or below $66,000.
- What are the key bitcoin support and resistance levels? Major support sits at $60,000 to $62,000, while major resistance stands between $72,000 and $75,000.
- What would confirm bitcoin’s next breakout? A strong four-hour close above $72,500 or a breakdown below $66,000 would signal the next directional move.
Disclaimer: The information on this page may come from third parties and does not represent the views or opinions of Gate. The content displayed on this page is for reference only and does not constitute any financial, investment, or legal advice. Gate does not guarantee the accuracy or completeness of the information and shall not be liable for any losses arising from the use of this information. Virtual asset investments carry high risks and are subject to significant price volatility. You may lose all of your invested principal. Please fully understand the relevant risks and make prudent decisions based on your own financial situation and risk tolerance. For details, please refer to
Disclaimer.
Related Articles
The crypto market is widely declining, with BTC breaking below $68,000, while AI and Meme sectors rally against the trend with gains exceeding 3%
On March 23, the crypto market experienced widespread declines, with Bitcoin and Ethereum falling 1.42% and 1.78% respectively. The RWA sector suffered a significant drop of 4.85%, while AI and Meme sectors bucked the trend with gains of 10.36% and 3.66% respectively. Other sectors showed mixed performance, with overall market sentiment remaining weak.
GateNews12m ago
Michael Saylor Signals Continued Bitcoin Accumulation as Funding Strategy Shifts Toward STRC Preferred Stock
Strategy Executive Chairman Michael Saylor posted on March 22, 2026, that "The Orange March Continues," signaling the company's ongoing Bitcoin accumulation as total holdings reached 761,068 BTC valued at approximately $52.36 billion with an average acquisition cost of $75,696 per coin.
CryptopulseElite16m ago
BTC rises 0.61% in 15 minutes: Whale fund inflows superimposed with futures premium resonance driving
Between 2026-03-23 02:15 and 2026-03-23 02:30 (UTC), BTC yield recorded +0.61%, with prices fluctuating between 67807.1 and 68304.9 USDT, representing a volatility of 0.73%. During this short-term volatility period, market trading activity was robust, with enhanced linkage between spot and futures markets, and sustained volume increase in core trading zones, attracting market attention.
The primary driver of this volatility was significant capital inflow from on-chain whale wallets to exchanges during the window period, with approximately 17,184 BTC flowing in within a short timeframe, marking a new monthly high. M
GateNews21m ago
Bitcoin Falls Below $69,000, Derivatives Market Shifts to Defense, Downside Risks Intensify
10x Research analysis points out that Bitcoin has broken below $69,000, marking a shift in market structure. Traders have significantly adjusted positions, with increased futures liquidations and negative funding rates. Options capital flows are moving toward downside protection, signaling hedging demand against downside risks. Meanwhile, market expectations regarding rate increases are diverging from the Federal Reserve's rate-cutting guidance, which could impact risk asset performance.
GateNews22m ago
NYSE Lifts Crypto Options Cap Across 11 BTC and ETH ETFs
Two NYSE-affiliated venues have scrapped the 25,000-contract cap on options tied to 11 crypto ETF options, a move the exchanges filed with the Federal Register on March 10. The Securities and Exchange Commission acknowledged the rule alterations on Sunday by waiving the standard 30-day waiting
CryptoBreaking1h ago
NYSE Exchanges Remove 25,000-Contract Options Cap on 11 Bitcoin and Ether ETFs
NYSE Arca and NYSE American have removed the 25,000-contract position and exercise limits on options tied to 11 spot Bitcoin and Ether exchange-traded funds (ETFs), with the rule changes filed on March 10, 2026, becoming immediately effective after the Securities and Exchange Commission (SEC) waived the standard 30-day waiting period.
CryptopulseElite1h ago
