Top 3 altcoins with notable trends today - February 10
World Liberty Financial (WLFI), MemeCore (M), and Quant (QNT) have become the most prominent names in the past 24 hours as they lead the cryptocurrency market recovery, amid the overall market gradually regaining balance after last week’s sharp correction. However, the technical outlook for the altcoin group remains uncertain, as selling pressure has not been fully alleviated and investor sentiment remains cautious, easily swayed by new volatility.
World Liberty Financial Experiences Short-Term Recovery
As of Tuesday, World Liberty Financial (WLFI) has gained over 2%, following a 4% rebound on Monday. This marks the third consecutive day of gains, helping WLFI partially recover after a four-day sharp decline that saw its price lose nearly 25% of its value.
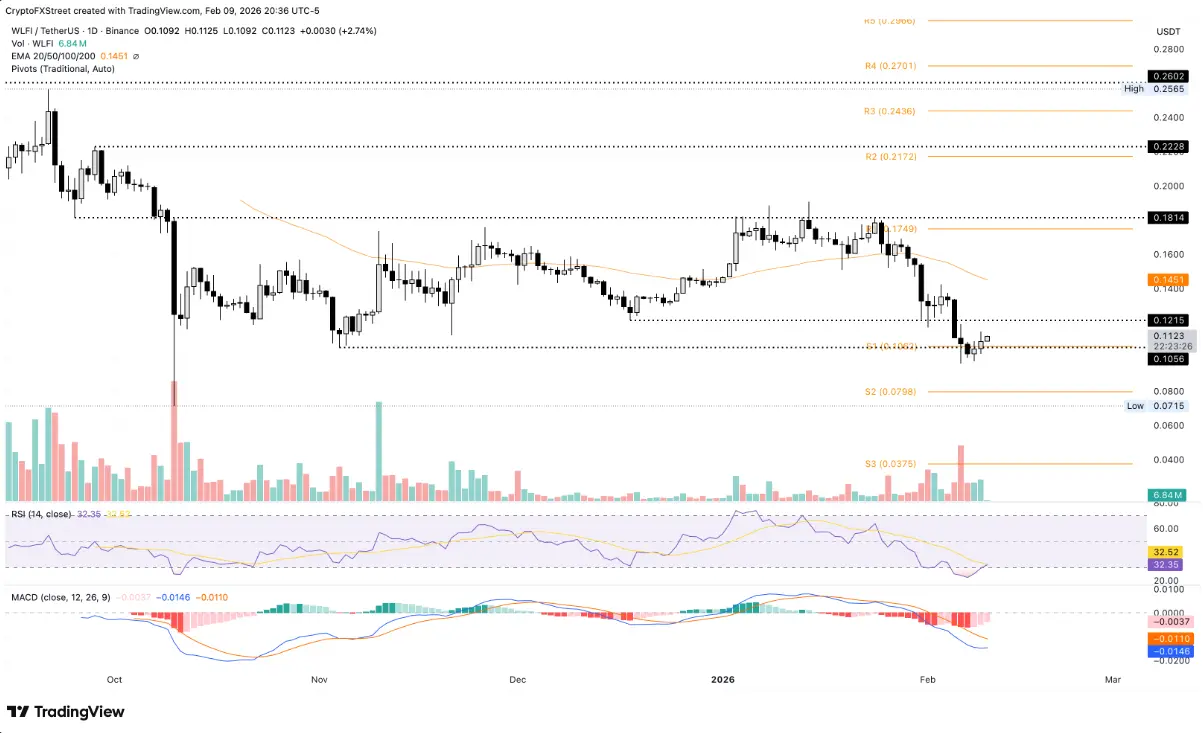 Daily WLFI/USDT Chart | Source: TradingView On the daily chart, technical signals indicate that selling pressure is gradually weakening. The MACD indicator lines remain below zero but have shifted to a sideways trend, with the histogram narrowing significantly—suggesting the downward momentum is slowing. Meanwhile, the RSI has risen to 32, moving out of the oversold zone, although the downtrend still dominates.
In a positive scenario, if the recovery continues, WLFI could target the 0.1215 USD level, corresponding to the bottom set on December 18. Conversely, if selling pressure returns and the price breaks below the psychological 0.10 USD level, WLFI is likely to revisit the October 10 bottom around 0.0715 USD.
MemeCore Rises After Weekend Drop
MemeCore increased nearly 4% on Tuesday, following a 7% rebound on Monday, signaling a positive start to the new trading week. This movement comes after a sharp 28% drop on Sunday, which had previously caused market sentiment to turn cautious.
However, this meme coin is still trading below the 200-day exponential moving average (EMA)—a technical level that could continue to limit short-term gains. In a positive scenario, if the price can close above the 200 EMA, MemeCore may aim for the next target at the 50-day EMA, around 1.56 USD.
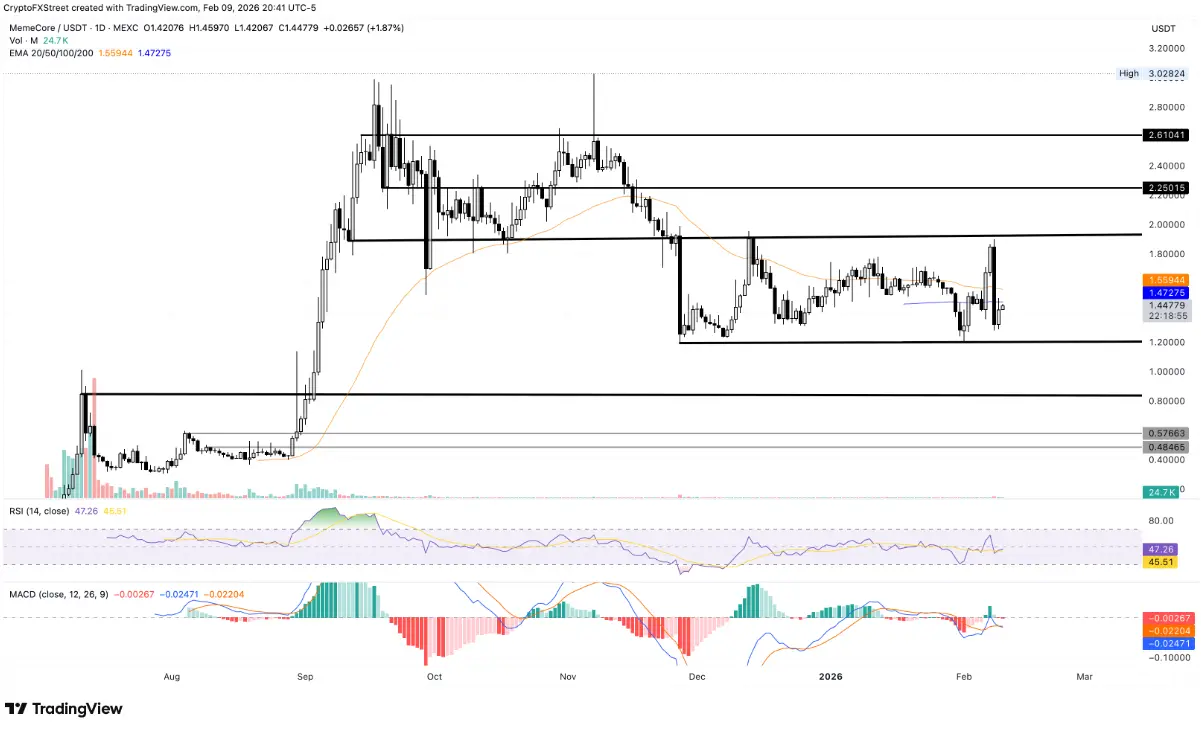 Daily M/USDT Chart | Source: TradingView On the daily chart, technical indicators remain neutral. The RSI hovers around 48, reflecting a tug-of-war between buyers and sellers, while the MACD and signal lines are gradually converging. Conversely, the support zone at 1.19 USD—coinciding with the February 1 bottom—is considered a key level to watch.
Quant Recovers as Selling Pressure Weakens
As of Tuesday, Quant (QNT) is trading around 70 USD, maintaining a roughly 6% increase from the previous session. However, the short- to medium-term trend structure has not yet improved significantly, as the price remains below the 50-day EMA at 73.90 USD, and this EMA is considerably lower than the 200-day EMA at 84.62 USD—indicating that the bears still hold market control.
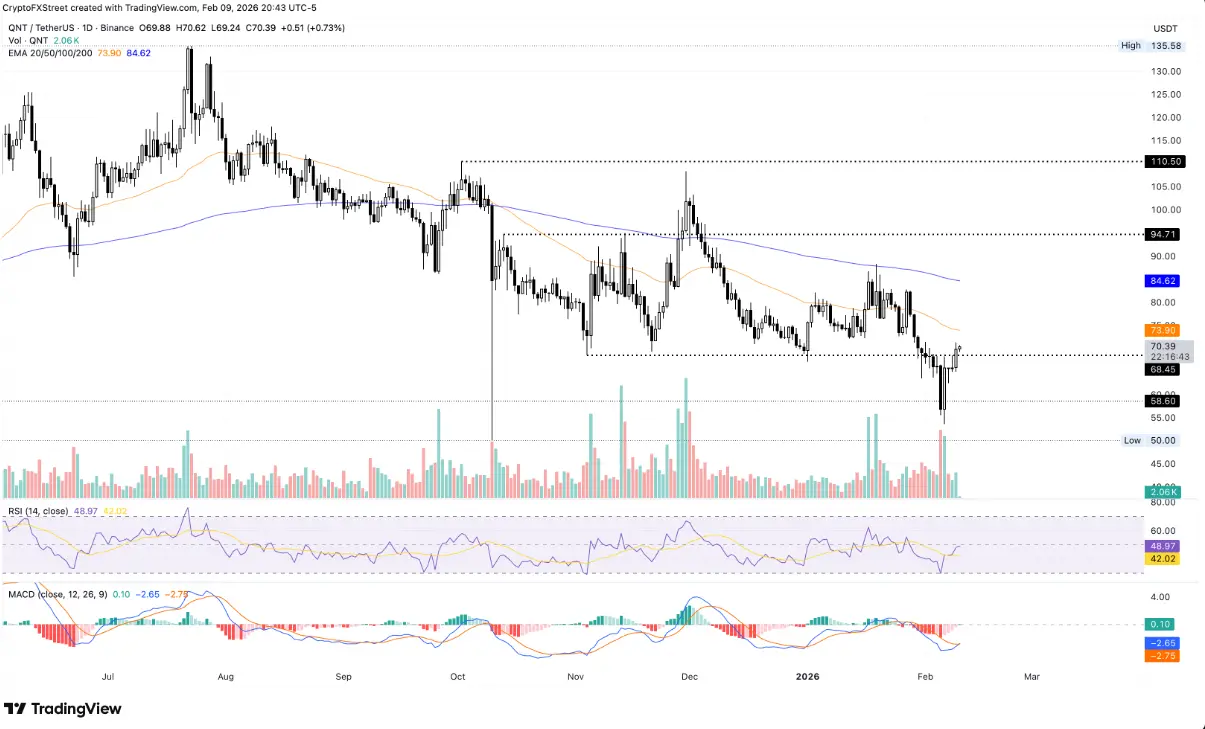 Daily QNT/USDT Chart | Source: TradingView In a positive scenario, if QNT can break through and close steadily above the 50-day EMA, the price is likely to target the 200-day EMA, opening more room for recovery. The initial bullish momentum is emerging as selling pressure diminishes, evidenced by the RSI recovering to 48 after leaving the oversold zone. At the same time, the MACD line continues to narrow the gap with the signal line, increasing the likelihood of a bullish crossover in the short term.
Conversely, if QNT loses the critical support level around the November 4 bottom near 68.45 USD, the downward move could resume, pushing the price further down toward the psychological 60 USD support zone.
SN_Nour