
Key Takeaways
-
Algorand (ALGO) is consolidating after a 13% decline over the past 60 days, while showing stabilization in the last month.
-
The daily chart reveals a repeating bullish fractal, similar to the setup that triggered ALGO’s 300% rally in November 2024.
-
Price is holding inside a long-term accumulation zone between $0.11 and $0.1530.
-
The 200-day moving average near $0.1912 is acting as key resistance and breakout confirmation level.
-
A successful reclaim of the 200 MA could open the path toward $0.60 and the ascending resistance trendline, while a drop below $0.11 would invalidate the bullish setup.
ALGO, the native token of Algorand’s Layer-1 blockchain, has shown steady but muted momentum over the past 30 days, helping slow down its broader correction. Despite this stabilization, ALGO remains down more than 13% over the last 60 days, keeping sentiment cautious across the market.
That said, when looking beyond short-term price noise, the daily chart is beginning to tell a familiar story. The current structure closely resembles a bullish fractal that, in the past, preceded a powerful breakout rally—raising an important question for traders: is this just consolidation, or a quiet accumulation phase before the next move?
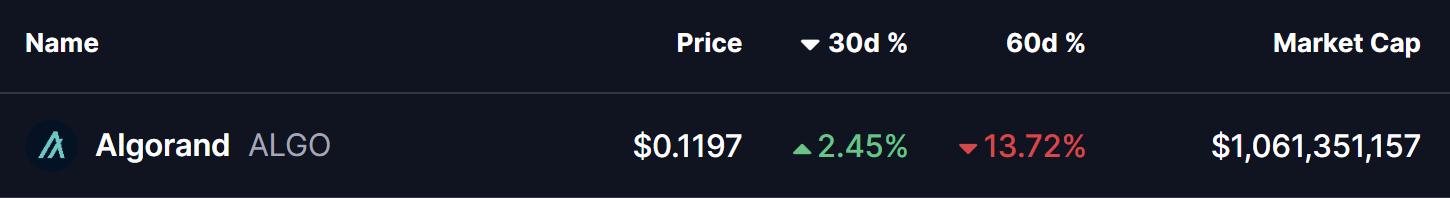
Source: Coinmarketcap
Fractal Setup Hints at a Bullish Reversal
On the daily timeframe, ALGO is displaying early signs of a repeating bullish structure, built around three key technical elements:
-
A rejection from the long-term ascending resistance trendline
-
A prolonged accumulation zone at major historical support
-
A potential reclaim of the 200-day moving average
The current corrective phase began in December 2024, when ALGO was rejected near the ascending resistance trendline around $0.60. That rejection triggered a deep pullback of more than 80%, eventually driving price back into the long-term demand zone between $0.11 and $0.1530—a region that has repeatedly acted as an accumulation area on the chart.
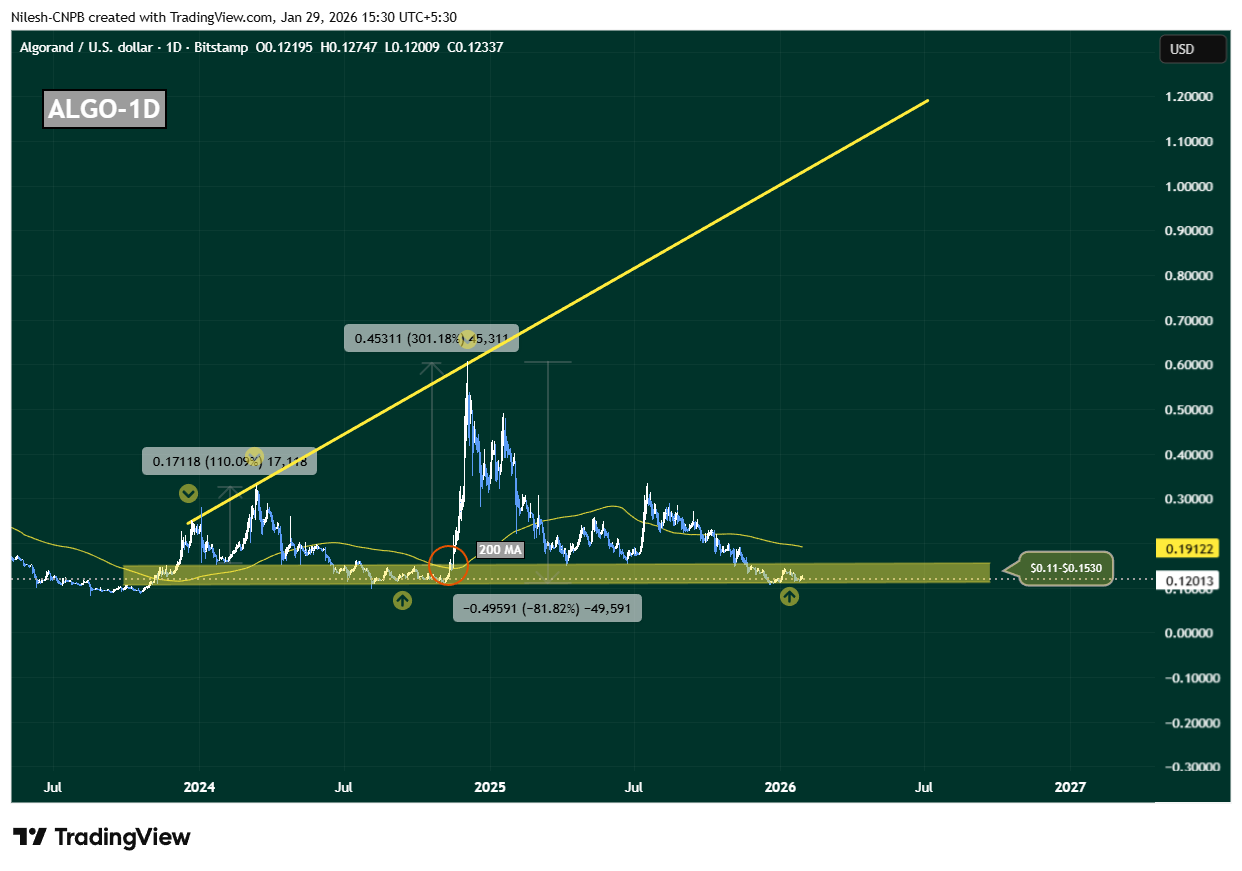
Algorand (ALGO) Daily Chart/Coinsprobe (Source: Tradingview)
This zone is not just technically important; it has also served as a launchpad during previous cycles, where downside momentum stalled and long-term buyers quietly stepped in.
History Rhymes on the ALGO Chart
What makes this setup particularly compelling is how closely it mirrors November 2024’s breakout structure. Back then, ALGO spent extended time consolidating near the same support band before reclaiming the 200-day moving average. Once that level flipped into support, price accelerated sharply—resulting in a 300% rally toward the ascending resistance trendline.
Today, ALGO is once again compressing inside this accumulation range, while the 200-day moving average sits overhead near $0.1912, acting as dynamic resistance. This alignment suggests the market may be approaching another inflection point.
What’s Next for ALGO?
At present, ALGO is hovering near $0.12, firmly inside its long-term accumulation zone. As long as price holds above this region, the broader bullish fractal remains intact.
A clean and sustained reclaim of the 200-day moving average around $0.1912 would be a critical confirmation signal. If bulls manage to flip this level into support, it would closely replicate previous breakout conditions and could trigger a sharp upside expansion. In that scenario, $0.60 becomes a realistic medium-term target, with further upside possible toward the ascending resistance trendline if momentum builds.
However, the structure is not without risk. A decisive breakdown below $0.11 would weaken the accumulation thesis, signal loss of long-term support, and open the door for deeper downside.
For now, ALGO sits at a make-or-break zone. The chart suggests patience is key—but if history repeats, this quiet phase may not last much longer.
Disclaimer: The views and analysis presented in this article are for informational purposes only and reflect the author’s perspective, not financial advice. Technical patterns and indicators discussed are subject to market volatility and may or may not yield the anticipated results. Investors are advised to exercise caution, conduct independent research, and make decisions aligned with their individual risk tolerance.
About Author: Nilesh Hembade is the Founder and Lead Author of Coinsprobe, with over 5 years of experience in the cryptocurrency and blockchain industry. Since launching Coinsprobe in 2023, he has been providing daily, research-driven insights through in-depth market analysis, on-chain data, and technical research.
Disclaimer: The information on this page may come from third parties and does not represent the views or opinions of Gate. The content displayed on this page is for reference only and does not constitute any financial, investment, or legal advice. Gate does not guarantee the accuracy or completeness of the information and shall not be liable for any losses arising from the use of this information. Virtual asset investments carry high risks and are subject to significant price volatility. You may lose all of your invested principal. Please fully understand the relevant risks and make prudent decisions based on your own financial situation and risk tolerance. For details, please refer to
Disclaimer.
Related Articles
Dogecoin Price Pressures Mount as $0.08 Support Nears Break
Dogecoin is experiencing sustained bearish momentum, with price action forming lower highs and lows, especially around the critical $0.08 support level. A breach below this level may lead to increased selling pressure, while a recovery could trigger short-term relief. Current trading shows weak buying efforts and a lack of bullish momentum.
CryptoFrontNews14m ago
Aster Price Nears $0.79 Breakout as Reversal Pattern Strengthens
Key Insights
Aster price structure shows an inverse head and shoulders pattern forming beneath $0.79 resistance, signaling growing buying pressure and possible trend reversal ahead.
Repeated tests of the $0.79 neckline suggest weakening selling pressure as buyers steadily absorb supply near r
CryptoFrontNews18m ago
Analyst: Short-term Bitcoin holders tend to take profits, transferring over 27,000 BTC to exchanges in the past 24 hours.
CryptoQuant analysts point out that despite a slight rebound in Bitcoin, short-term holders still tend to take quick profits, with over 27,000 BTC recently transferred to trading platforms, indicating a selling pressure signal. Current macroeconomic outlook is somewhat negative, and short-term holders lack confidence in long-term investments.
GateNews50m ago
Matrixport: Low retail participation, lack of new narratives, and token unlock sell-offs putting pressure on altcoins
Matrixport report indicates that meme coins underperformed expectations over the past year, mainly due to low retail participation, lack of new narratives and real-world application projects, as well as ongoing token unlock pressures, which hindered market rebounds. Despite overall pressure, some localized opportunities can still be identified.
GateNews1h ago
10x Research: Institutional Capital Reshapes the Crypto Stock Market, Structural Changes in the Mining Company Sector
10x Research reports that institutional capital flows and corporate asset adjustments are reshaping the crypto stock market landscape, with some crypto stocks rising and others being marginalized. Bitdeer Technologies' stock price has recently fluctuated due to capital structure adjustments and the clearing of Bitcoin reserves, driving a transition toward high-performance computing and AI infrastructure. Overall, the market sees significant rebounds in the stock prices of Circle and a certain CEX.
GateNews1h ago
Glassnode: Bitcoin spot ETF capital outflows stabilize, 14-day net flow turns upward
Gate News Announcement: On March 6, Glassnode posted an analysis on the X platform stating that the outflow trend of Bitcoin spot ETF funds has stabilized, and the 14-day net flow trend has turned upward, indicating that as Bitcoin breaks above $70,000, selling pressure is easing. Glassnode pointed out that institutional demand remains in a tentative stage, but early signs of reaccumulation are beginning to appear.
GateNews2h ago