Price Prediction for MemeCore – A New Resistance Level for Traders!
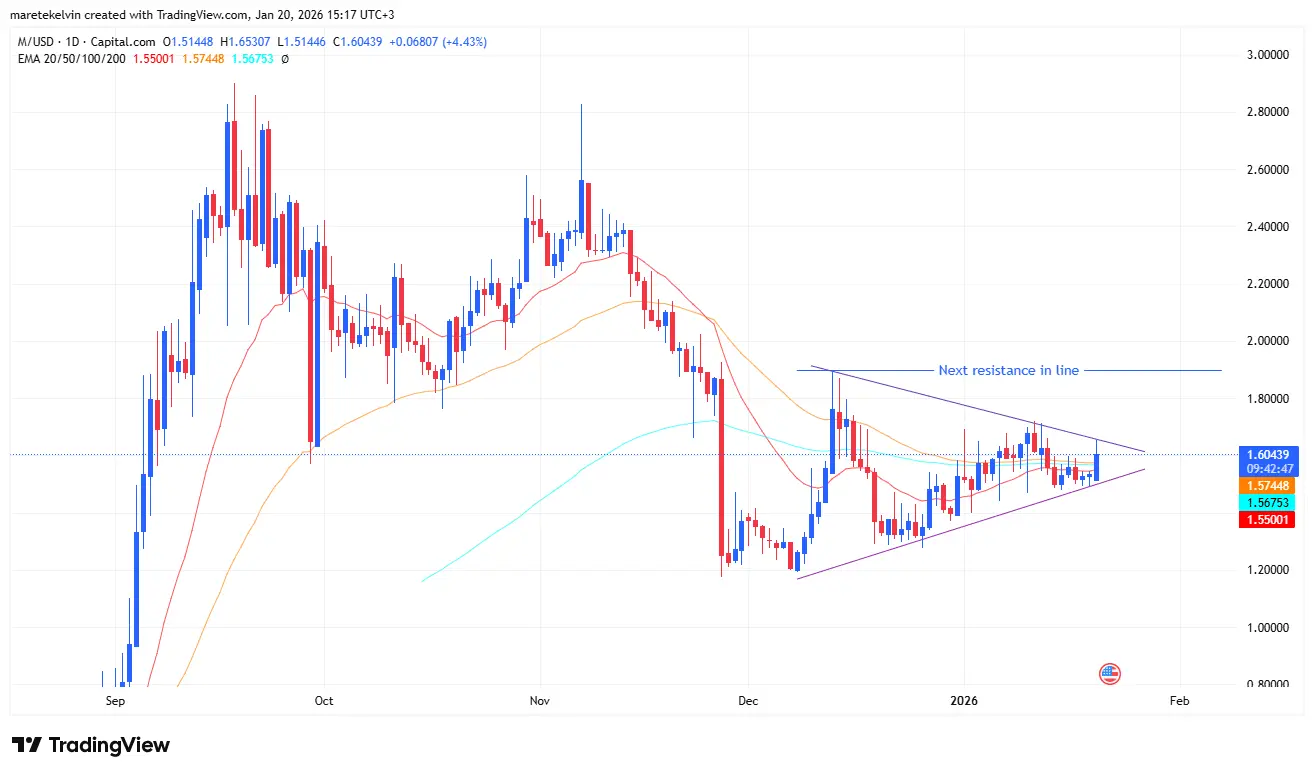
In recent trading sessions, MemeCore (M) attracted attention as the price surged by 8% in a single day after breaking out from a critical technical support convergence zone around the $1.5 mark.
This move occurred after the price successfully reversed from the convergence area between the upward trendline and the support of the key Exponential Moving Average (EMA). This strong retest marked a clear shift in short-term momentum, especially after a week of consolidation within a narrow range.
In recent sessions, M has mainly traded within a limited price zone, continuously testing structural support levels. In fact, since late December, M’s price has maintained a consolidation pattern known as a “pennant” (pennant), reflecting market hesitation.
However, at present, the consolidation process seems to be gradually concluding on the daily chart. The latest rebound has helped buyers regain control, bringing the price closer to the next important technical zone – most likely the resistance at $1.90.
 Source: TradingView## $1.90: The Next Critical Challenge
After breaking through the support convergence zone, the $1.90 resistance has become the market’s next focal point. This area could see selling pressure return, posing a challenge to the current upward momentum.
The continuous approach of M to this zone has attracted particular attention from traders, as the price reaction here could shape the short-term trend.
While the bullish momentum remains intact, investors are closely monitoring how M reacts at this resistance zone to make appropriate decisions.
Futures trading volume surges, reflecting strong interest
According to data from Coinglass, M’s daily futures trading volume increased by $2.4 million, reaching $36.63 million. This indicates growing participation from traders and reflects short-term interest in price volatility.
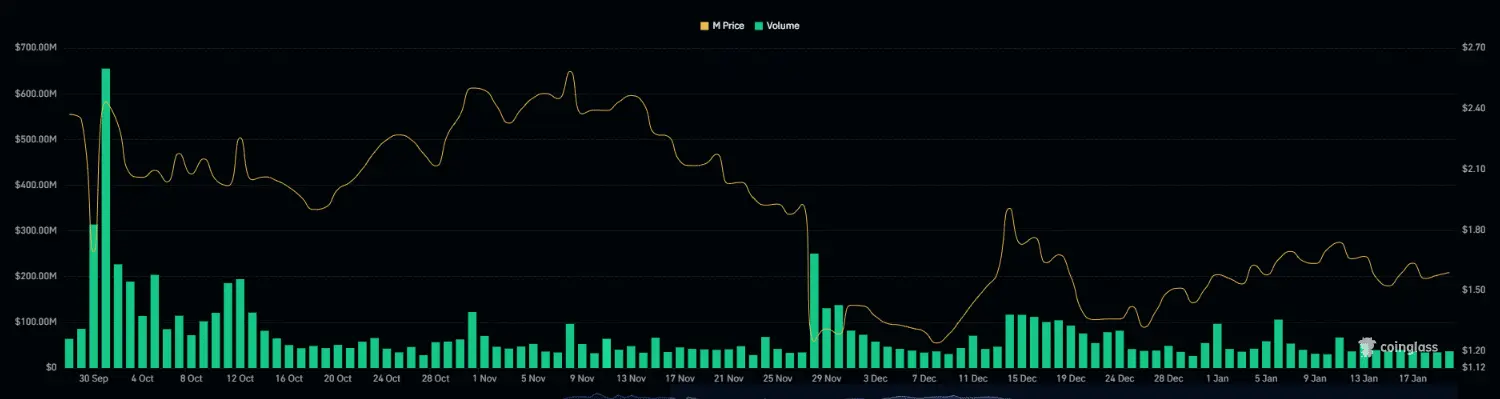 Source: Coinglass Higher trading volumes often lead to greater volatility, which could further propel a breakout if buyers continue to hold the advantage.
On-chain data issues warning signals
Although the price trend is leaning bullish, on-chain data shows signs of caution. Specifically, M’s deviation index of the price correction (DAA) is currently at -82%.
This figure reflects the discrepancy between the current price volatility and the token’s actual market value – a factor often considered a warning signal during strong price rallies.
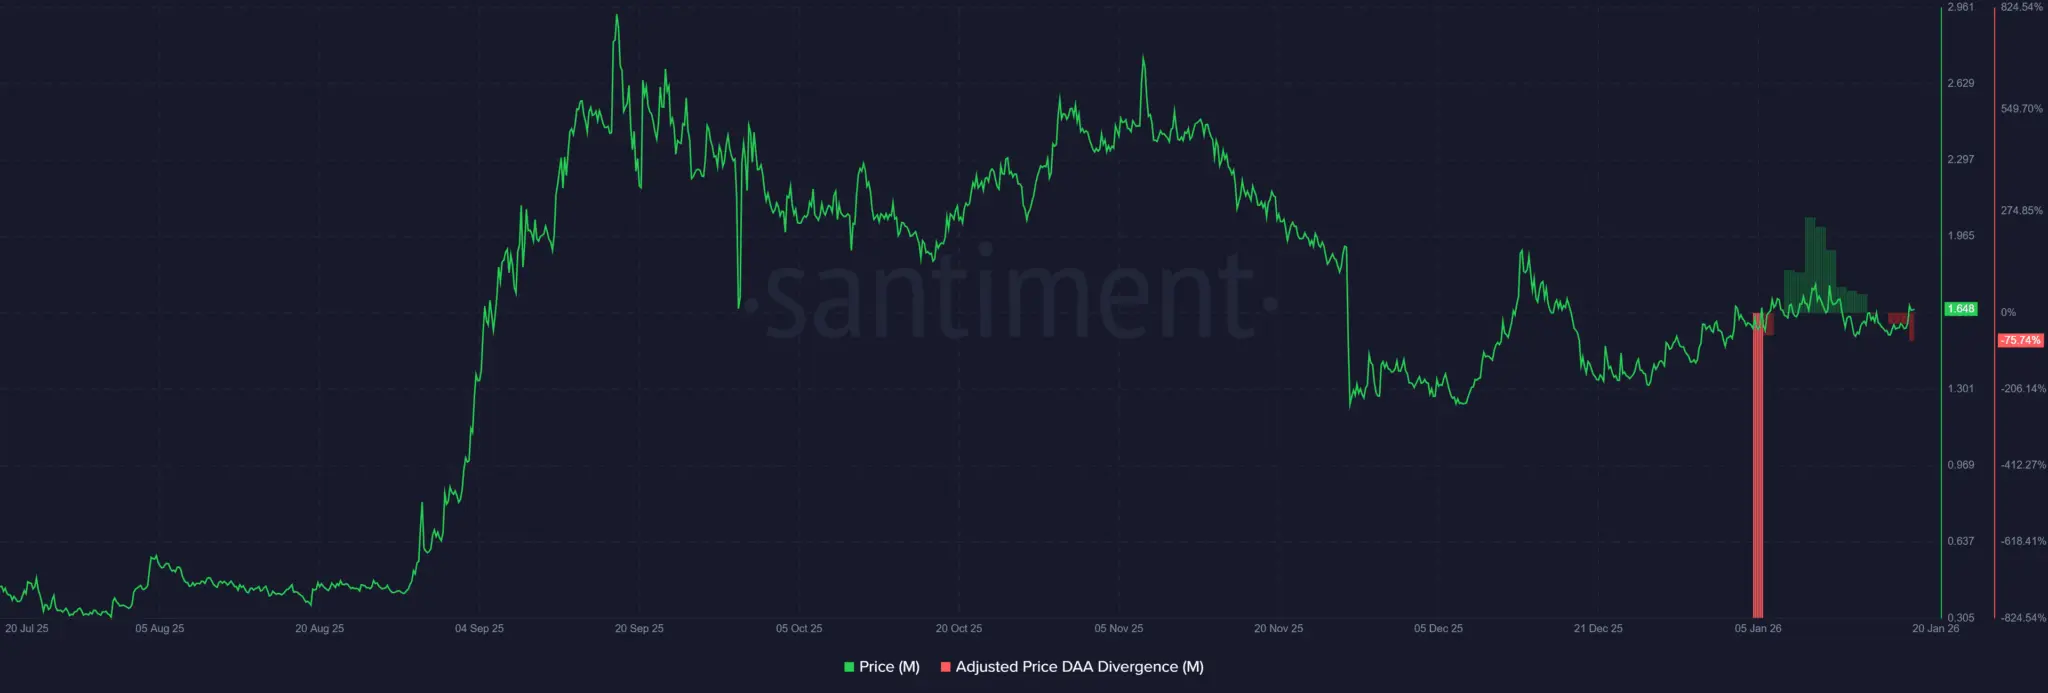 Source: Santiment A high negative ratio usually indicates a risk of the token being overvalued, which could reduce its attractiveness to investors. Overall, while M’s market structure still maintains an upward trend, this momentum could weaken if on-chain signals continue to diverge.
Related Articles
Glassnode: Over 400,000 Bitcoins are accumulated in the $60,000 to $70,000 range, forming a dense cost support zone
ONDO Bleeding in a Weak Market, But Tokenized Stocks and New L1 Could Flip the Entire Narrative
F2Pool Co-founder Wang Chun: ETH rebounded from $1,386 to $4,956 within 4 months, and investors should not be swayed by short-term panic emotions.
SUI Extends Decline as Technicals Signal Further Downside