Memecore Price Prediction – Traders may want to pay attention to these key breakout levels!
Memecore (M) records a 1.9% price increase, reaching $1.60 at the time of this writing. From the $1.22 bottom on 12/08, this memecoin has grown nearly 31% in just six weeks. Notably, Memecore’s Layer 1 blockchain is currently operating a perpetual contract decentralized exchange (perpetuals DEX) called MemeMax.
Expectations surrounding the official launch of MemeMax could serve as a catalyst to boost the M price in the near future. Especially, the 100% buyback fee program during the pre-launch phase (pre-launch) that MemeMax commits to also helps increase the appeal and demand for the M token.
Memecore Price Movement Analysis
The MemeMax MaxPack airdrop campaign has been extended until the DEX officially launches, reflecting strong community support. Evidence is the trading volume on the network skyrocketing by 400%, making the extension of the program necessary. Currently, the buyback fee program is still in effect.
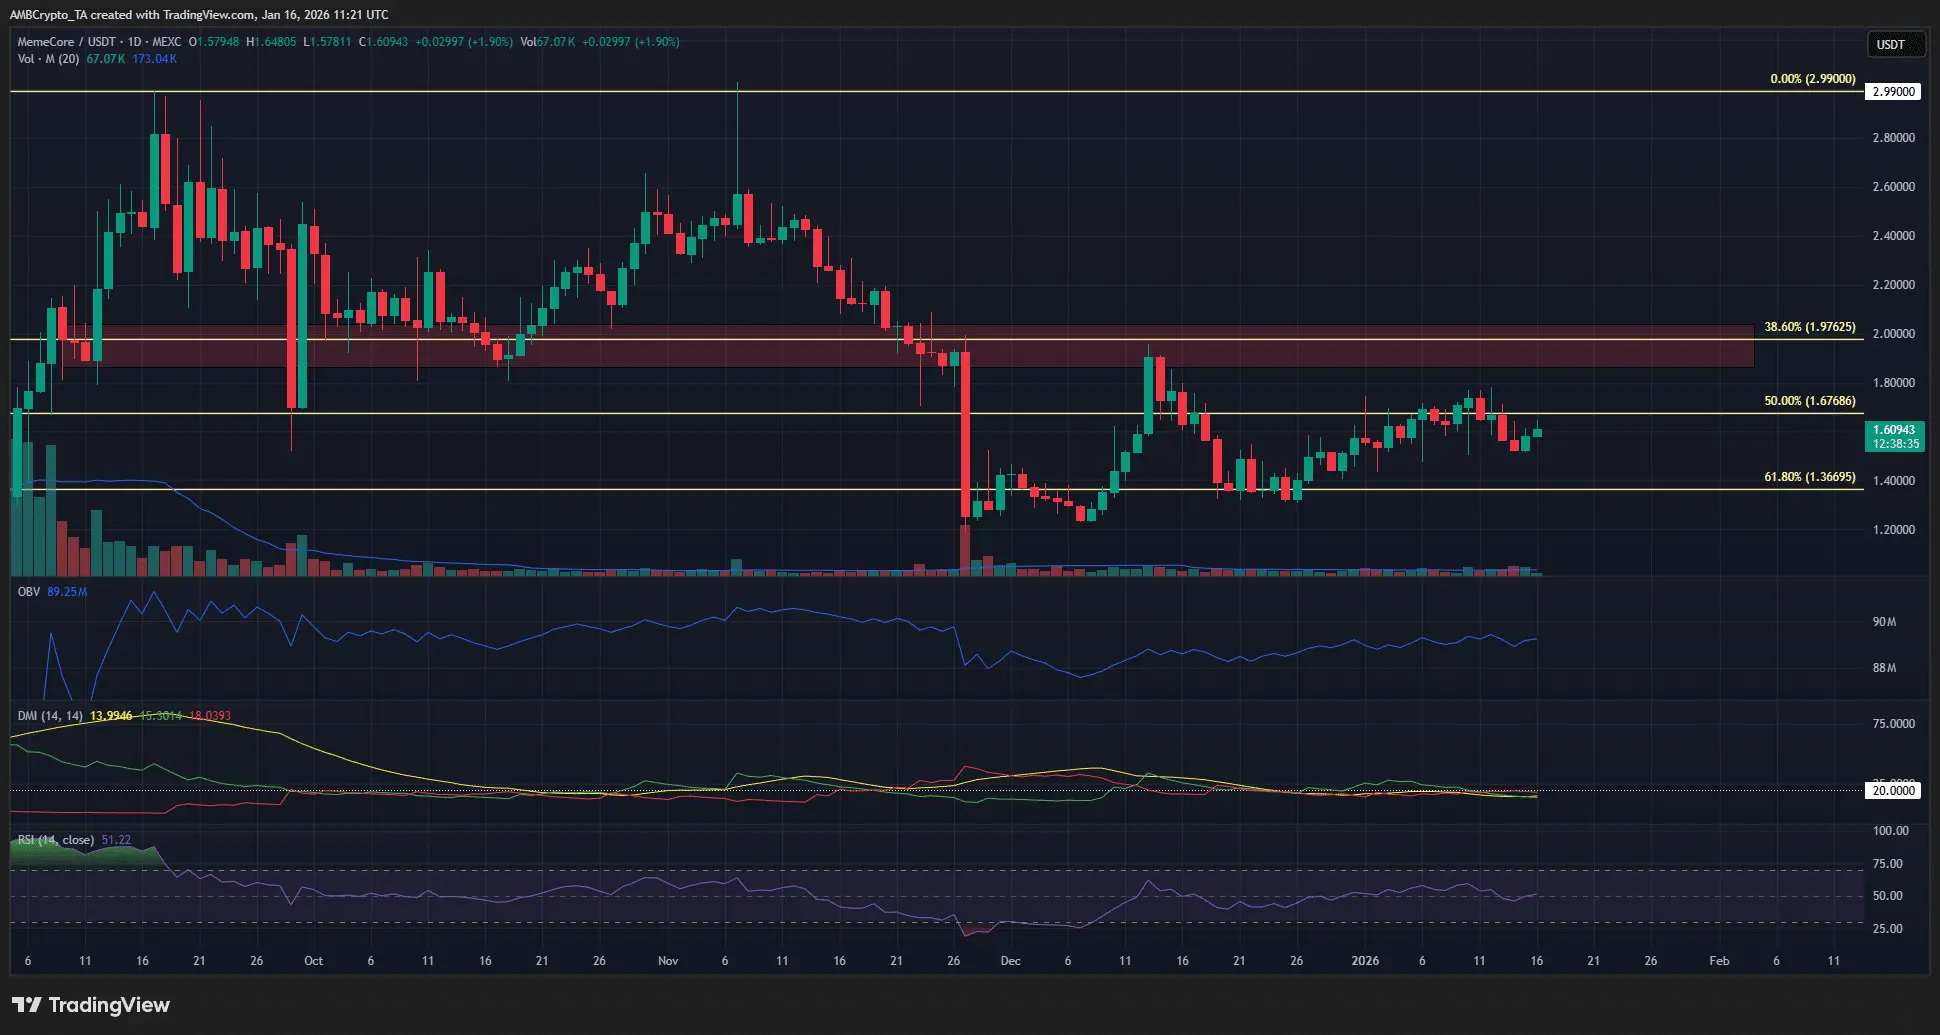 Source: TradingView After testing the supply zone $2 in mid-December, the M price corrected and halted at the 61.8% Fibonacci retracement level – determined based on the rally from $0.36 to $2.99 during August-September 2025.
As long as this key support level remains intact, the long-term bullish outlook for M remains intact. In the short term, trend-following traders (swing trader) may consider buying positions cautiously.
Investor Notice for Memecore
Trading volume in recent weeks has remained stable, with no signs of breakout compared to the previous strong rally. The DMI indicator currently does not show the formation of a clear trend, while RSI stays neutral around the 50 mark.
The momentum indicator attempted to break above 60 in December but was unsuccessful; if achieved, it would signal strong bullish momentum.
Strategy for Traders – Waiting for Key Signals
The lack of a clear trend makes short-term traders vulnerable to being “swept” by volatility. Meanwhile, trend traders might consider two entry points: one is waiting for the price to break above $2, and the other is waiting for a correction back to the demand zone at $1.35.
If the price drops below $1.20, the bullish thesis will be invalidated, indicating that buying pressure has significantly weakened.
Currently, trading volume trends are not prominent, and breaking through $2 remains unconfirmed, especially as it could be influenced by Bitcoin (BTC) price movements.
Related Articles
After 5 Years of Pain, Altcoins Just Flashed the Same Signal as 2020
Altcoin Market Cap to Revenue Ratios Reach Low Levels Amid Price Decline
Analyst: Bitcoin has entered a historically significant bottoming zone; the real test is the entry timing, not the price.