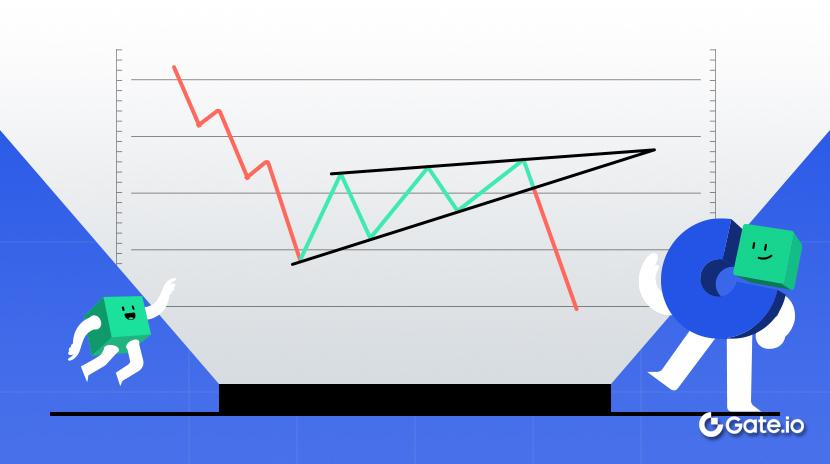
A rising wedge pattern is a popular technical indicator. It indicates a reversal seen in a bear market. Learn everything about this pattern in this article.
2026-04-09 05:07:52
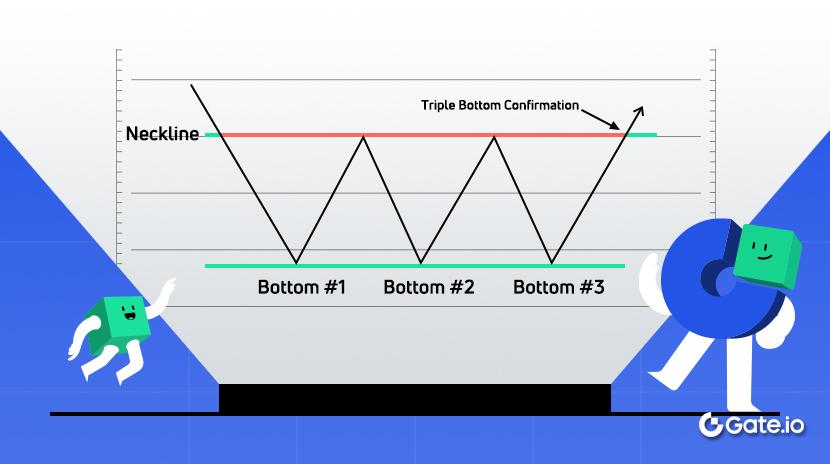
The triple top and bottom patterns are used to identify trend reversals on a chart. When learned well, both patterns can help you know when to exit a trend.
2026-04-09 05:06:49
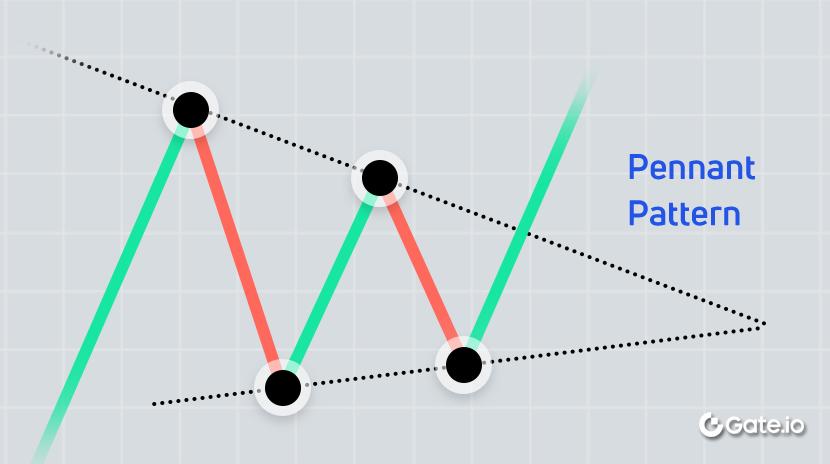
A Pennant is a trend continuation pattern, which follows price trends, either bullish or bearish. It helps traders monitor price trends.
2026-04-09 04:57:49
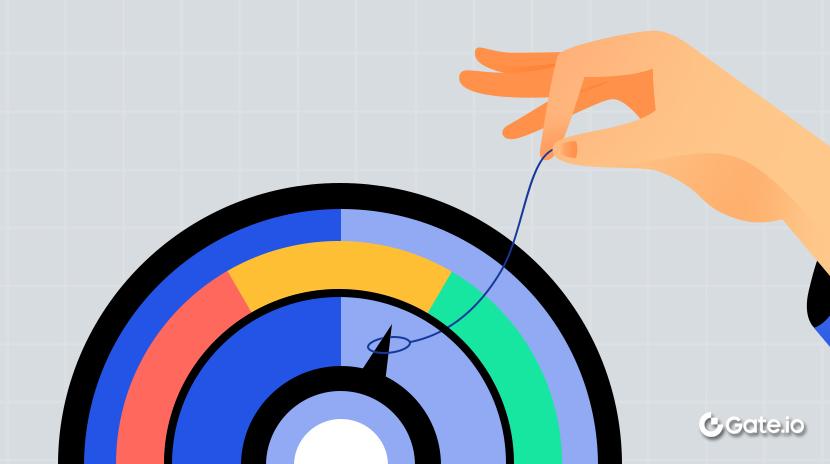
Risk management is vital to perform an informed investment. Developing risk management awareness and mastering necessary risk management skills are vital for crypto investors.
2026-04-09 04:52:01
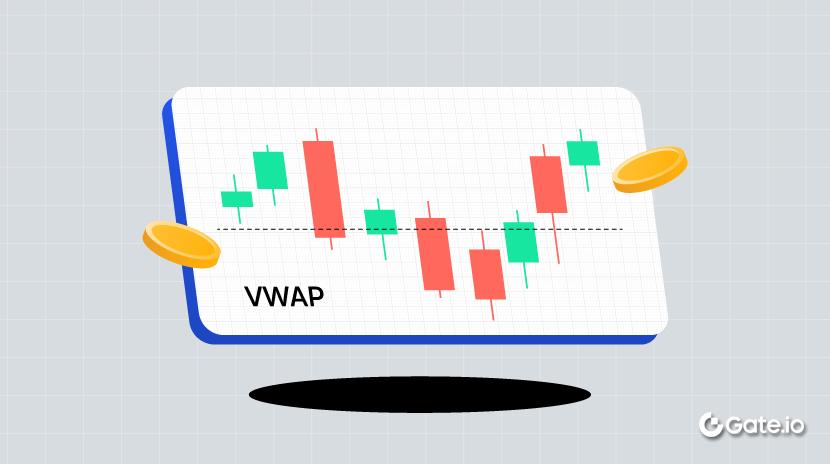
The Volume-Weighted Average Price (VWAP) is a technical analysis tool for measuring the average price weighted by volume. When the price is above the VWAP line, the market is in an uptrend, and when the price is below the VWAP line, the market is in a downtrend. Lots of traders and institutions use VWAP as a key indicator to judge buying and selling points.
2026-04-09 04:50:16
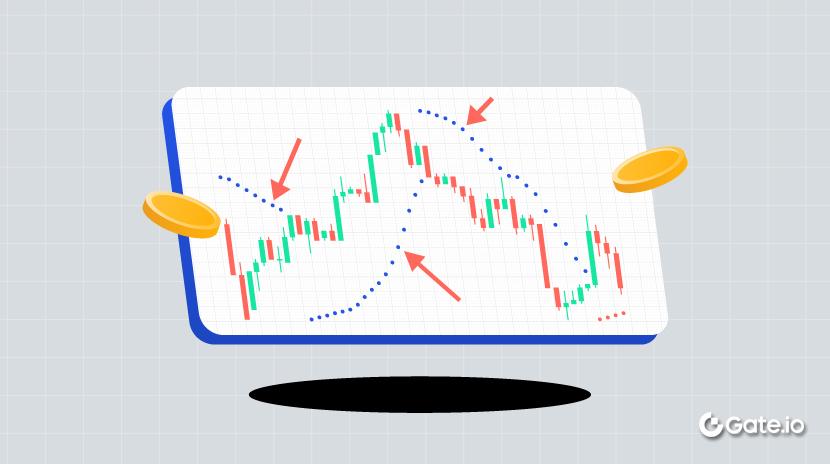
The Parabolic SAR indicator is a technical indicator that highlights the price direction of an asset.
2026-04-09 04:45:13
KuCoin is a user-friendly crypto exchange service that allows users to buy, sell, and trade various cryptocurrencies.
2026-04-09 04:44:17
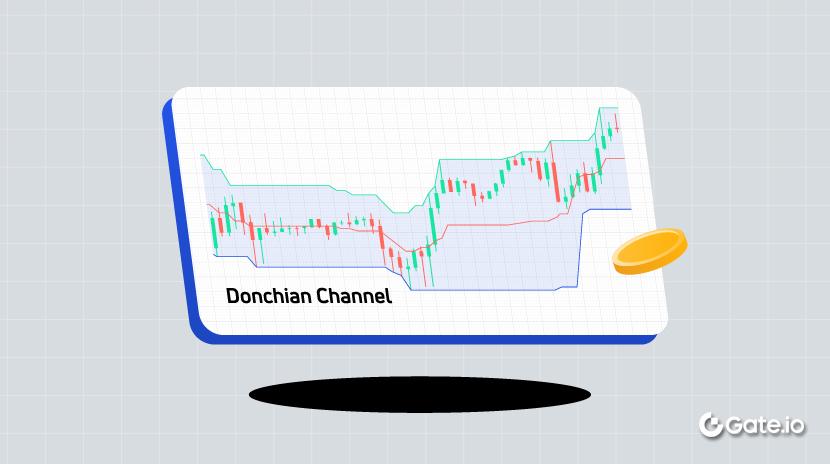
A Donchian Channel is a trading technique used as an indicator by traders to identify bearish and bullish points within the financial market, and when to take a long or short position.
2026-04-09 04:43:16
Auto-deleveraging (ADL) is a risk management mechanism deployed by centralized exchanges to cancel pending orders from a user with a higher ADL ranking.
2026-04-09 04:39:06
The Dow Theory is a technical analysis theory created by Charles H. Dow that recognizes upward and downward trends in the stock market.
2026-04-09 04:37:16
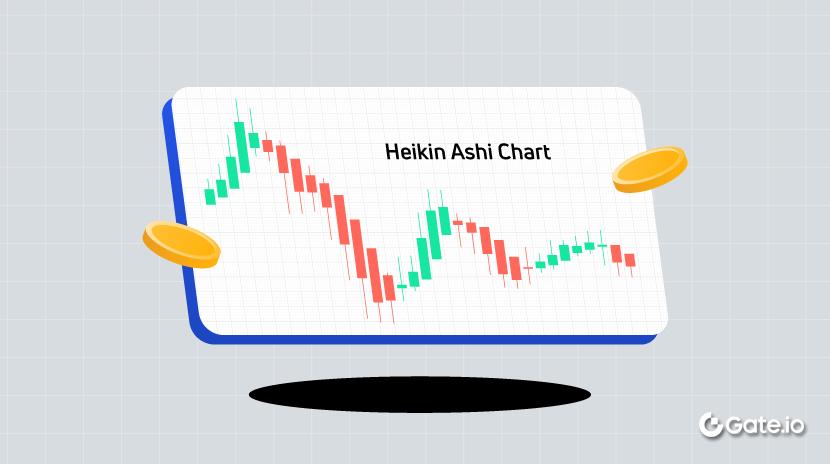
The Heikin Ashi Chart is a type of candlestick chart that provides a smoothed visual representation of price action, helping to eliminate market noise and identify trends in the market.
2026-04-09 04:19:55
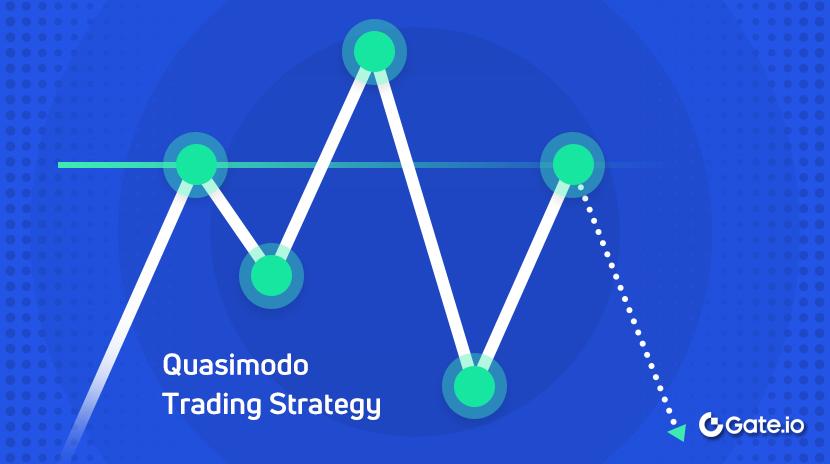
The Quasimodo trading strategy is a unique strategy used to spot potential buy and sell regions. In 2025, it has evolved significantly with AI-powered pattern recognition, new variations like nested and fractal QMs, and integration with DeFi platforms. The QM strategy remains highly profitable for trading cryptocurrencies, now featuring enhanced risk management techniques and impressive performance metrics such as a 72% win rate for continuation patterns. Modern traders leverage QM patterns for optimizing liquidity provision, yield farming, and arbitrage opportunities in the ever-evolving crypto markets.
2026-04-09 04:18:55
As a crypto investor, you should understand the relevance of crypto whitepapers and especially how to analyze them before making allocation decisions.
2026-04-09 04:15:55
Support and resistance are two of the most commonly used K-line technical analyses in trading, looking at resistance on an uptrend and support on a downtrend. However, the levels of support and resistance are not absolute. Typically, the level of support and pressure will change in response to repeated changes in market conditions. In some cases, the price support may become the resistance.
2026-04-09 04:15:06
The Exponential Moving Average (EMA) is a trend-based technical indicator. In most cases, investors use the EMA as a support or resistance line in trading and a combination of short-period and long-period EMA indicators to forecast price movements.
2026-04-09 04:14:17