
According to an analysis published on X on April 30 by the crypto research firm Delphi Digital, backtest results for holding periods since May 2016 show that after including staking rewards, ETH and SOL had no negative returns across all five-year holding periods; in the worst case, BTC lost about 13%. The BTC five-year median return is above 8x, while the ETH five-year median return is close to 13x.
Methodology and data scope
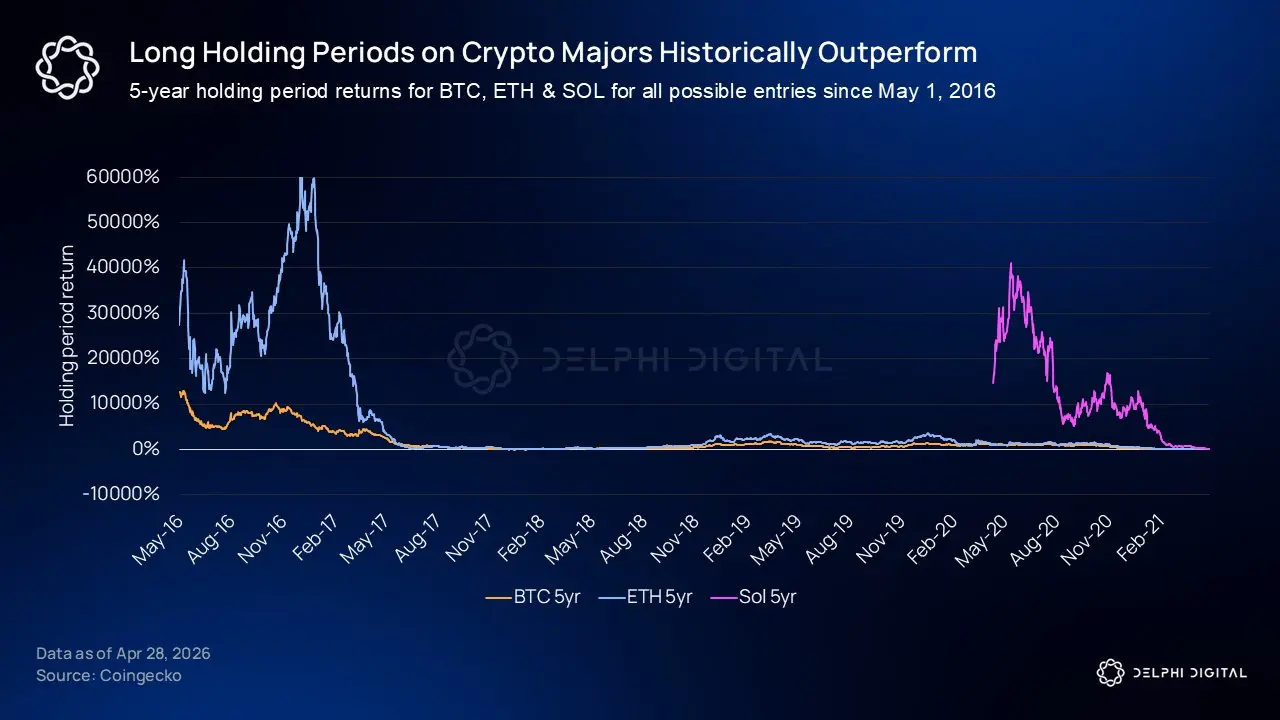
(Source: Delphi Digital)
According to Delphi Digital’s April 30 post on the X platform, the analysis was led by the firm’s analyst @yeak__, and it performs a comprehensive backtest of all possible five-year holding periods for BTC, ETH, and SOL using daily price data starting from May 2016. The return calculations for ETH and SOL include the applicable staking rewards for each.
Key backtest results
According to the analysis released by Delphi Digital on April 30, the backtest results for each asset are as follows:
· For BTC, out of all five-year holding periods, only 11 intervals showed negative returns. The worst entry point was December 16, 2017 (close to the top of the prior market cycle); it exited about at the bottom of the 2022 cycle after five years, with a return of roughly -13%. The BTC five-year holding period median return exceeds 8x.
· After including their respective staking rewards, ETH and SOL showed no negative returns across all five-year holding periods. The ETH five-year holding period median return is close to 13x.
Delphi Digital also noted that shorter holding periods are more sensitive to entry price; using the most unfavorable holding period as the baseline only reflects data from a small number of exceptional windows within the historical sample.
Comparison with traditional assets
Based on Delphi Digital’s April 30 analysis, Nvidia (NVDA)’s cumulative price increase over the past five years is about 14x, and it is often used as a benchmark for comparison with cryptocurrencies. Delphi Digital pointed out that this figure is close to the third and fourth quartile (Q3) of BTC and ETH’s historical five-year return distribution, rather than representing the highest historical return range for those two assets.
Frequently asked questions
Which assets does Delphi Digital’s five-year holding period backtest cover?
According to the analysis Delphi Digital published on X on April 30, the backtest covers BTC, ETH, and SOL; the data scope is daily prices starting from May 2016, and the return calculations for ETH and SOL include the applicable staking rewards.
What is BTC’s worst performance over a five-year holding period?
According to Delphi Digital’s April 30 analysis, BTC’s worst entry point was December 16, 2017 (close to the top of the prior cycle). It exited at a point close to the end-2022 bottom after five years, with a return of about -13%; across all holding periods, only 11 intervals had negative returns.
How do Nvidia’s five-year returns relate to the historical performance of BTC and ETH?
According to Delphi Digital’s April 30 analysis, Nvidia (NVDA)’s cumulative price increase over the past five years is about 14x, which is close to the third quartile (Q3) of the historical five-year return distribution for BTC and ETH, rather than representing the highest historical return range for those two assets.
Disclaimer: The information on this page may come from third parties and does not represent the views or opinions of Gate. The content displayed on this page is for reference only and does not constitute any financial, investment, or legal advice. Gate does not guarantee the accuracy or completeness of the information and shall not be liable for any losses arising from the use of this information. Virtual asset investments carry high risks and are subject to significant price volatility. You may lose all of your invested principal. Please fully understand the relevant risks and make prudent decisions based on your own financial situation and risk tolerance. For details, please refer to
Disclaimer.
Related Articles
$2.14B in Cryptocurrency Options Expire Today, Bitcoin at Max Pain
According to data, approximately $2.14 billion in cryptocurrency options expire today (May 1). Bitcoin options represent $1.74 billion of the total with a put-to-call ratio of 1.10 and a max pain level of $76,000. Ethereum options account for $394 million with a put-to-call ratio of 0.95 and a max p
GateNews52m ago
Bitcoin April Return Hits 11.87%, 12-Month High Despite Lagging Historical Average
According to Coinglass data, Bitcoin's April return rate reached 11.87%, marking the highest level in the past 12 months. However, this falls short of the 12.98% historical average April return and exceeds the 9.57% historical median for the same month.
GateNews56m ago
Benchmark Defends Strategy's $3.5B STRC Bitcoin Accumulation Model as Sustainable
According to Benchmark analyst Mark Palmer in a Wednesday report, Strategy raised approximately $3.5 billion in early April through STRC preferred stock issuance, with over 85% of proceeds deployed to purchase 51,364 bitcoin. Palmer pushed back against critics framing the variable-rate perpetual pre
GateNews3h ago
Pentagon Eyes Bitcoin Infrastructure as Strategic Asset, Hegseth Says
U.S. Secretary of War Pete Hegseth said this week that Bitcoin is part of classified Defense Department efforts to project power and counter China.
Key Takeaways:
Pete Hegseth told Congress on April 30, 2026, that Bitcoin efforts are classified inside the Pentagon.
Samuel J. Paparo Jr.
Coinpedia3h ago
Bitcoin Magazine is moving into television media and is set to launch BM TV, starting daily live broadcasts to discuss market updates.
Bitcoin Magazine announced that it will launch a daily live stream, BM TV, in the summer. Produced at its Nashville headquarters, the broadcast runs Monday through Friday from 9:30–11:30 a.m. Eastern Time. The program will be simulcast across X, YouTube, Facebook, Rumble, LinkedIn, and the official website. The show focuses on Bitcoin, global markets, macroeconomics, geopolitics, energy, and AI, delivering real-time market data and expert remote interviews. Each year it produces more than 200 episodes, along with derived short films and editorials, showcasing its transition from a publishing organization into a large media service provider.
ChainNewsAbmedia4h ago
Blackrock Pulls $54M From IBIT as Bitcoin ETF Slide Pushes Assets Below $100B
A third consecutive day of outflows in bitcoin and ether ETFs underscores a shift toward caution, as investors continue to trim exposure after last week’s strong inflow streak. Smaller assets like XRP are still attracting selective capital, while solana products remain dormant.
Key Takeaways:
Coinpedia4h ago