Hedera (HBAR) price continues to decline in a bearish trend as it extends its downward move and trades below the $0.103 level at the time of writing on Tuesday, after losing nearly 4% in the previous session. On-chain indicators and derivatives markets are both showing negative signals, combined with technical indicators that are not very optimistic, reinforcing a bearish scenario and increasing the risk of HBAR entering a deeper correction in the near future.
On-chain and derivatives data indicate a downtrend
Social Dominance data from Santiment further supports a negative outlook for Hedera. This index reflects the proportion of discussions related to HBAR across crypto media. Since late December, Social Dominance has been in a clear declining trend and continued to fall sharply in February, reaching just 0.018% on Tuesday. This movement indicates waning market interest and reflects increasingly negative investor sentiment toward HBAR.
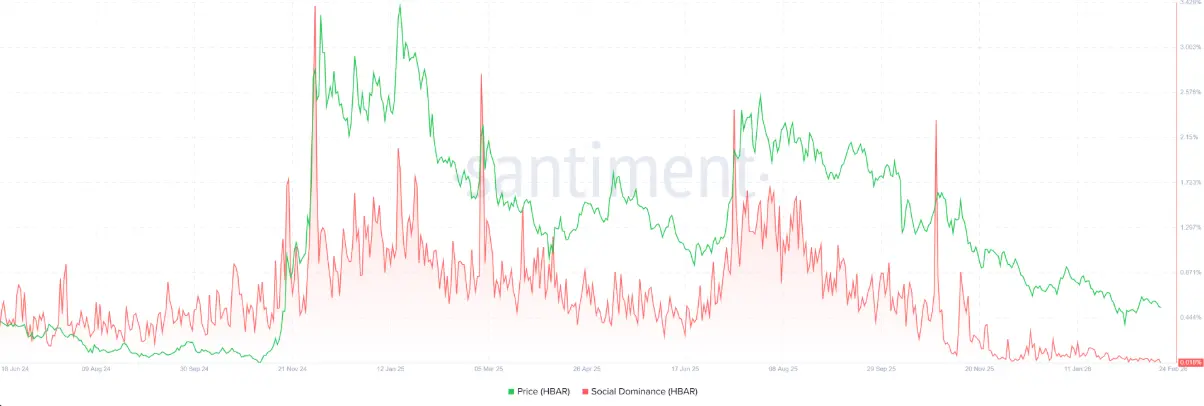 HBAR Social Dominance Chart | Source: Santiment
In the derivatives market, Hedera futures open interest (OI) also looks bleak, dropping to $92.15 million on Tuesday. The downward trend has been ongoing since early January, and OI is approaching the February 6 low of $88.89 million. The continuous contraction of OI suggests weakening capital flow and investor participation, highlighting a short-term bearish outlook.
HBAR Social Dominance Chart | Source: Santiment
In the derivatives market, Hedera futures open interest (OI) also looks bleak, dropping to $92.15 million on Tuesday. The downward trend has been ongoing since early January, and OI is approaching the February 6 low of $88.89 million. The continuous contraction of OI suggests weakening capital flow and investor participation, highlighting a short-term bearish outlook.
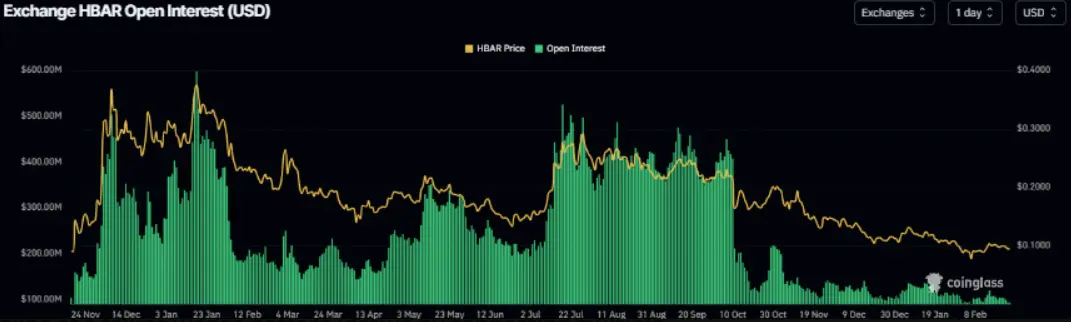 HBAR Open Interest Chart | Source: Coinglass
Hedera Price Forecast: Bears Target Deeper Correction
Hedera’s price failed to break above the 50-day exponential moving average (EMA) at $0.103 on February 14, leading to a sharp decline of about 8.5% through Monday. Notably, the 50-day EMA nearly coincides with the upper trendline of a falling wedge pattern — formed by connecting the highs and lows since late June — making this area a key technical resistance. As of Tuesday, HBAR is trading around $0.094.
If selling pressure persists, HBAR could retreat to a critical support zone on the weekly timeframe at $0.090. Closing below this level could trigger a new wave of selling, pushing the price further down to the next daily support around $0.072 — the low established on October 10.
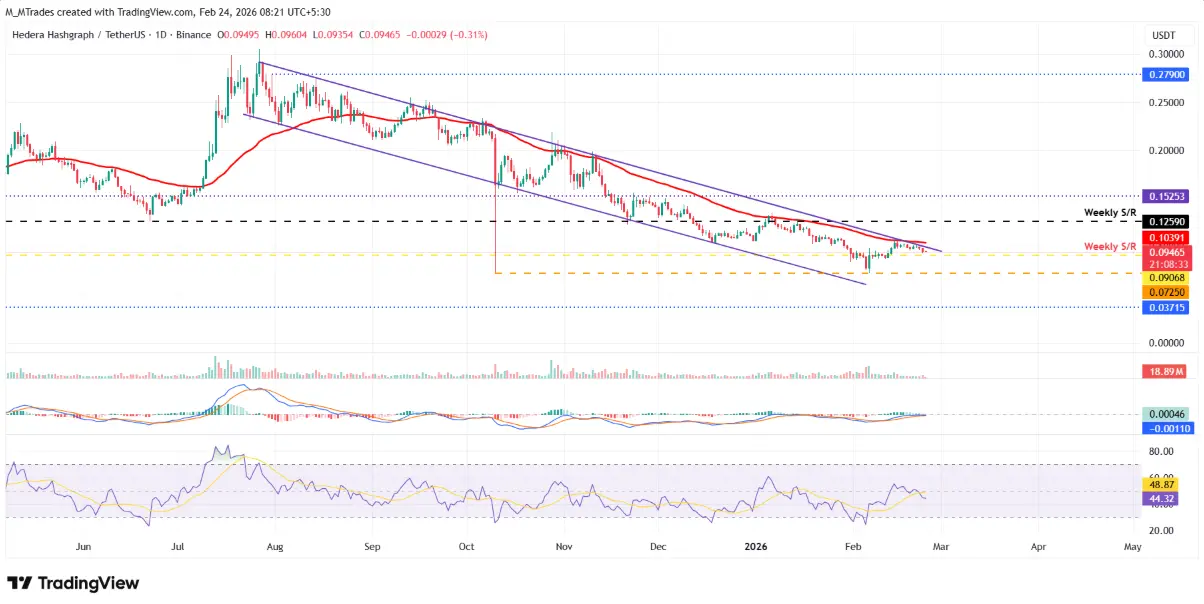 Daily HBAR/USDT Chart | Source: TradingView
Momentum indicators also lean toward a negative scenario. The Relative Strength Index (RSI) on the daily chart is at 44, below the neutral 50 level, and continues to weaken, indicating that the bearish momentum is gaining strength. Meanwhile, MACD lines are converging, suggesting market indecision. A bearish crossover in MACD would further confirm the short-term downside outlook.
Daily HBAR/USDT Chart | Source: TradingView
Momentum indicators also lean toward a negative scenario. The Relative Strength Index (RSI) on the daily chart is at 44, below the neutral 50 level, and continues to weaken, indicating that the bearish momentum is gaining strength. Meanwhile, MACD lines are converging, suggesting market indecision. A bearish crossover in MACD would further confirm the short-term downside outlook.
In a more optimistic scenario, if buying interest returns and HBAR recovers, the price could regain upward momentum and test the 50-day EMA at around $0.103 — a key resistance level that must be broken to reverse the trend.
Disclaimer: The information on this page may come from third parties and does not represent the views or opinions of Gate. The content displayed on this page is for reference only and does not constitute any financial, investment, or legal advice. Gate does not guarantee the accuracy or completeness of the information and shall not be liable for any losses arising from the use of this information. Virtual asset investments carry high risks and are subject to significant price volatility. You may lose all of your invested principal. Please fully understand the relevant risks and make prudent decisions based on your own financial situation and risk tolerance. For details, please refer to
Disclaimer.
Related Articles
XRP Price Consolidates Under $1.5 — What Could Drive the Next Move to $2? - BTC Hunts
XRP is struggling to maintain its price above $1.40 amidst selling pressure and a bearish market. Key resistance at $1.48 and support at $1.33 will determine its next movement, with potential for upswing to $1.60 or a drop towards $1.20.
BTCHUNTS11m ago
Stock and bond sell-off, BTC holds the 70,000 level, Bitcoin outperformed gold this week
The ongoing military actions by the US and Israel against Iran continue to impact the market. Oil prices surged, causing US stocks and Bitcoin to decline, but Bitcoin's decline was smaller, and it outperformed gold this week. Disrupted energy supplies have sparked inflation concerns, leading to simultaneous declines in stocks and bonds. Investors remain optimistic about cryptocurrencies, with significant capital inflows.
ChainNewsAbmedia34m ago
Did Kaspa (KAS) Price Just Hit Its Cycle Low? Analyst Breaks Down What Could Happen Next
Kaspa (KAS) may be nearing a price bottom as it approaches key technical indicators like Fibonacci levels and a long-term trendline. Analysts suggest the cryptocurrency could stabilize around $0.24, potentially paving the way for a future upward move towards $1, contingent on market conditions.
CaptainAltcoin3h ago
Polkadot to Reset Tokenomics on March 12 With Major DOT Supply and Staking Changes
Polkadot will introduce a new monetary framework on March 12 that sets DOT’s supply cap at 2.1 billion and lowers emissions by 53.6%.
The overhaul will also create a Dynamic Allocation Pool and shorten the DOT unbonding period from 28 days to 24–48 hours.
On March 12, Polkadot will reset
CryptoNewsFlash4h ago
Solana Eyes $90.6 Trigger Point as $83 Support Holds and Liquidation Pressure Builds
A large cluster of short positions faces liquidation if SOL reaches $90.6, potentially increasing volatility.
SOL trades between $83.00 support and $89.58 resistance, keeping price action compressed in the short term.
SOL posts a 0.8% daily gain and rises 0.7% against BTC, holding
CryptoNewsLand4h ago
Will XRP Hold $1.33 or Extend Toward $1.30 Before Rebound?
XRP is currently trading at $1.35, experiencing a 1.3% decline. Key support is at $1.34, while resistance is at $1.40. The price is testing around the Fibonacci levels of $1.33 and $1.30, crucial for potential upward movement or deeper decline.
CryptoNewsLand4h ago

