
【BTC67000 Defense Line Temporarily Holds, Bulls and Bears Enter Critical Battle Zone】
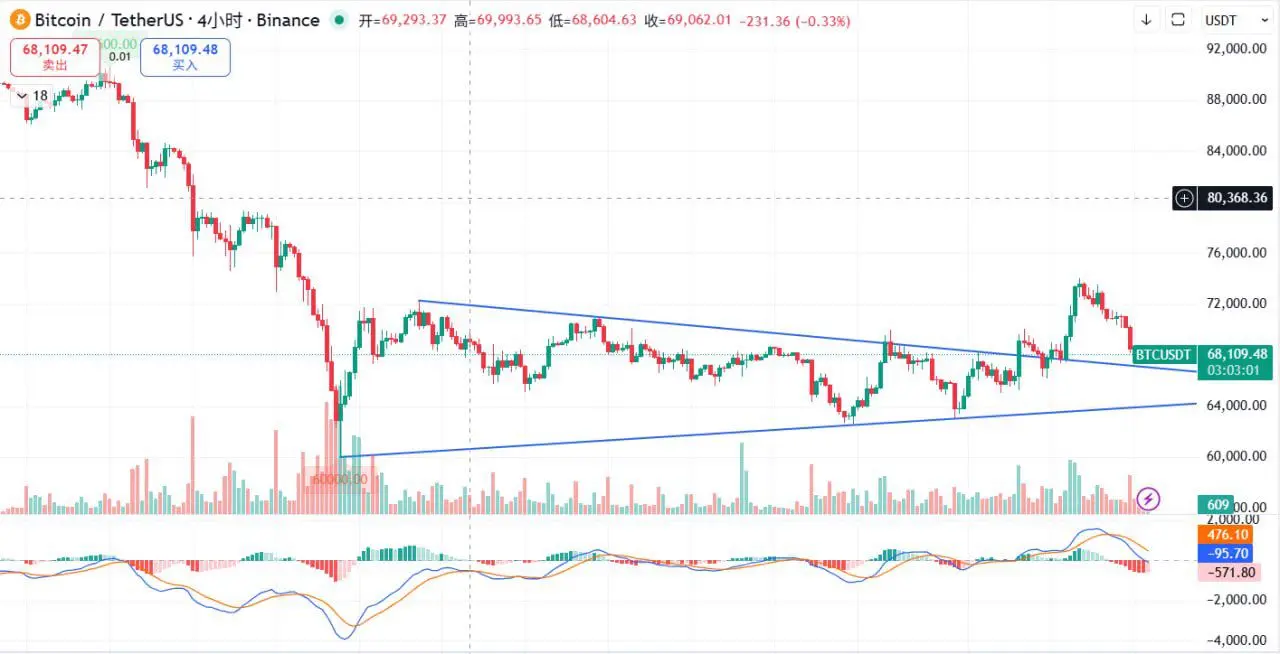
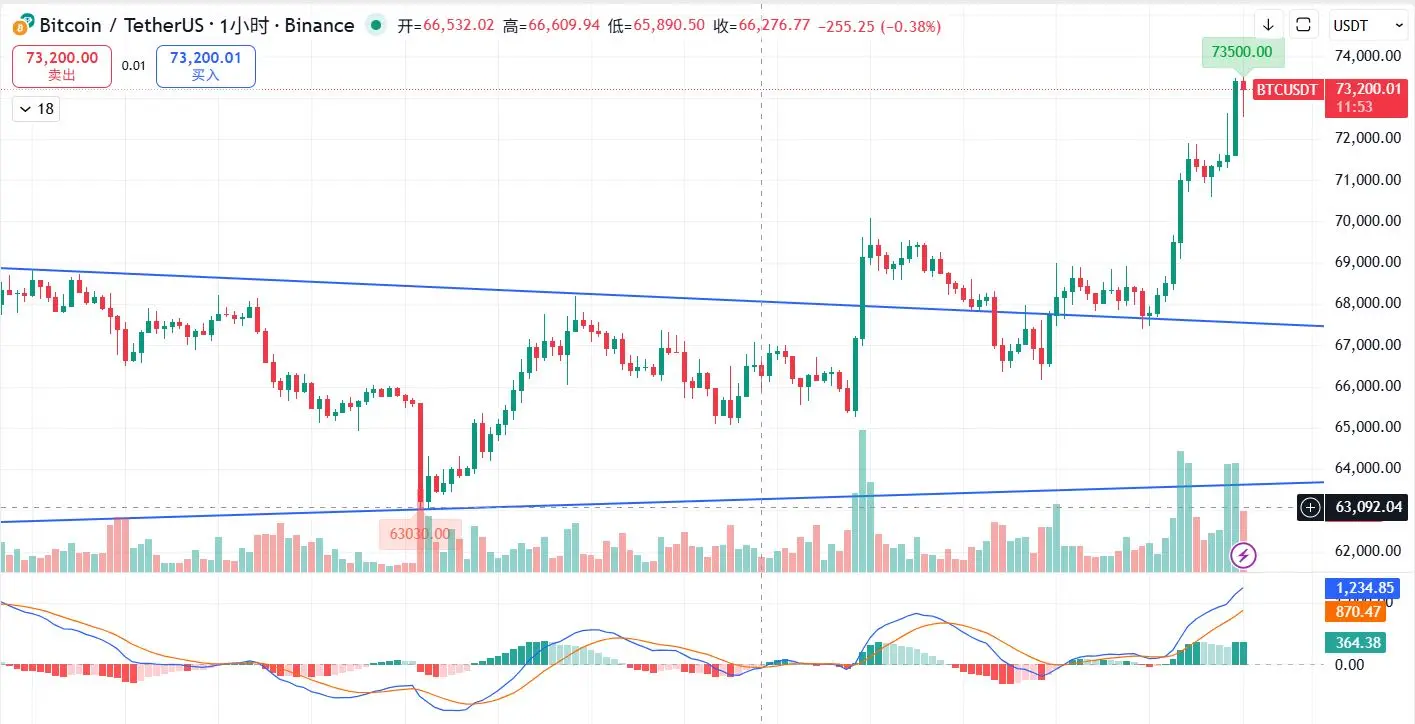
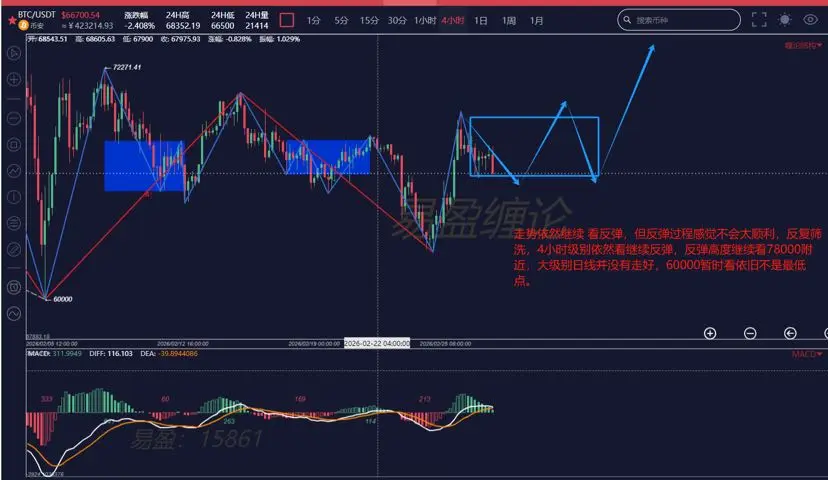
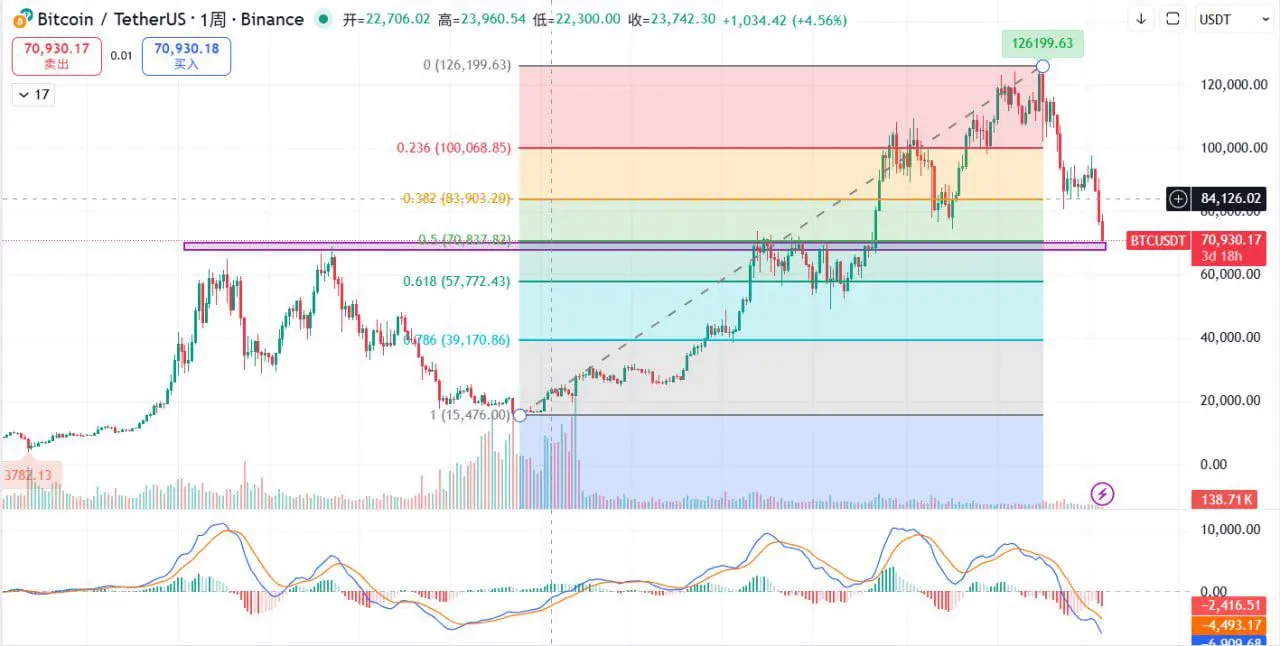
Previously, it was mentioned that after Bitcoin reaches the 74,000 resistance level, it needs to pull back to find support, and the strategy should lean towards defense. Subsequently, the market also moved as expected, briefly breaking below 70,000, indicating short-term market weakness.
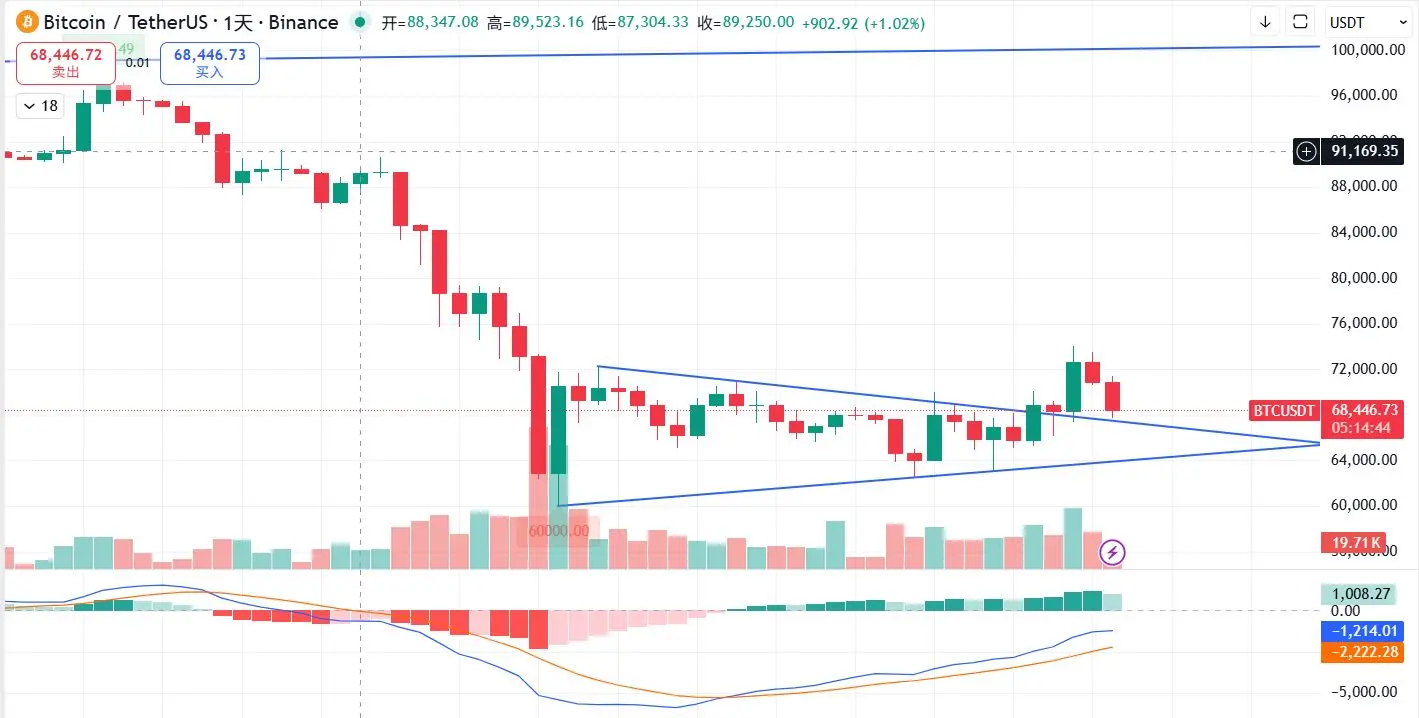
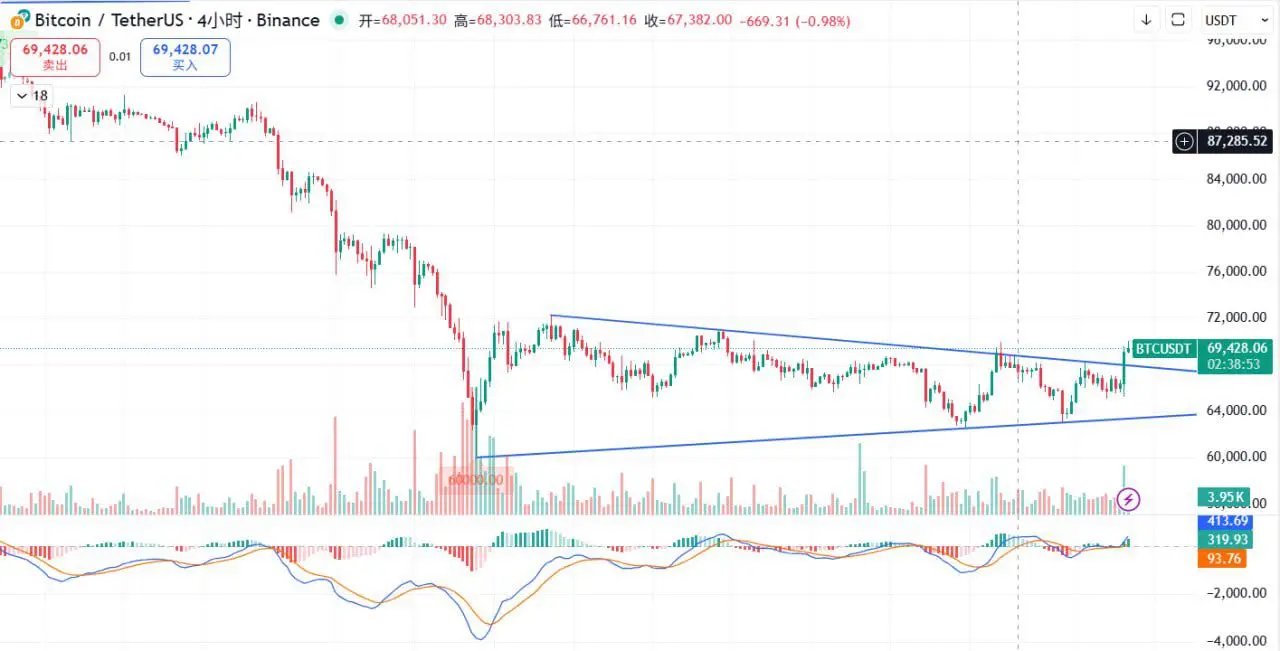
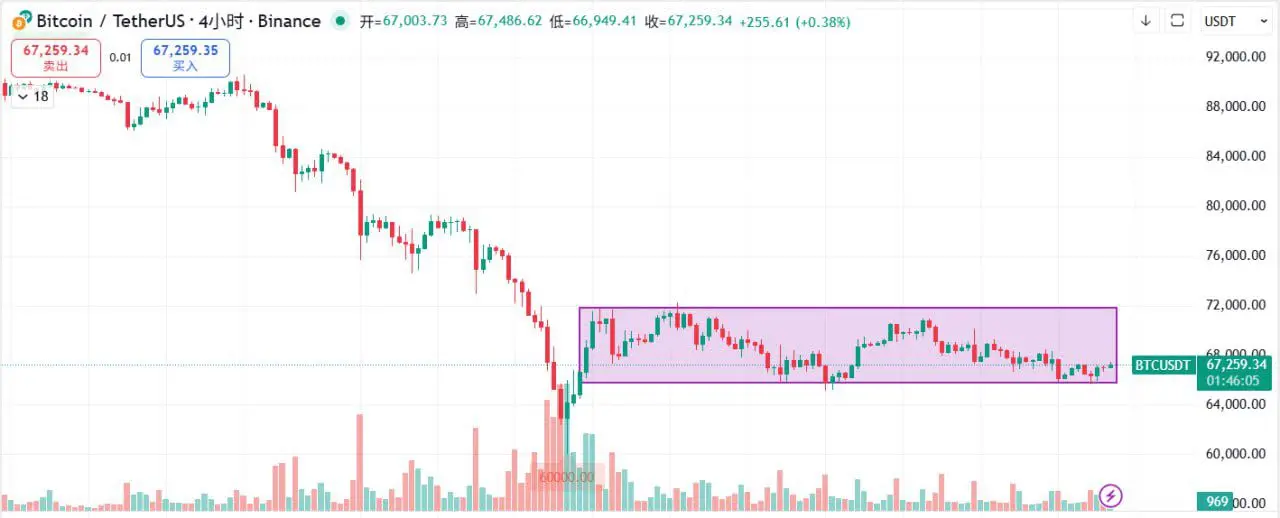
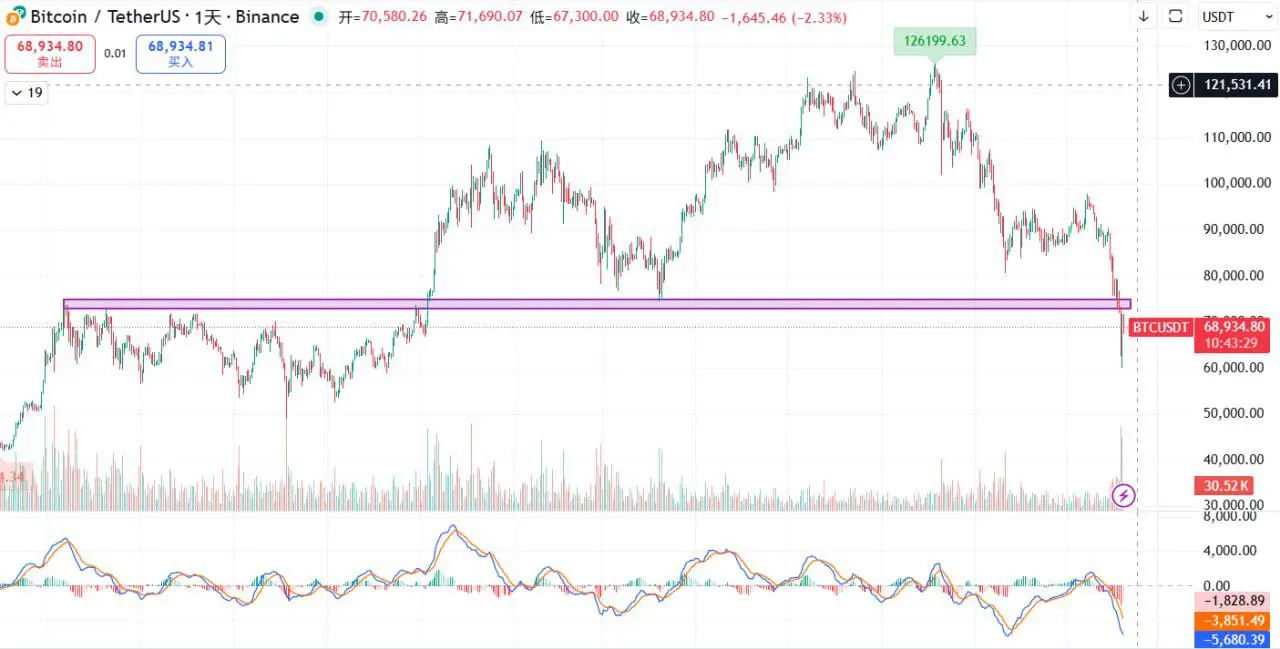
However, from the current chart, Bitcoin ultimately closed above 67,000, holding the previously mentioned triangle upper support zone, indicating that the bulls are still defending this position.
Current Key Levels:
Support: 67,000, 64,000 (Bull/Bear Critical Line)
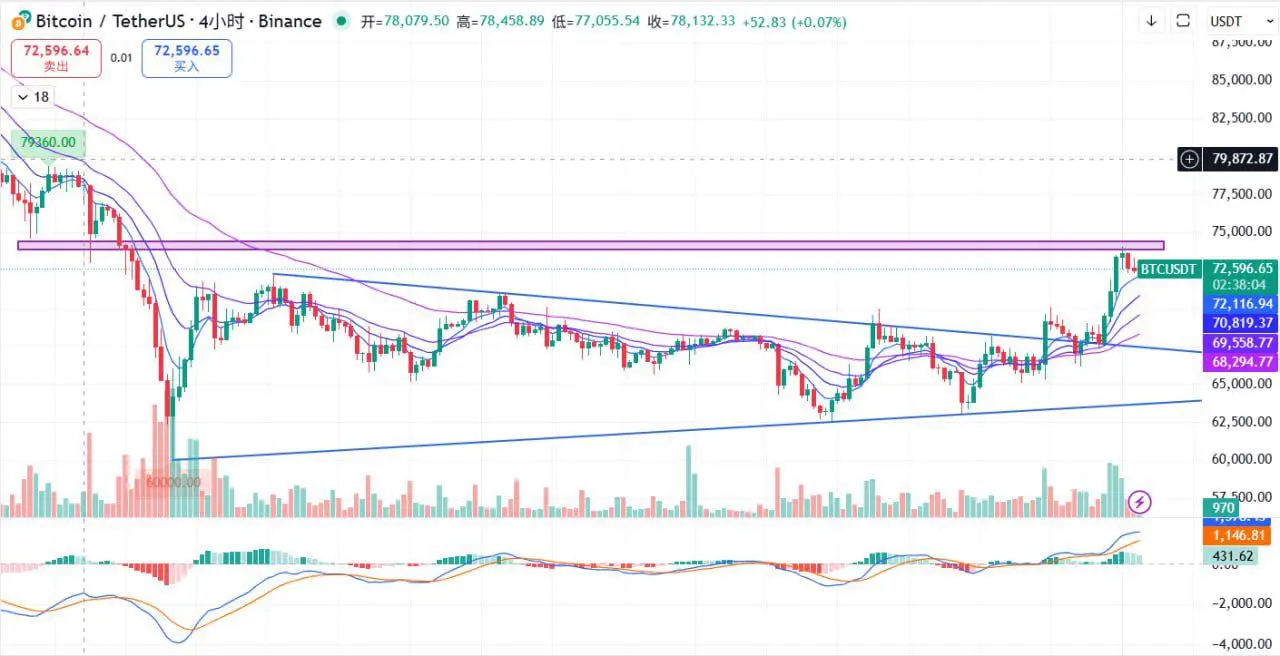
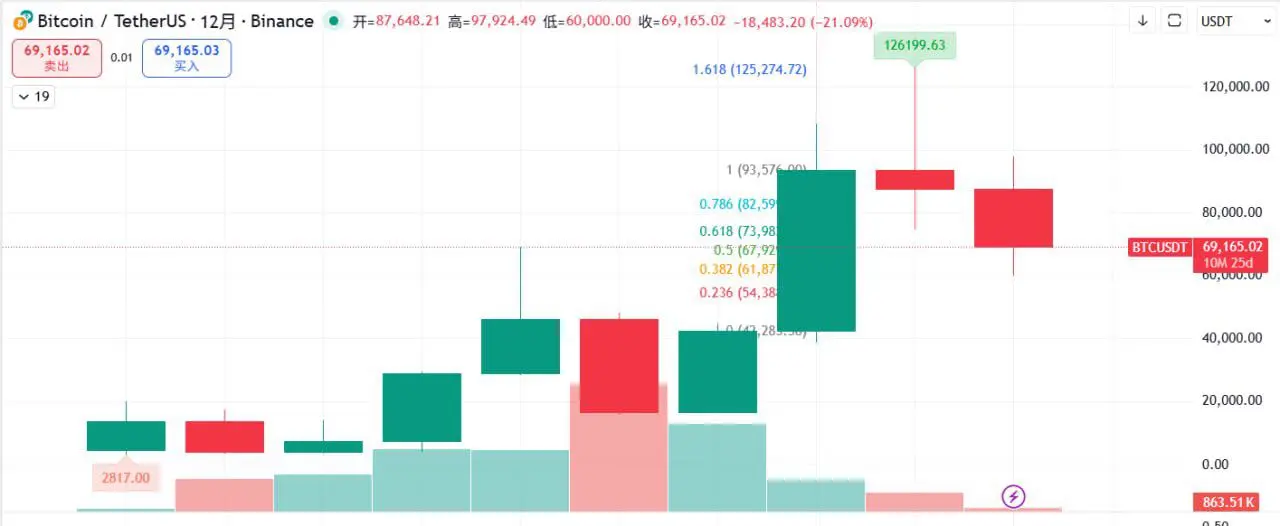
Resistance: 70,000, 74,000
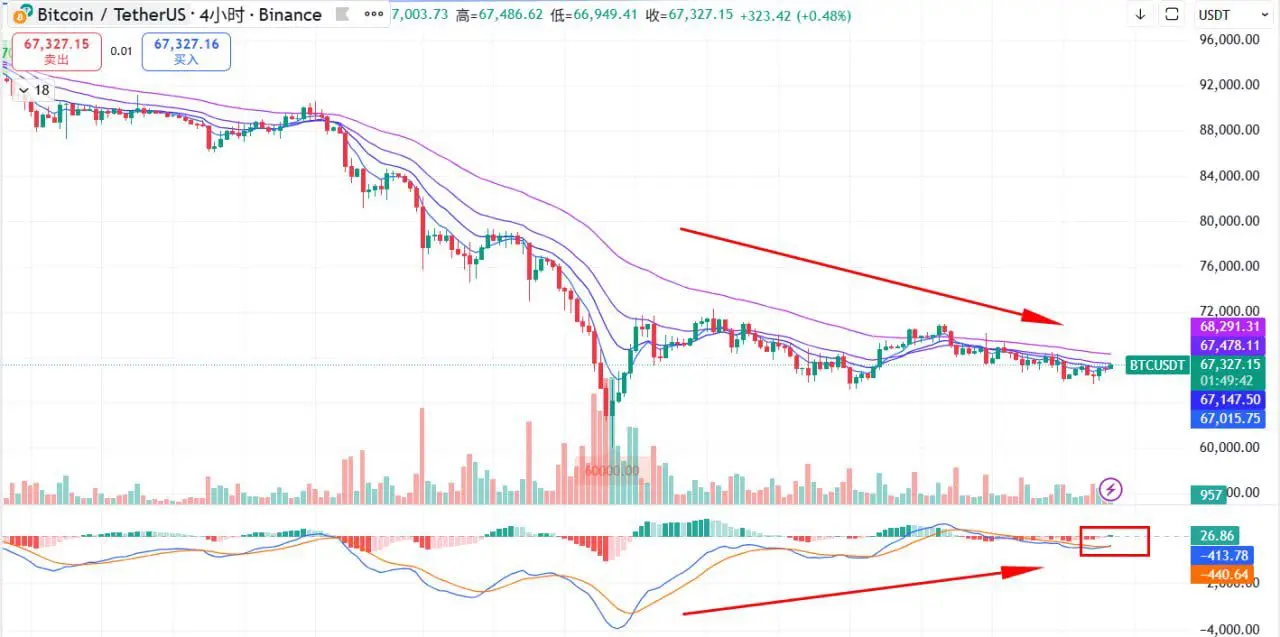
If 67,000 can continue to hold, Bitcoin still has the chance to challenge the 70,000-74,000 range again;
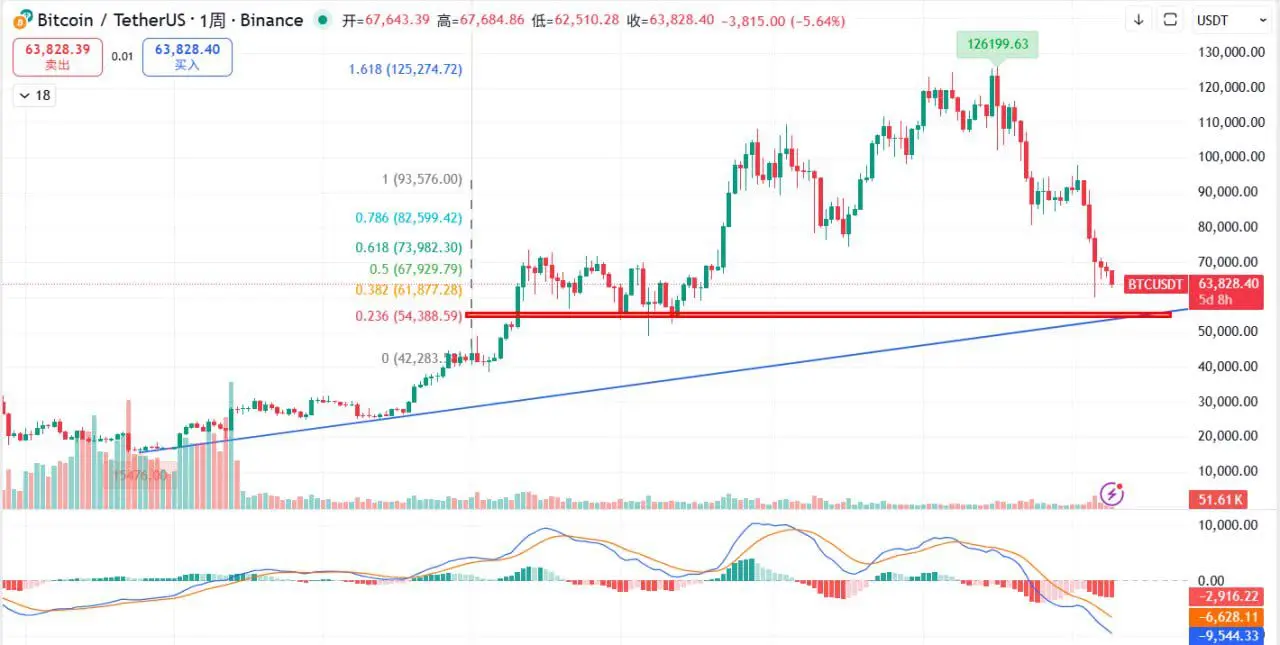
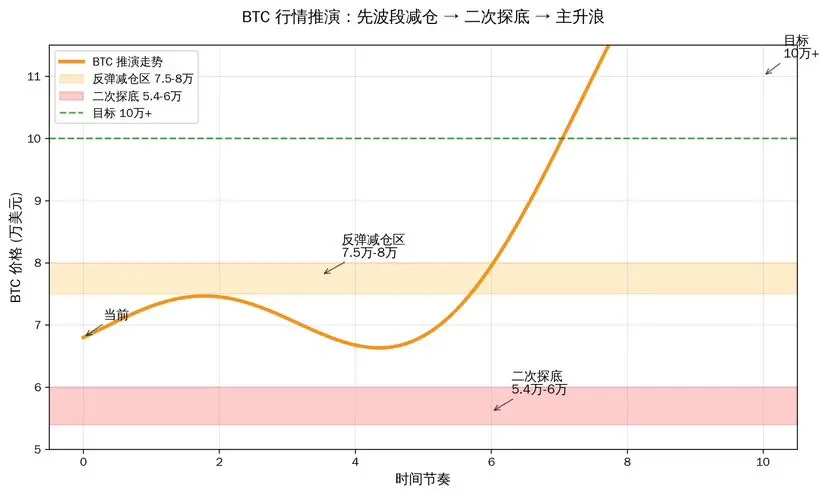
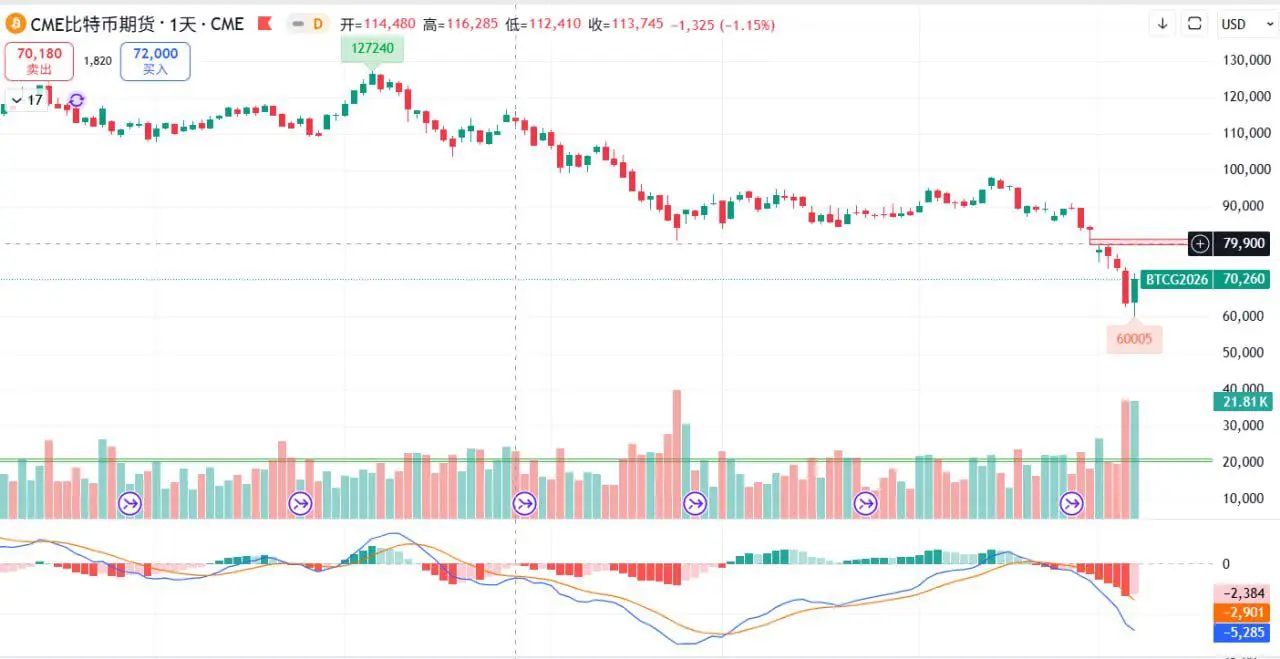
But if the daily chart falls back inside the triangle, the market is likely to test 64,000, or even look for support at 58,000-59,000.
Overall, the market is still in the phase of choosing direction, with more frequent fluctuations.
In terms of strategy: Since you're already trapped, hold your current position. The short to medium term has already seen significant drops, and holding through the dip might be the way to go. Perhaps the dawn is just ahead. Bitcoin is still expected to rally towards around 78,000 USD, so consider exiting or doing T for profit-taking.
Previously, it was mentioned that after Bitcoin reaches the 74,000 resistance level, it needs to pull back to find support, and the strategy should lean towards defense. Subsequently, the market also moved as expected, briefly breaking below 70,000, indicating short-term market weakness.
However, from the current chart, Bitcoin ultimately closed above 67,000, holding the previously mentioned triangle upper support zone, indicating that the bulls are still defending this position.
Current Key Levels:
Support: 67,000, 64,000 (Bull/Bear Critical Line)
Resistance: 70,000, 74,000
If 67,000 can continue to hold, Bitcoin still has the chance to challenge the 70,000-74,000 range again;
But if the daily chart falls back inside the triangle, the market is likely to test 64,000, or even look for support at 58,000-59,000.
Overall, the market is still in the phase of choosing direction, with more frequent fluctuations.
In terms of strategy: Since you're already trapped, hold your current position. The short to medium term has already seen significant drops, and holding through the dip might be the way to go. Perhaps the dawn is just ahead. Bitcoin is still expected to rally towards around 78,000 USD, so consider exiting or doing T for profit-taking.