# ETHMemeCoinFLORKSurges

47.99K
#ETHMemeCoinFLORKSurges
ETH MEME COIN FLORK SURGES — A COMPLETE AND DEEPLY DETAILED ANALYSIS OF THE EXPLOSIVE RISE, THE CULTURE BEHIND IT, AND WHAT IT REVEALS ABOUT ETHEREUM'S MEME SEASON
INTRODUCTION — WHEN A THREE-YEAR-OLD CONTRACT WAKES UP
In the fast-moving world of cryptocurrency, few stories are as dramatic, as instructive, and as revealing about how speculative markets work as what just happened with FLORK. A meme coin that sat dormant on the Ethereum blockchain for over three years, virtually unnoticed, with almost no trading activity, suddenly exploded into one of the most talked-abo
Luna_Star
#ETHMemeCoinFLORKSurges
ETH MEME COIN FLORK SURGES — A COMPLETE AND DEEPLY DETAILED ANALYSIS OF THE EXPLOSIVE RISE, THE CULTURE BEHIND IT, AND WHAT IT REVEALS ABOUT ETHEREUM'S MEME SEASON
INTRODUCTION — WHEN A THREE-YEAR-OLD CONTRACT WAKES UP
In the fast-moving world of cryptocurrency, few stories are as dramatic, as instructive, and as revealing about how speculative markets work as what just happened with FLORK. A meme coin that sat dormant on the Ethereum blockchain for over three years, virtually unnoticed, with almost no trading activity, suddenly exploded into one of the most talked-about tokens on crypto social media. Of all the new meme coin listings, FLORK stands out as a token whose underlying IP itself has nothing to do with crypto, yet it experienced the largest price surge in the shortest period of time. It saw a nearly 6,000 percent increase in just 6 hours and over 8 million dollars in trading volume within 24 hours. That number deserves to sit with the reader for a moment. Six thousand percent in six hours. Not six months. Not six weeks. Six hours. This is the defining characteristic of the current Ethereum meme coin season, and FLORK is its most spectacular example.
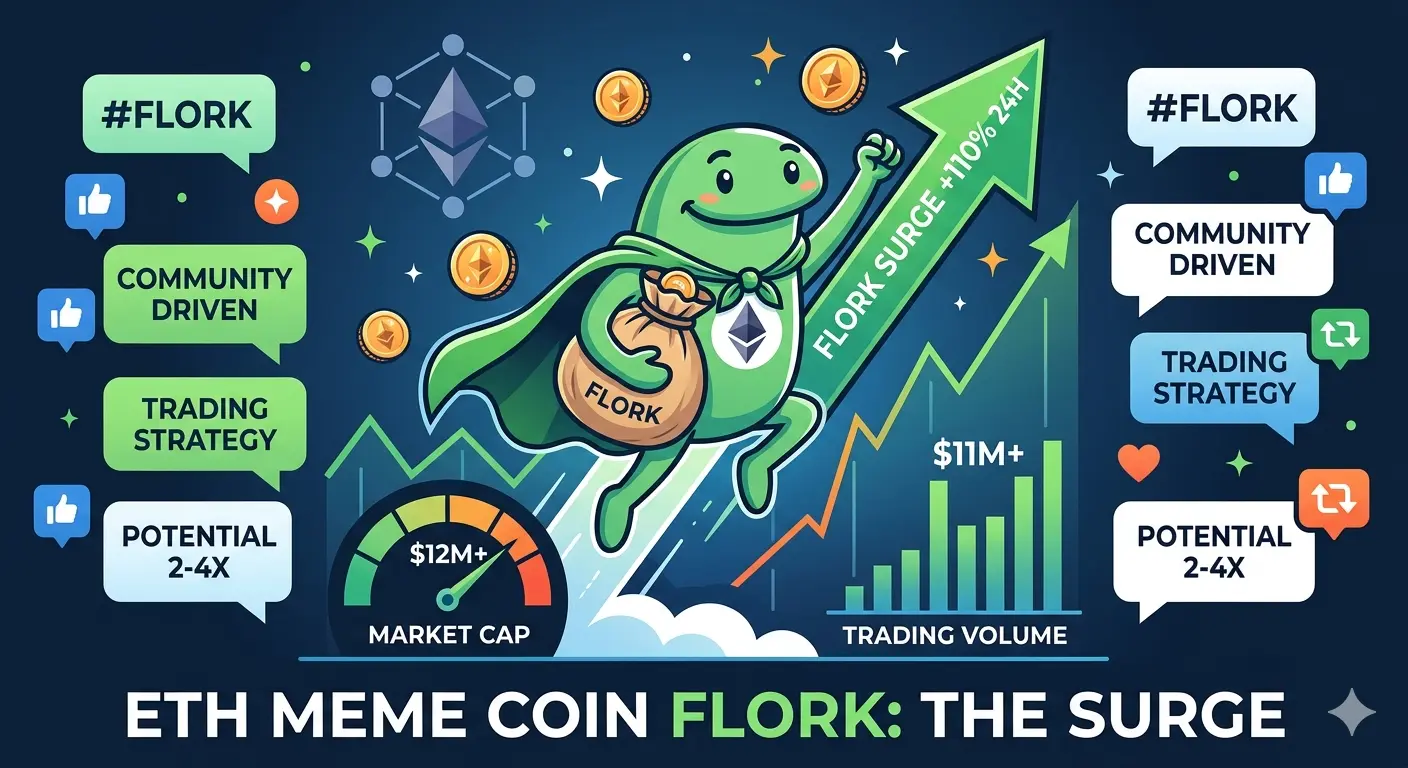
According to market data, the market value of the ETH chain meme coin FLORK briefly surpassed a new all-time high, reported at 12.14 million dollars, with a daily increase of over 100 percent. What began as a rediscovery by on-chain traders scanning old contracts for forgotten meme potential turned into a multi-million dollar market event that put FLORK on the radar of traders across the globe. To understand why this happened, how it happened, and what it means for anyone participating in the crypto market, it is necessary to go back to the beginning — to the comic strip that started everything.
THE ORIGIN — FLORK OF COWS AND THE POWER OF UNIVERSAL HUMOR
The cultural foundation of the FLORK token is not a blockchain project, not a whitepaper, not a developer team with a roadmap, and not an investor deck. It is a webcomic. Flork of Cows is a webcomic series that began updating in 2012, created by Brian DiAntonio. The art style is extremely rudimentary, featuring abstract little figures in an MS Paint style, resembling unfinished sock dolls. The expressions and dialogue follow an existentialist, everyday comedic tone. Its low-cost but incredibly addictive quality is similar to early Rage Comics and Trollface, but it has outlasted them because Flork's content is universal. People from any cultural background can recognize themselves in those absurd little figures. It is particularly popular in Latin America, becoming part of the everyday emotional language of the Spanish-speaking internet.
This cultural reach is precisely what makes FLORK different from most meme coins that derive their identity from crypto-native jokes, trading terminology, or internet subcultures that are only legible to people already deeply embedded in the crypto world. Flork of Cows transcends those boundaries. Its stick-figure characters expressing mundane frustration, social awkwardness, and everyday absurdity have circulated across social media platforms in dozens of languages for over a decade. When crypto traders recognized the opportunity to tokenize that cultural resonance, the combination of deeply familiar imagery and the FOMO-driven dynamics of the meme coin market proved explosive.
FLORK is a memecoin introduced on the Ethereum network paying tribute to the beloved Flork of Cows webcomic series featuring quirky MS-Paint drawn sock puppet characters that have captivated online audiences. With a focus on authenticity and simplicity, FLORK appeals to the cryptocurrency community by implementing a no-tax policy and embracing its unique identity as a memecoin. The no-tax policy is a deliberate design choice that removes the friction that has caused community backlash against numerous meme coins that implemented buy and sell taxes, which are often perceived as mechanisms for developers to extract value from ordinary holders.
THE SLEEPING CONTRACT — THREE YEARS OF SILENCE
One of the most remarkable aspects of the FLORK story is the timeline. The token was not created in response to the current meme season. It was not launched by a team capitalizing on a trending moment. It was created years before anyone was paying attention. The contract for the ETH version of FLORK was created as early as April 2023 and lay dormant through multiple market cycles, through the 2024 bull run, through the early 2025 correction, and into the current market environment. For approximately three years, the contract existed on the Ethereum blockchain with essentially no activity, no community, and no attention.
According to data, one investor purchased a total of 44.03 billion FLORK approximately three years ago, spending 1.9 Ethereum — approximately 3,941 dollars at the time — and has not made any further transactions since. With the subsequent rise in value, the FLORK holdings are now worth approximately 352,000 dollars. However, the address has been inactive for 976 days, with no transactions recorded, raising the possibility that the investor may have forgotten about their FLORK holdings entirely. This is one of the most human stories in crypto — a person who spent less than four thousand dollars on a token they likely considered a long shot, forgot about it entirely, and is sitting on a nearly ninety-fold return without even knowing it.
THE CATALYST — ETHEREUM MEME SEASON RETURNS
The FLORK surge did not happen in isolation. It was part of a broader reawakening of meme coin culture on the Ethereum mainnet, sparked by a specific chain of events that created the conditions for explosive speculative activity. This round of Ethereum memes started with a viral narrative moment that triggered on-chain traders to scan dormant contracts. Once one token surged dramatically, it created a wave of FOMO-driven capital rotation into similar forgotten assets.
Ethereum mainnet gas fees climbed sharply, reflecting increased transaction demand, and the number of trading pairs surged rapidly. Gas fees are a strong signal — when they spike significantly, it indicates real speculative activity at scale. Traders were competing to enter positions quickly, paying higher fees just to get ahead of the momentum.
THE MECHANICS OF THE SURGE — HOW FLORK WENT PARABOLIC
Understanding how a dormant contract with no developer team, no active community, and no marketing budget goes from zero to millions in market capitalization requires understanding the mechanics of modern meme coin trading. On-chain analytics traders actively search for old tokens with recognizable cultural identity. When market conditions align, these tokens can rapidly attract liquidity.
FLORK surged nearly 6,000 percent in six hours and quickly inspired derivative tokens attempting to capitalize on the same narrative. Within 24 hours, its market capitalization multiplied dramatically, reaching multi-million dollar levels. This type of explosive growth is unique to meme coins and highlights both the opportunity and the extreme risk embedded in this segment.
THE TECHNICAL ENVIRONMENT — WHY ETHEREUM MEMES ARE VIABLE NOW
The resurgence of Ethereum-based meme coins is not purely driven by hype. It is supported by improvements in Ethereum’s infrastructure. Transaction costs have decreased significantly compared to previous cycles, making it more accessible for smaller traders to participate.
Layer 2 solutions and broader ecosystem upgrades have reduced barriers that once prevented retail traders from engaging in meme coin trading. Lower costs mean faster participation, and faster participation fuels momentum. When combined with viral narratives, this creates ideal conditions for explosive short-term price movements.
FLORK benefits from Ethereum’s deep liquidity and ecosystem integration. Its large token supply and meme-oriented structure reinforce its identity within the culture that drives these markets.
THE BROADER MEME COIN ENVIRONMENT — A FULL ECOSYSTEM REVIVAL
FLORK’s rise occurred alongside a wider surge in meme coin activity across Ethereum. Multiple tokens experienced extreme gains simultaneously, reflecting a market-wide shift toward high-risk speculative behavior.
Different narratives — cultural, political, humorous, and emotional — all competed for attention. This diversity of narratives shows that meme coin markets are driven less by fundamentals and more by attention economics. Wherever attention flows, capital follows.
THE FORGOTTEN WHALE — THE HUMAN STORY BEHIND THE NUMBERS
Beyond charts and percentages, the FLORK story highlights a deeper truth about crypto markets. Time, patience, and randomness play a significant role in outcomes. The inactive investor sitting on massive gains without knowing represents the unpredictable nature of speculative assets.
This story resonates because it reflects a common experience — buying something, forgetting it, and later discovering unexpected value. In crypto, these stories are rare but powerful, and they fuel the mythology that keeps new participants entering the market.
THE RISKS AND REALITIES — WHAT EVERY TRADER MUST UNDERSTAND
The same dynamics that enable rapid gains also create extreme downside risk. Meme coins are highly volatile and can lose the majority of their value just as quickly as they gain it. Prices are driven by hype, not fundamentals, and when attention shifts, liquidity can disappear rapidly.
Most meme coins do not survive long-term. Many return to near-zero after initial hype fades. These assets typically have no underlying utility, no revenue generation, and no intrinsic value beyond market sentiment.
Understanding this reality is critical. Participation in meme coin markets requires awareness of both opportunity and risk. Without that awareness, the same mechanism that creates profits can just as easily generate losses.
WHAT FLORK TELLS US ABOUT THE BROADER MARKET
The FLORK surge reflects a broader shift in market behavior. When dormant tokens begin rising thousands of percent in hours, it signals that speculative capital is actively searching for high-risk, high-reward opportunities.
It also indicates that traditional crypto assets are not currently providing the level of returns that risk-seeking traders are looking for. As a result, capital rotates into meme coins where volatility creates the potential for outsized gains.
At the same time, it highlights the increasing importance of narrative, culture, and social momentum in financial markets. The ability to capture attention has become just as important as any technical or fundamental factor.
CONCLUSION — A SNAPSHOT OF A SPECULATIVE MARKET AT FULL SPEED
The rise of FLORK is not just a story about a meme coin. It is a snapshot of a market operating at maximum speculative intensity. It shows how quickly capital can move, how powerful cultural narratives can be, and how fragile value becomes when it is built entirely on momentum.
This is the reality of the meme coin ecosystem in 2026. Fast, unpredictable, driven by attention, and capable of creating both extraordinary gains and equally dramatic losses within hours.
Understanding that reality is the difference between observing the market and being caught off guard by it.
repost-content-media
  • Reward
  • Comment
  • Repost
  • Share
#ETHMemeCoinFLORKSurges
ETH MEME COIN FLORK SURGES — A COMPLETE AND DEEPLY DETAILED ANALYSIS OF THE EXPLOSIVE RISE, THE CULTURE BEHIND IT, AND WHAT IT REVEALS ABOUT ETHEREUM'S MEME SEASON
INTRODUCTION — WHEN A THREE-YEAR-OLD CONTRACT WAKES UP
In the fast-moving world of cryptocurrency, few stories are as dramatic, as instructive, and as revealing about how speculative markets work as what just happened with FLORK. A meme coin that sat dormant on the Ethereum blockchain for over three years, virtually unnoticed, with almost no trading activity, suddenly exploded into one of the most talked-abo
post-image
  • Reward
  • 1
  • Repost
  • Share
HighAmbition:
good 👍
#ETHMemeCoinFLORKSurges
#ETHMemeCoinFLORKSurges — Pro Trading Blueprint (Deep Dive)
What you’ve outlined is already a strong framework. Now let’s turn it into a professional-grade, deeply explained trading playbook—the kind experienced traders actually follow when dealing with high-volatility meme assets inside the Ethereum ecosystem.
This isn’t just about levels. It’s about understanding behavior, timing execution, and controlling risk under pressure.
---
📊 1. Current Market Snapshot — Understanding the Battlefield
Before placing a single trade, a professional trader reads context, not just
ETH-0,58%
Vortex_King
#ETHMemeCoinFLORKSurges
#ETHMemeCoinFLORKSurges — Pro Trading Blueprint (Deep Dive)
What you’ve outlined is already a strong framework. Now let’s turn it into a professional-grade, deeply explained trading playbook—the kind experienced traders actually follow when dealing with high-volatility meme assets inside the Ethereum ecosystem.
This isn’t just about levels. It’s about understanding behavior, timing execution, and controlling risk under pressure.
---
📊 1. Current Market Snapshot — Understanding the Battlefield
Before placing a single trade, a professional trader reads context, not just price.
Right now, FLORK has shown a classic three-stage structure:
An impulsive vertical pump
A sharp pullback (profit-taking phase)
A stabilization range (decision zone)
The defined intraday range:
High ≈ 1.54e-05
Low ≈ 1.00e-05
This range is extremely important because it represents where buyers and sellers previously agreed on value.
In trading psychology terms:
The top (1.54e-05) = where sellers became dominant
The bottom (1.00e-05) = where buyers defended aggressively
Now price is compressing between these zones, meaning: 👉 The market is preparing for its next expansion move
This is exactly the phase where professionals position themselves—not during hype, but during stabilization.
---
🎯 2. Live Chart-Style Zones — The Real Logic Behind Levels
These zones are not random numbers. Each one represents liquidity, psychology, and order flow.
---
🟢 SUPPORT ZONES — Where Demand Lives
🔹 S1 – Immediate Support (1.08e-05 – 1.12e-05)
This is a micro support zone, formed during short-term consolidation.
What’s happening here:
Scalpers and short-term traders are actively buying dips
Small liquidity clusters are forming
Price reacts quickly but doesn’t stay long
This zone is not strong enough for long-term holds, but perfect for: 👉 Quick reaction trades (scalping)
If price keeps bouncing here repeatedly, it signals: ➡️ Buyers are still active
➡️ Momentum is not dead yet
---
🔹 S2 – Strong Pullback Zone (0.98e-05 – 1.05e-05)
This is the most important zone in the entire structure.
Why?
Because it aligns with:
Previous demand area
Psychological round level (~1.00e-05)
High-volume accumulation zone
This is where: 👉 Smart money typically enters
👉 Weak hands already exited
When price returns here, two things happen:
1. Retail panics (“it’s dumping”)
2. Professionals accumulate quietly
That’s why this is your: ✅ Best swing entry zone
---
🔹 S3 – Deep Support (0.85e-05 – 0.95e-05)
This is a make-or-break zone.
If price reaches here:
Either strong reversal (capitulation bounce)
Or full trend breakdown
This zone represents: 👉 Maximum fear in the market
Only experienced traders operate here because:
Volatility is extreme
Direction is uncertain
---
🔴 RESISTANCE ZONES — Where Supply Takes Over
---
🔹 R1 – Local Resistance (1.30e-05 – 1.35e-05)
This is where price previously failed to continue upward.
Meaning:
Sellers are waiting here
Early buyers take profits here
If price approaches this zone again: 👉 Expect hesitation or rejection
Only a high-volume breakout can clear this level.
---
🔹 R2 – Breakout Zone (1.50e-05 – 1.60e-05)
This is the gateway to continuation.
Why it matters:
Previous high = strong psychological barrier
Break above = new bullish leg
If this level breaks cleanly: 👉 It signals trend continuation, not just a bounce
---
🔹 R3 – Euphoria Zone (1.80e-05 – 2.10e-05)
This is where:
Retail FOMO peaks
Smart money exits
This zone is driven by emotion, not logic.
Professionals don’t buy here—they: 👉 Sell into strength
---
🚀 3. Trade Setups — Turning Analysis into Action
Now we convert structure into real executable trades.
---
✅ SETUP 1: Safe Swing Trade
This is the highest probability setup.
Entry:
1.00e-05 – 1.05e-05
You’re buying:
Near strong support
After panic selling
Before momentum returns
---
Stop Loss:
0.92e-05
This is placed:
Below structure
Where your trade idea becomes invalid
---
Take Profit Strategy:
TP1: 1.30e-05 → reduce risk
TP2: 1.50e-05 → secure gains
TP3: 1.80e-05 → maximize move
---
Deep Logic:
This trade works because:
You’re entering where risk is lowest
You’re exiting where others get greedy
👉 That’s professional positioning
---
⚡ SETUP 2: Breakout Trade
This is a momentum-based strategy.
Entry:
Above 1.35e-05, but ONLY if:
Strong volume
Clean candle close
---
Stop Loss:
1.25e-05
---
Take Profit:
TP1: 1.50e-05
TP2: 1.70e-05
TP3: 2.00e-05
---
Deep Logic:
You’re not predicting—you’re reacting.
This trade captures: 👉 Expansion phase after consolidation
But remember: ⚠️ Most breakouts fail without volume
---
🔥 SETUP 3: Scalping Strategy
This is for fast execution traders.
Entry:
Near 1.08e-05 bounce
---
Stop Loss:
1.03e-05
---
Take Profit:
1.15e-05 – 1.22e-05
---
Deep Logic:
You’re exploiting:
Small inefficiencies
Short-term reactions
This is not about big moves—it’s about: 👉 Consistency
---
🧠 4. Smart Money Behavior — Reading the Invisible
Markets don’t move randomly. Large players control flow.
Key signs of accumulation:
Sudden strong bounce from S2
High volume without news
Price refuses to drop further
This means: 👉 Big players are buying quietly
---
Bear Trap Insight
If price:
Dumps aggressively
Then recovers instantly
That’s a liquidity grab
It traps sellers, then: 👉 Price moves upward fast
---
⚠️ 5. Trap Zones — Where Most Traders Lose
Meme coins are designed to punish emotional trading.
---
❌ Avoid Buying:
Near 1.50e-05 resistance
During vertical green candles
Why?
Because: 👉 You’re buying from smart money, not with them
---
🚨 Fake Breakouts
Classic trap:
Price breaks resistance
No volume
Immediate rejection
Result: 👉 Retail loses, whales win
---
📊 6. Scenario Planning — Thinking Ahead
---
🟢 Bullish Case
If price:
Holds above 1.05e-05
Breaks 1.35e-05
Then: 👉 Momentum continues toward 2.00e-05+
---
🔴 Bearish Case
If price:
Breaks 0.98e-05
Then: 👉 Expect drop toward 0.85e-05
---
⚖️ 7. Risk Management — The Real Edge
Most traders fail here, not in analysis.
Rules:
Risk only 1–2% per trade
Never average down blindly
Always define exit before entry
---
Core Principle:
👉 Survival > Profit
---
🧩 8. Execution Plan — Professional Workflow
A disciplined trader follows process, not emotion:
1. Mark zones clearl
2. Wait patiently (no rush)
3. Confirm with:
Volume
Price behavio
4. Enter with plan
5. Set SL instantly
6. Take profits step-by-step
🧠 Final Edge Insight
FLORK behaves exactly like early runs of Dogecoin and Shiba Inu:
Explosive growth
Violent pullbacks
Emotion-driven moves
The difference between winners and losers is simple:
👉 Winners follow structure
👉 Losers follow hype
---
🏁 Closing Thought
This is not just a trade—it’s a probability game under uncertainty.
You don’t need to catch the whole move.
You just need to:
Enter smart
Manage risk
Exit with discipline
That’s how professionals extract profit from chaos.
repost-content-media
  • Reward
  • Comment
  • Repost
  • Share
#ETHMemeCoinFLORKSurges
ETH Meme Coin FLORK: The Surge That Captured Trader Attention
The cryptocurrency market has witnessed another remarkable meme coin phenomenon with FLORK, an Ethereum-based token that has experienced explosive growth in recent days. This article provides a comprehensive analysis of the surge, current pricing, forecast expectations, and strategic trading approaches that traders are currently considering.
Understanding the FLORK Surge
FLORK represents a fascinating case study in the meme coin sector. According to recent market data, this Ethereum chain meme coin achieved
ETH-0,58%
HighAmbition
#ETHMemeCoinFLORKSurges
ETH Meme Coin FLORK: The Surge That Captured Trader Attention
The cryptocurrency market has witnessed another remarkable meme coin phenomenon with FLORK, an Ethereum-based token that has experienced explosive growth in recent days. This article provides a comprehensive analysis of the surge, current pricing, forecast expectations, and strategic trading approaches that traders are currently considering.
Understanding the FLORK Surge
FLORK represents a fascinating case study in the meme coin sector. According to recent market data, this Ethereum chain meme coin achieved an extraordinary 80% surge within just one hour, pushing its market capitalization beyond $15 million at its peak. The token has demonstrated remarkable resilience with a 24-hour gain exceeding 110% and trading volume reaching $11.2 million during the same period. At current levels, FLORK maintains a market cap around $12.7 million, showing sustained interest from the trading community.
The surge was not merely a random pump but was catalyzed by significant social media exposure. The token gained substantial traction when Nikita Bier, Head of Product at X (formerly Twitter), featured the Flork logo in a video demonstration for the platform's new Custom Timelines feature. This exposure transformed FLORK from an obscure token trading around $100,000-$116,000 market cap into a multi-million dollar asset, delivering over 100x returns for early adopters who recognized the narrative potential.
Current Price Position and Market Structure
As of the latest data, FLORK trades at approximately $0.000108 with significant volatility characteristics typical of meme coins. The token has established a 24-hour trading range between $0.000028 and $0.000110, demonstrating the extreme price swings that define this asset class. The current market capitalization stands at approximately $12-13 million, positioning it as a mid-tier meme coin with room for further appreciation.
The trading volume of $11.2 million in 24 hours indicates strong liquidity and active market participation. This volume level suggests genuine trading interest rather than artificial pumping, providing some confidence for traders considering entry positions. The token has also secured listings on centralized exchanges including KCEX and Poloniex, expanding accessibility beyond decentralized platforms.
Price Forecast and Growth Potential
Analysts and market observers have presented varying forecasts for FLORK's trajectory. Conservative estimates suggest the token could reach $0.000333 by 2025, representing modest growth from current levels. However, more optimistic projections based on meme coin historical patterns indicate potential for significantly higher valuations if the narrative momentum continues.
The technical setup suggests FLORK could experience further appreciation if it maintains community engagement and social media presence. Targets in the $25-50 million market cap range appear achievable if the current momentum persists, representing potential gains of 2-4x from current levels. Some community members speculate about even higher valuations, though such projections remain highly speculative and dependent on continued viral growth.
Traders should note that FLORK has already demonstrated the ability to recover from significant pullbacks. After reaching peaks around $15-18 million market cap, the token experienced corrections to approximately $3-8 million range before stabilizing and showing signs of renewed accumulation. This pattern suggests underlying support from committed holders who believe in the token's longer-term potential.
Trading Strategy Considerations
Successful trading of FLORK requires understanding the unique dynamics of meme coin markets. The following strategic approaches have emerged from analyzing trader behavior and market patterns:
Entry strategies should focus on either breakout momentum or strategic dip buying. Breakout entries work best when the token closes above recent resistance levels with volume confirmation exceeding twice the average hourly trading activity. Dip buying opportunities emerge during 20-40% corrections from recent highs, particularly when support levels around $6-8 million market cap are tested.
Risk management remains paramount given the extreme volatility inherent in meme coins. Position sizing should remain conservative, with individual trades representing no more than 1-2% of total portfolio value. Stop-loss levels should be established 15-25% below entry points to protect against rapid drawdowns that can occur when sentiment shifts.
Profit-taking strategies benefit from tiered approaches rather than single exit points. Taking 30% of position off at 1.5x gains locks in initial profits while maintaining exposure to further upside. Additional 30% can be removed at 3x targets, with final 40% reserved for potential moonshot scenarios if the token achieves $50 million or higher valuations.
Timing considerations favor high-liquidity periods during US and European trading sessions. Weekend trading often shows reduced volume and increased volatility, making position management more challenging. Traders should monitor social media sentiment continuously, as meme coins derive significant value from community engagement and viral narrative development.
What Traders Are Thinking
The trader community exhibits mixed but generally optimistic sentiment toward FLORK. Bullish participants emphasize the token's OG status on Ethereum, the X platform connection through Nikita Bier's involvement, and the organic community growth that has developed around the Flork frog meme narrative. The token's association with X's unofficial meme category positioning provides a unique value proposition that distinguishes it from countless other meme coins.
Concerns among more cautious traders center on the typical risks associated with meme coin investments. The lack of fundamental utility, dependence on social media sentiment, and history of dramatic price corrections create significant downside risks. Some traders note that FLORK's rapid appreciation may have already captured much of the easy gains, leaving limited upside for late entrants.
The broader ETH meme coin ecosystem currently shows rotation patterns, with traders moving between tokens like ASTEROID, PUNK, WOJAK, and FLORK based on which narrative gains temporary dominance. FLORK's positioning as a potential X platform mascot gives it staying power that many competitors lack, though this advantage requires continued validation through platform developments and community engagement.
Next Steps and Strategic Planning
Traders considering FLORK should establish clear entry criteria based on technical levels and volume patterns. Current support zones around $8-9 million market cap offer potential accumulation opportunities, while resistance near previous highs around $15-18 million will test the strength of bullish conviction.
Monitoring tools should include DexScreener for real-time price action, BubbleMaps for whale wallet tracking, and LunarCrush for social sentiment analysis. X platform monitoring remains essential given the token's dependence on social media narrative development.
The path forward for FLORK depends heavily on continued community engagement and any additional endorsements or integrations with the X platform. Traders should remain prepared for extreme volatility, with price swings of 50% or more occurring within single trading sessions. Success in this market requires emotional discipline, strict risk management, and willingness to exit positions when momentum shifts regardless of unrealized gains.
FLORK represents the high-risk, high-reward nature of meme coin trading in its purest form. While the surge has already delivered life-changing returns for early participants, the token's future trajectory remains highly uncertain and dependent on factors largely outside traditional financial analysis. Traders should approach with appropriate position sizing, clear risk parameters, and full awareness that meme coins can lose 90% or more of their value rapidly when sentiment turns negative.
repost-content-media
  • Reward
  • Comment
  • Repost
  • Share
#ETHMemeCoinFLORKSurges 🚀🐸
The meme coin wave is back — and FLORK is stealing the spotlight 👀🔥
Built on Ethereum, this trending token is seeing a massive surge in attention and price action 📈⚡
💥 What’s driving the hype?
• Strong community buzz 🗣️
• Social media momentum 📲
• FOMO kicking in 🚀
• Speculative trading activity 🎯
🔥 Market vibes:
Rapid gains 📈 can attract more traders, but volatility remains extremely high ⚠️📉📈
📊 Reality check:
Meme coins can pump fast — and drop even faster ⚡
Timing, strategy, and risk management are key 🧠
💡 Smart approach:
✔ Don’t invest more than
ETH-0,58%
PUMP-2,62%
post-image
  • Reward
  • 3
  • Repost
  • Share
AylaShinex:
LFG 🔥
View More
#ETHMemeCoinFLORKSurges
ETH Meme Coin FLORK: The Surge That Captured Trader Attention
The cryptocurrency market has witnessed another remarkable meme coin phenomenon with FLORK, an Ethereum-based token that has experienced explosive growth in recent days. This article provides a comprehensive analysis of the surge, current pricing, forecast expectations, and strategic trading approaches that traders are currently considering.
Understanding the FLORK Surge
FLORK represents a fascinating case study in the meme coin sector. According to recent market data, this Ethereum chain meme coin achieved
HighAmbition
#ETHMemeCoinFLORKSurges
ETH Meme Coin FLORK: The Surge That Captured Trader Attention
The cryptocurrency market has witnessed another remarkable meme coin phenomenon with FLORK, an Ethereum-based token that has experienced explosive growth in recent days. This article provides a comprehensive analysis of the surge, current pricing, forecast expectations, and strategic trading approaches that traders are currently considering.
Understanding the FLORK Surge
FLORK represents a fascinating case study in the meme coin sector. According to recent market data, this Ethereum chain meme coin achieved an extraordinary 80% surge within just one hour, pushing its market capitalization beyond $15 million at its peak. The token has demonstrated remarkable resilience with a 24-hour gain exceeding 110% and trading volume reaching $11.2 million during the same period. At current levels, FLORK maintains a market cap around $12.7 million, showing sustained interest from the trading community.
The surge was not merely a random pump but was catalyzed by significant social media exposure. The token gained substantial traction when Nikita Bier, Head of Product at X (formerly Twitter), featured the Flork logo in a video demonstration for the platform's new Custom Timelines feature. This exposure transformed FLORK from an obscure token trading around $100,000-$116,000 market cap into a multi-million dollar asset, delivering over 100x returns for early adopters who recognized the narrative potential.
Current Price Position and Market Structure
As of the latest data, FLORK trades at approximately $0.000108 with significant volatility characteristics typical of meme coins. The token has established a 24-hour trading range between $0.000028 and $0.000110, demonstrating the extreme price swings that define this asset class. The current market capitalization stands at approximately $12-13 million, positioning it as a mid-tier meme coin with room for further appreciation.
The trading volume of $11.2 million in 24 hours indicates strong liquidity and active market participation. This volume level suggests genuine trading interest rather than artificial pumping, providing some confidence for traders considering entry positions. The token has also secured listings on centralized exchanges including KCEX and Poloniex, expanding accessibility beyond decentralized platforms.
Price Forecast and Growth Potential
Analysts and market observers have presented varying forecasts for FLORK's trajectory. Conservative estimates suggest the token could reach $0.000333 by 2025, representing modest growth from current levels. However, more optimistic projections based on meme coin historical patterns indicate potential for significantly higher valuations if the narrative momentum continues.
The technical setup suggests FLORK could experience further appreciation if it maintains community engagement and social media presence. Targets in the $25-50 million market cap range appear achievable if the current momentum persists, representing potential gains of 2-4x from current levels. Some community members speculate about even higher valuations, though such projections remain highly speculative and dependent on continued viral growth.
Traders should note that FLORK has already demonstrated the ability to recover from significant pullbacks. After reaching peaks around $15-18 million market cap, the token experienced corrections to approximately $3-8 million range before stabilizing and showing signs of renewed accumulation. This pattern suggests underlying support from committed holders who believe in the token's longer-term potential.
Trading Strategy Considerations
Successful trading of FLORK requires understanding the unique dynamics of meme coin markets. The following strategic approaches have emerged from analyzing trader behavior and market patterns:
Entry strategies should focus on either breakout momentum or strategic dip buying. Breakout entries work best when the token closes above recent resistance levels with volume confirmation exceeding twice the average hourly trading activity. Dip buying opportunities emerge during 20-40% corrections from recent highs, particularly when support levels around $6-8 million market cap are tested.
Risk management remains paramount given the extreme volatility inherent in meme coins. Position sizing should remain conservative, with individual trades representing no more than 1-2% of total portfolio value. Stop-loss levels should be established 15-25% below entry points to protect against rapid drawdowns that can occur when sentiment shifts.
Profit-taking strategies benefit from tiered approaches rather than single exit points. Taking 30% of position off at 1.5x gains locks in initial profits while maintaining exposure to further upside. Additional 30% can be removed at 3x targets, with final 40% reserved for potential moonshot scenarios if the token achieves $50 million or higher valuations.
Timing considerations favor high-liquidity periods during US and European trading sessions. Weekend trading often shows reduced volume and increased volatility, making position management more challenging. Traders should monitor social media sentiment continuously, as meme coins derive significant value from community engagement and viral narrative development.
What Traders Are Thinking
The trader community exhibits mixed but generally optimistic sentiment toward FLORK. Bullish participants emphasize the token's OG status on Ethereum, the X platform connection through Nikita Bier's involvement, and the organic community growth that has developed around the Flork frog meme narrative. The token's association with X's unofficial meme category positioning provides a unique value proposition that distinguishes it from countless other meme coins.
Concerns among more cautious traders center on the typical risks associated with meme coin investments. The lack of fundamental utility, dependence on social media sentiment, and history of dramatic price corrections create significant downside risks. Some traders note that FLORK's rapid appreciation may have already captured much of the easy gains, leaving limited upside for late entrants.
The broader ETH meme coin ecosystem currently shows rotation patterns, with traders moving between tokens like ASTEROID, PUNK, WOJAK, and FLORK based on which narrative gains temporary dominance. FLORK's positioning as a potential X platform mascot gives it staying power that many competitors lack, though this advantage requires continued validation through platform developments and community engagement.
Next Steps and Strategic Planning
Traders considering FLORK should establish clear entry criteria based on technical levels and volume patterns. Current support zones around $8-9 million market cap offer potential accumulation opportunities, while resistance near previous highs around $15-18 million will test the strength of bullish conviction.
Monitoring tools should include DexScreener for real-time price action, BubbleMaps for whale wallet tracking, and LunarCrush for social sentiment analysis. X platform monitoring remains essential given the token's dependence on social media narrative development.
The path forward for FLORK depends heavily on continued community engagement and any additional endorsements or integrations with the X platform. Traders should remain prepared for extreme volatility, with price swings of 50% or more occurring within single trading sessions. Success in this market requires emotional discipline, strict risk management, and willingness to exit positions when momentum shifts regardless of unrealized gains.
FLORK represents the high-risk, high-reward nature of meme coin trading in its purest form. While the surge has already delivered life-changing returns for early participants, the token's future trajectory remains highly uncertain and dependent on factors largely outside traditional financial analysis. Traders should approach with appropriate position sizing, clear risk parameters, and full awareness that meme coins can lose 90% or more of their value rapidly when sentiment turns negative.
repost-content-media
  • Reward
  • Comment
  • Repost
  • Share
#ETHMemeCoinFLORKSurges
If you’ve scrolled through Crypto Twitter or DeFi Telegram groups today, you’ve likely seen the hashtag #ETHMemeCoinFLORKSurges trending among degens and swing traders. In the past 48 hours, FLORK—a newly launched ERC-20 meme token—has exploded by over 1,400%, pushing its market cap from a quiet $2 million to nearly $30 million. But is this a legitimate community-driven pump, or just another coordinated dump waiting to happen?
Let’s break down what FLORK is, why it’s surging, and the risks you need to understand before even thinking about aping in.
What Is FLORK?
FLORK
ETH-0,58%
PEPE-0,07%
COQ-0,69%
BTC-0,71%
post-image
post-image
post-image
  • Reward
  • Comment
  • Repost
  • Share
#ETHMemeCoinFLORKSurges When Meme Energy Meets Market Momentum — Understanding the FLORK Wave
The crypto market has once again shifted into a phase where attention is rapidly rotating toward meme-driven assets, and FLORK’s recent surge on the Ethereum ecosystem is a clear example of how sentiment, liquidity, and narrative can converge to create sudden upward momentum. While many still dismiss meme coins as purely speculative assets, the reality is more layered they often reflect the strongest signals of retail engagement and market psychology at any given time.
FLORK’s movement is not just a
ETH-0,58%
post-image
  • Reward
  • 1
  • Repost
  • Share
NexaCrypto:
LFG 🔥
#ETHMemeCoinFLORKSurges
#ETHMemeCoinFLORKSurges — Pro Trading Blueprint (Deep Dive)
What you’ve outlined is already a strong framework. Now let’s turn it into a professional-grade, deeply explained trading playbook—the kind experienced traders actually follow when dealing with high-volatility meme assets inside the Ethereum ecosystem.
This isn’t just about levels. It’s about understanding behavior, timing execution, and controlling risk under pressure.
---
📊 1. Current Market Snapshot — Understanding the Battlefield
Before placing a single trade, a professional trader reads context, not just
ETH-0,58%
DOGE-0,01%
SHIB-0,24%
Vortex_King
#ETHMemeCoinFLORKSurges
#ETHMemeCoinFLORKSurges — Pro Trading Blueprint (Deep Dive)
What you’ve outlined is already a strong framework. Now let’s turn it into a professional-grade, deeply explained trading playbook—the kind experienced traders actually follow when dealing with high-volatility meme assets inside the Ethereum ecosystem.
This isn’t just about levels. It’s about understanding behavior, timing execution, and controlling risk under pressure.
---
📊 1. Current Market Snapshot — Understanding the Battlefield
Before placing a single trade, a professional trader reads context, not just price.
Right now, FLORK has shown a classic three-stage structure:
An impulsive vertical pump
A sharp pullback (profit-taking phase)
A stabilization range (decision zone)
The defined intraday range:
High ≈ 1.54e-05
Low ≈ 1.00e-05
This range is extremely important because it represents where buyers and sellers previously agreed on value.
In trading psychology terms:
The top (1.54e-05) = where sellers became dominant
The bottom (1.00e-05) = where buyers defended aggressively
Now price is compressing between these zones, meaning: 👉 The market is preparing for its next expansion move
This is exactly the phase where professionals position themselves—not during hype, but during stabilization.
---
🎯 2. Live Chart-Style Zones — The Real Logic Behind Levels
These zones are not random numbers. Each one represents liquidity, psychology, and order flow.
---
🟢 SUPPORT ZONES — Where Demand Lives
🔹 S1 – Immediate Support (1.08e-05 – 1.12e-05)
This is a micro support zone, formed during short-term consolidation.
What’s happening here:
Scalpers and short-term traders are actively buying dips
Small liquidity clusters are forming
Price reacts quickly but doesn’t stay long
This zone is not strong enough for long-term holds, but perfect for: 👉 Quick reaction trades (scalping)
If price keeps bouncing here repeatedly, it signals: ➡️ Buyers are still active
➡️ Momentum is not dead yet
---
🔹 S2 – Strong Pullback Zone (0.98e-05 – 1.05e-05)
This is the most important zone in the entire structure.
Why?
Because it aligns with:
Previous demand area
Psychological round level (~1.00e-05)
High-volume accumulation zone
This is where: 👉 Smart money typically enters
👉 Weak hands already exited
When price returns here, two things happen:
1. Retail panics (“it’s dumping”)
2. Professionals accumulate quietly
That’s why this is your: ✅ Best swing entry zone
---
🔹 S3 – Deep Support (0.85e-05 – 0.95e-05)
This is a make-or-break zone.
If price reaches here:
Either strong reversal (capitulation bounce)
Or full trend breakdown
This zone represents: 👉 Maximum fear in the market
Only experienced traders operate here because:
Volatility is extreme
Direction is uncertain
---
🔴 RESISTANCE ZONES — Where Supply Takes Over
---
🔹 R1 – Local Resistance (1.30e-05 – 1.35e-05)
This is where price previously failed to continue upward.
Meaning:
Sellers are waiting here
Early buyers take profits here
If price approaches this zone again: 👉 Expect hesitation or rejection
Only a high-volume breakout can clear this level.
---
🔹 R2 – Breakout Zone (1.50e-05 – 1.60e-05)
This is the gateway to continuation.
Why it matters:
Previous high = strong psychological barrier
Break above = new bullish leg
If this level breaks cleanly: 👉 It signals trend continuation, not just a bounce
---
🔹 R3 – Euphoria Zone (1.80e-05 – 2.10e-05)
This is where:
Retail FOMO peaks
Smart money exits
This zone is driven by emotion, not logic.
Professionals don’t buy here—they: 👉 Sell into strength
---
🚀 3. Trade Setups — Turning Analysis into Action
Now we convert structure into real executable trades.
---
✅ SETUP 1: Safe Swing Trade
This is the highest probability setup.
Entry:
1.00e-05 – 1.05e-05
You’re buying:
Near strong support
After panic selling
Before momentum returns
---
Stop Loss:
0.92e-05
This is placed:
Below structure
Where your trade idea becomes invalid
---
Take Profit Strategy:
TP1: 1.30e-05 → reduce risk
TP2: 1.50e-05 → secure gains
TP3: 1.80e-05 → maximize move
---
Deep Logic:
This trade works because:
You’re entering where risk is lowest
You’re exiting where others get greedy
👉 That’s professional positioning
---
⚡ SETUP 2: Breakout Trade
This is a momentum-based strategy.
Entry:
Above 1.35e-05, but ONLY if:
Strong volume
Clean candle close
---
Stop Loss:
1.25e-05
---
Take Profit:
TP1: 1.50e-05
TP2: 1.70e-05
TP3: 2.00e-05
---
Deep Logic:
You’re not predicting—you’re reacting.
This trade captures: 👉 Expansion phase after consolidation
But remember: ⚠️ Most breakouts fail without volume
---
🔥 SETUP 3: Scalping Strategy
This is for fast execution traders.
Entry:
Near 1.08e-05 bounce
---
Stop Loss:
1.03e-05
---
Take Profit:
1.15e-05 – 1.22e-05
---
Deep Logic:
You’re exploiting:
Small inefficiencies
Short-term reactions
This is not about big moves—it’s about: 👉 Consistency
---
🧠 4. Smart Money Behavior — Reading the Invisible
Markets don’t move randomly. Large players control flow.
Key signs of accumulation:
Sudden strong bounce from S2
High volume without news
Price refuses to drop further
This means: 👉 Big players are buying quietly
---
Bear Trap Insight
If price:
Dumps aggressively
Then recovers instantly
That’s a liquidity grab
It traps sellers, then: 👉 Price moves upward fast
---
⚠️ 5. Trap Zones — Where Most Traders Lose
Meme coins are designed to punish emotional trading.
---
❌ Avoid Buying:
Near 1.50e-05 resistance
During vertical green candles
Why?
Because: 👉 You’re buying from smart money, not with them
---
🚨 Fake Breakouts
Classic trap:
Price breaks resistance
No volume
Immediate rejection
Result: 👉 Retail loses, whales win
---
📊 6. Scenario Planning — Thinking Ahead
---
🟢 Bullish Case
If price:
Holds above 1.05e-05
Breaks 1.35e-05
Then: 👉 Momentum continues toward 2.00e-05+
---
🔴 Bearish Case
If price:
Breaks 0.98e-05
Then: 👉 Expect drop toward 0.85e-05
---
⚖️ 7. Risk Management — The Real Edge
Most traders fail here, not in analysis.
Rules:
Risk only 1–2% per trade
Never average down blindly
Always define exit before entry
---
Core Principle:
👉 Survival > Profit
---
🧩 8. Execution Plan — Professional Workflow
A disciplined trader follows process, not emotion:
1. Mark zones clearl
2. Wait patiently (no rush)
3. Confirm with:
Volume
Price behavio
4. Enter with plan
5. Set SL instantly
6. Take profits step-by-step
🧠 Final Edge Insight
FLORK behaves exactly like early runs of Dogecoin and Shiba Inu:
Explosive growth
Violent pullbacks
Emotion-driven moves
The difference between winners and losers is simple:
👉 Winners follow structure
👉 Losers follow hype
---
🏁 Closing Thought
This is not just a trade—it’s a probability game under uncertainty.
You don’t need to catch the whole move.
You just need to:
Enter smart
Manage risk
Exit with discipline
That’s how professionals extract profit from chaos.
repost-content-media
  • Reward
  • 1
  • Repost
  • Share
Falcon_Official:
To The Moon 🌕
#ETHMemeCoinFLORKSurges
#ETHMemeCoinFLORKSurges — Pro Trading Blueprint (Deep Dive)
What you’ve outlined is already a strong framework. Now let’s turn it into a professional-grade, deeply explained trading playbook—the kind experienced traders actually follow when dealing with high-volatility meme assets inside the Ethereum ecosystem.
This isn’t just about levels. It’s about understanding behavior, timing execution, and controlling risk under pressure.
---
📊 1. Current Market Snapshot — Understanding the Battlefield
Before placing a single trade, a professional trader reads context, not just
ETH-0,58%
DOGE-0,01%
SHIB-0,24%
post-image
post-image
  • Reward
  • 4
  • Repost
  • Share
Pheonixprincess:
LFG 🔥
View More
Load More