Shiba Inu remains bullish on higher timeframes, but a pullback appears likely.
Key Support levels: $0.0000077
Key Resistance levels: $0.0000084
1. Momentum Remains Bullish
On the three-day timeframe, SHIB continues to make higher highs and shows a clear bullish bias. However, it appears that a re-test of the current support at $0.0000077 is likely.
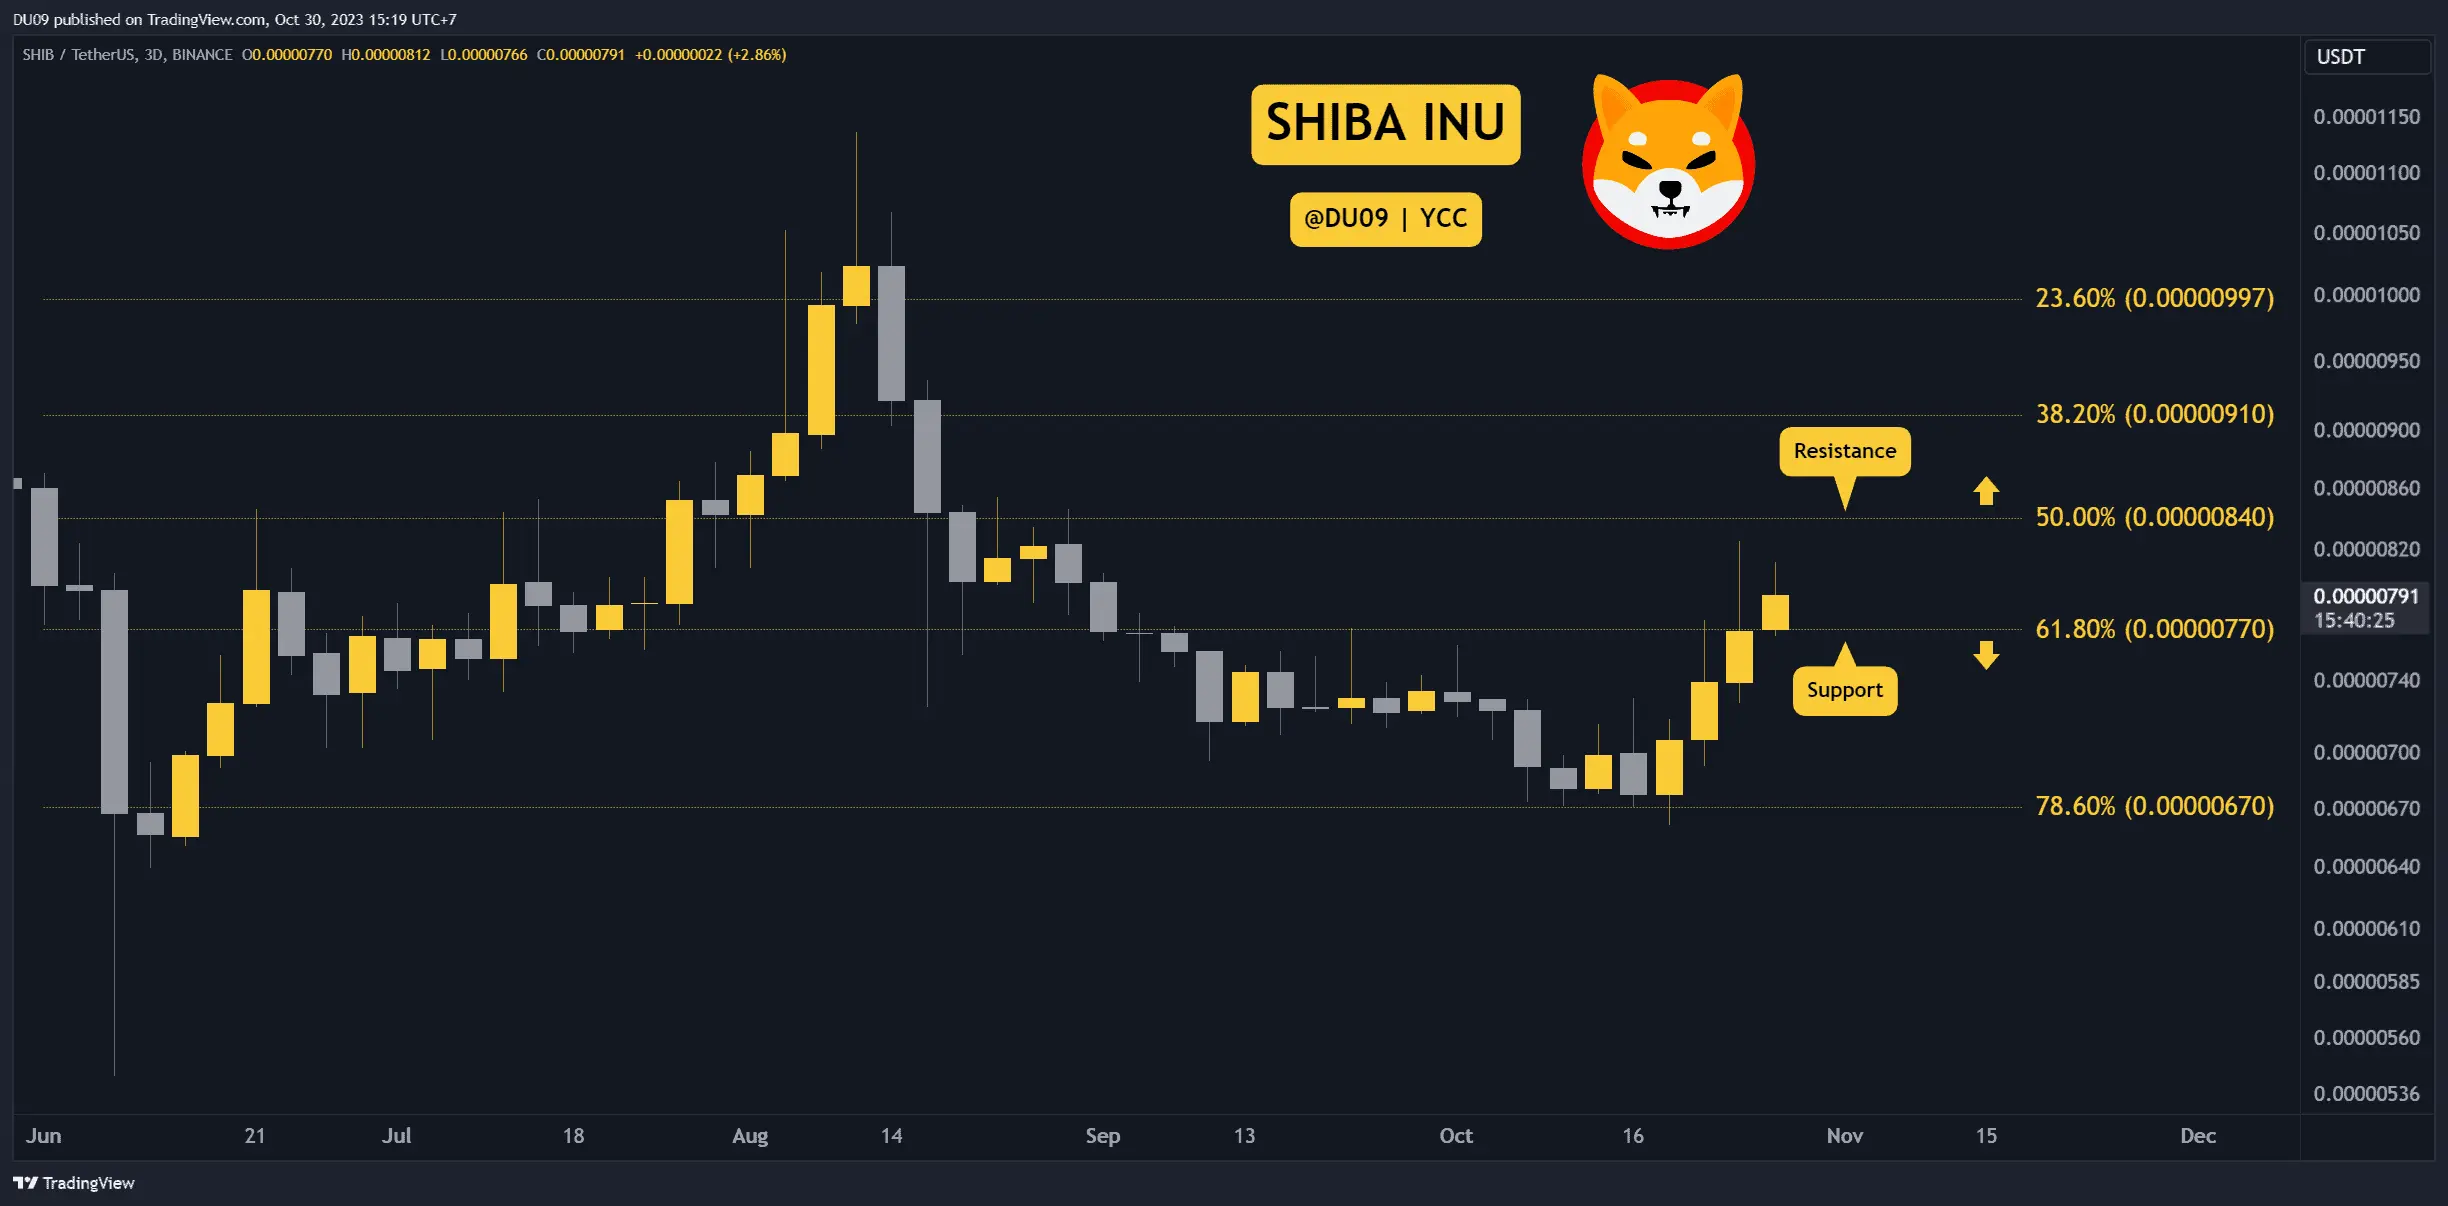 Chart by TradingView.## 2. Volume Falling
With a falling volume, the probability of a short pullback is high. This is why a test of the key support seems more likely at this time than a continuation of the price to the resistance at $0.0000084.
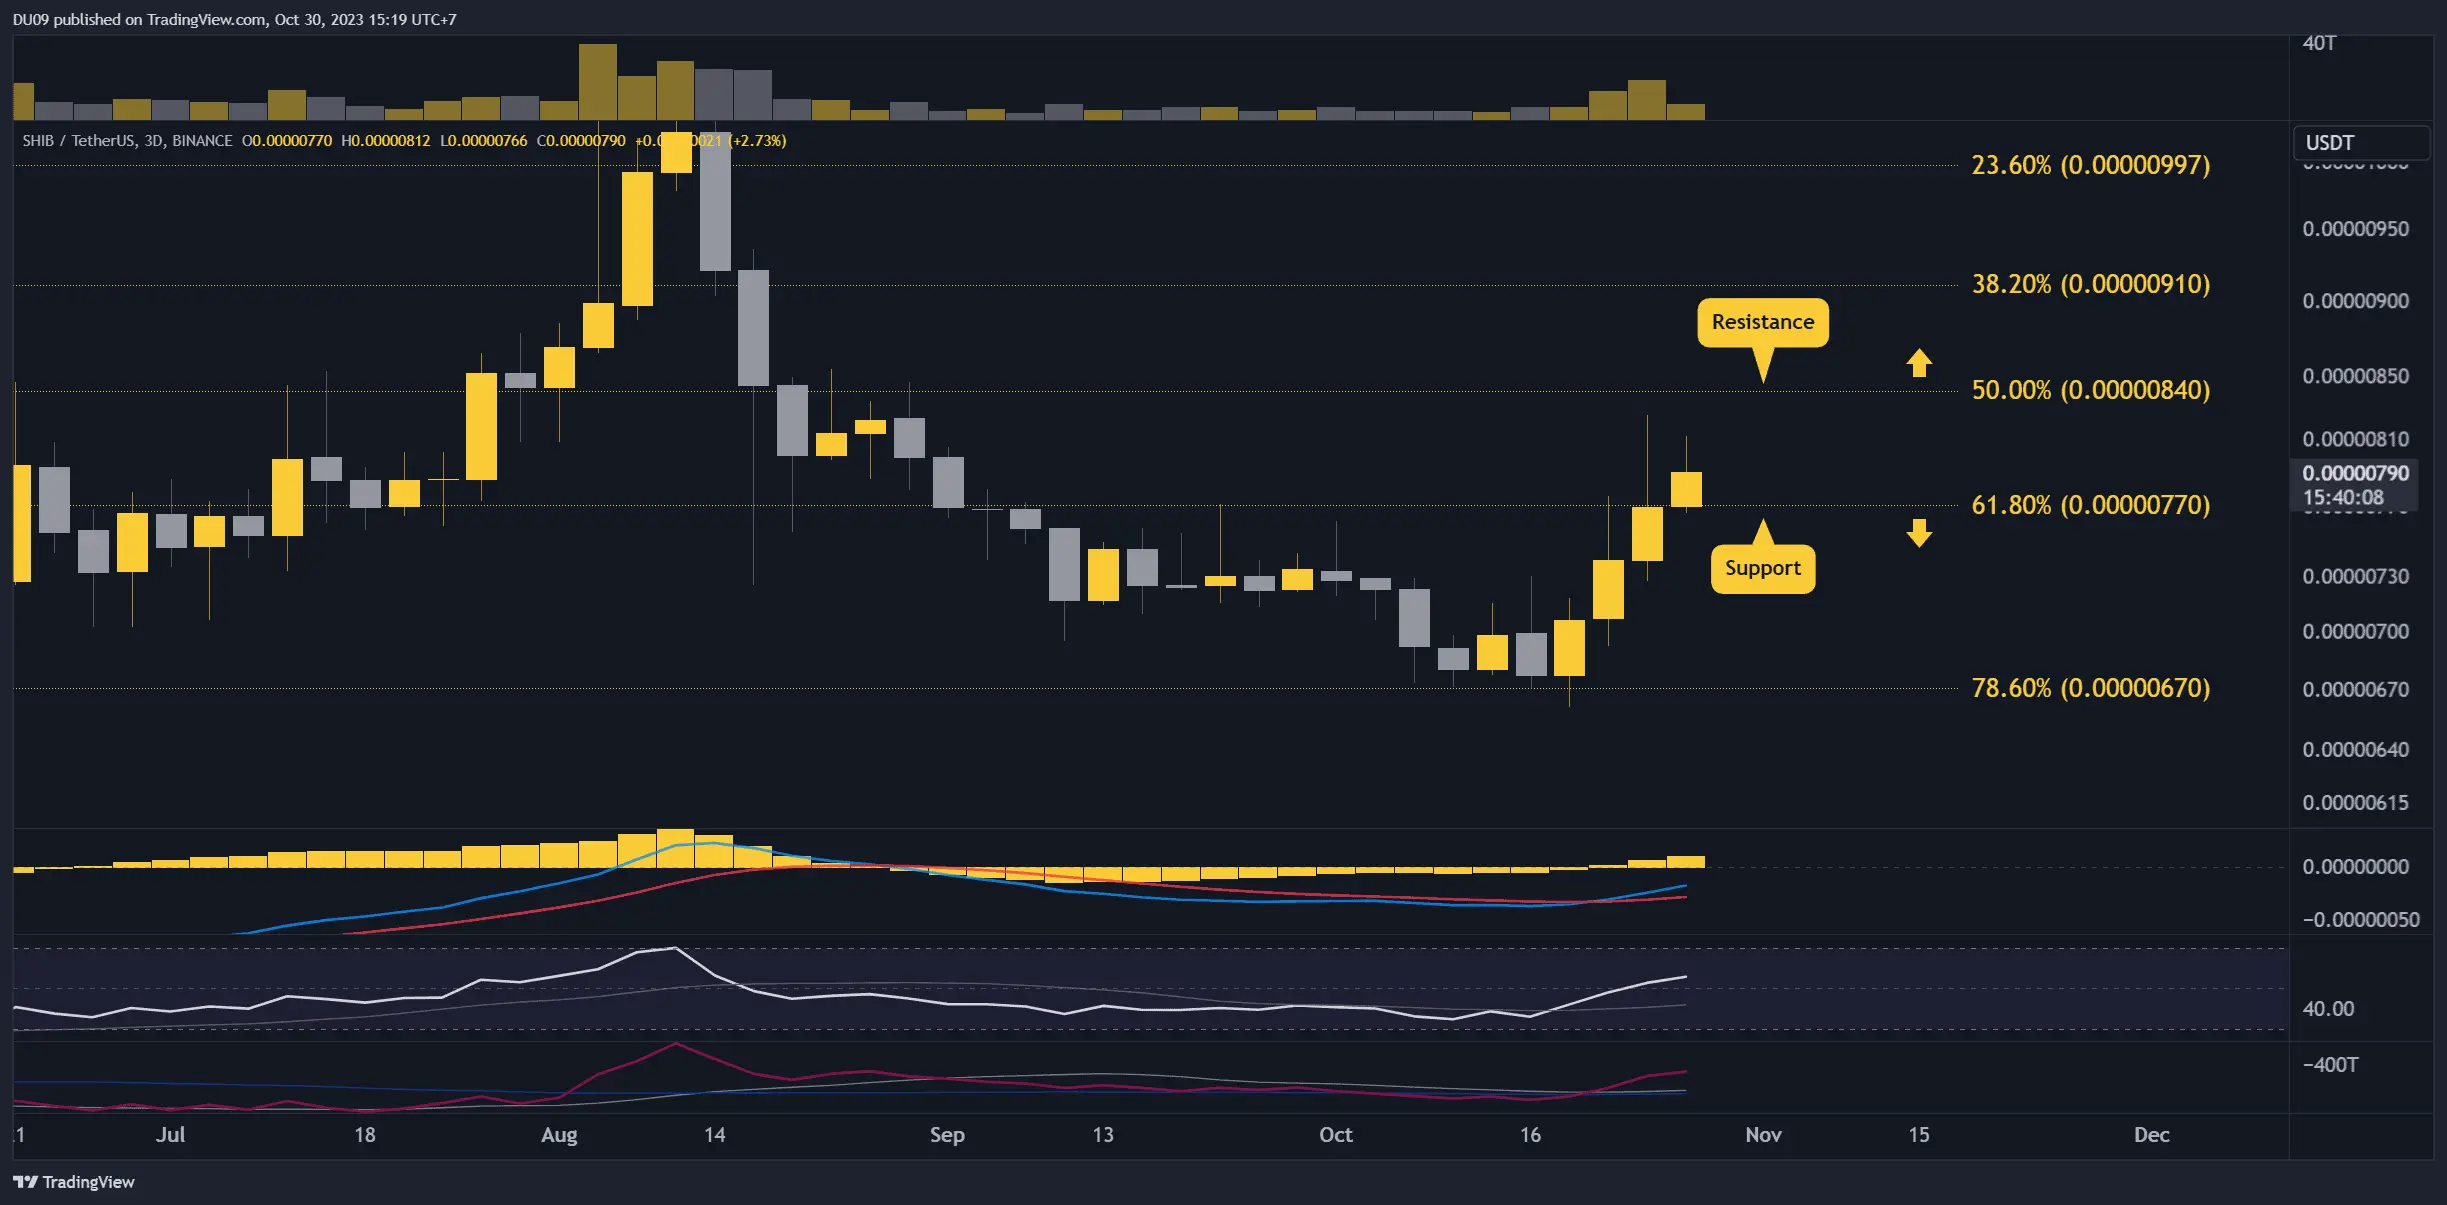 Chart by TradingView.## 3. RSI Lower High
The daily RSI has made a lower high which shows that SHIB may have reached a local top at the time of this post. If confirmed, then the price is likely to test the key support in the next few days.
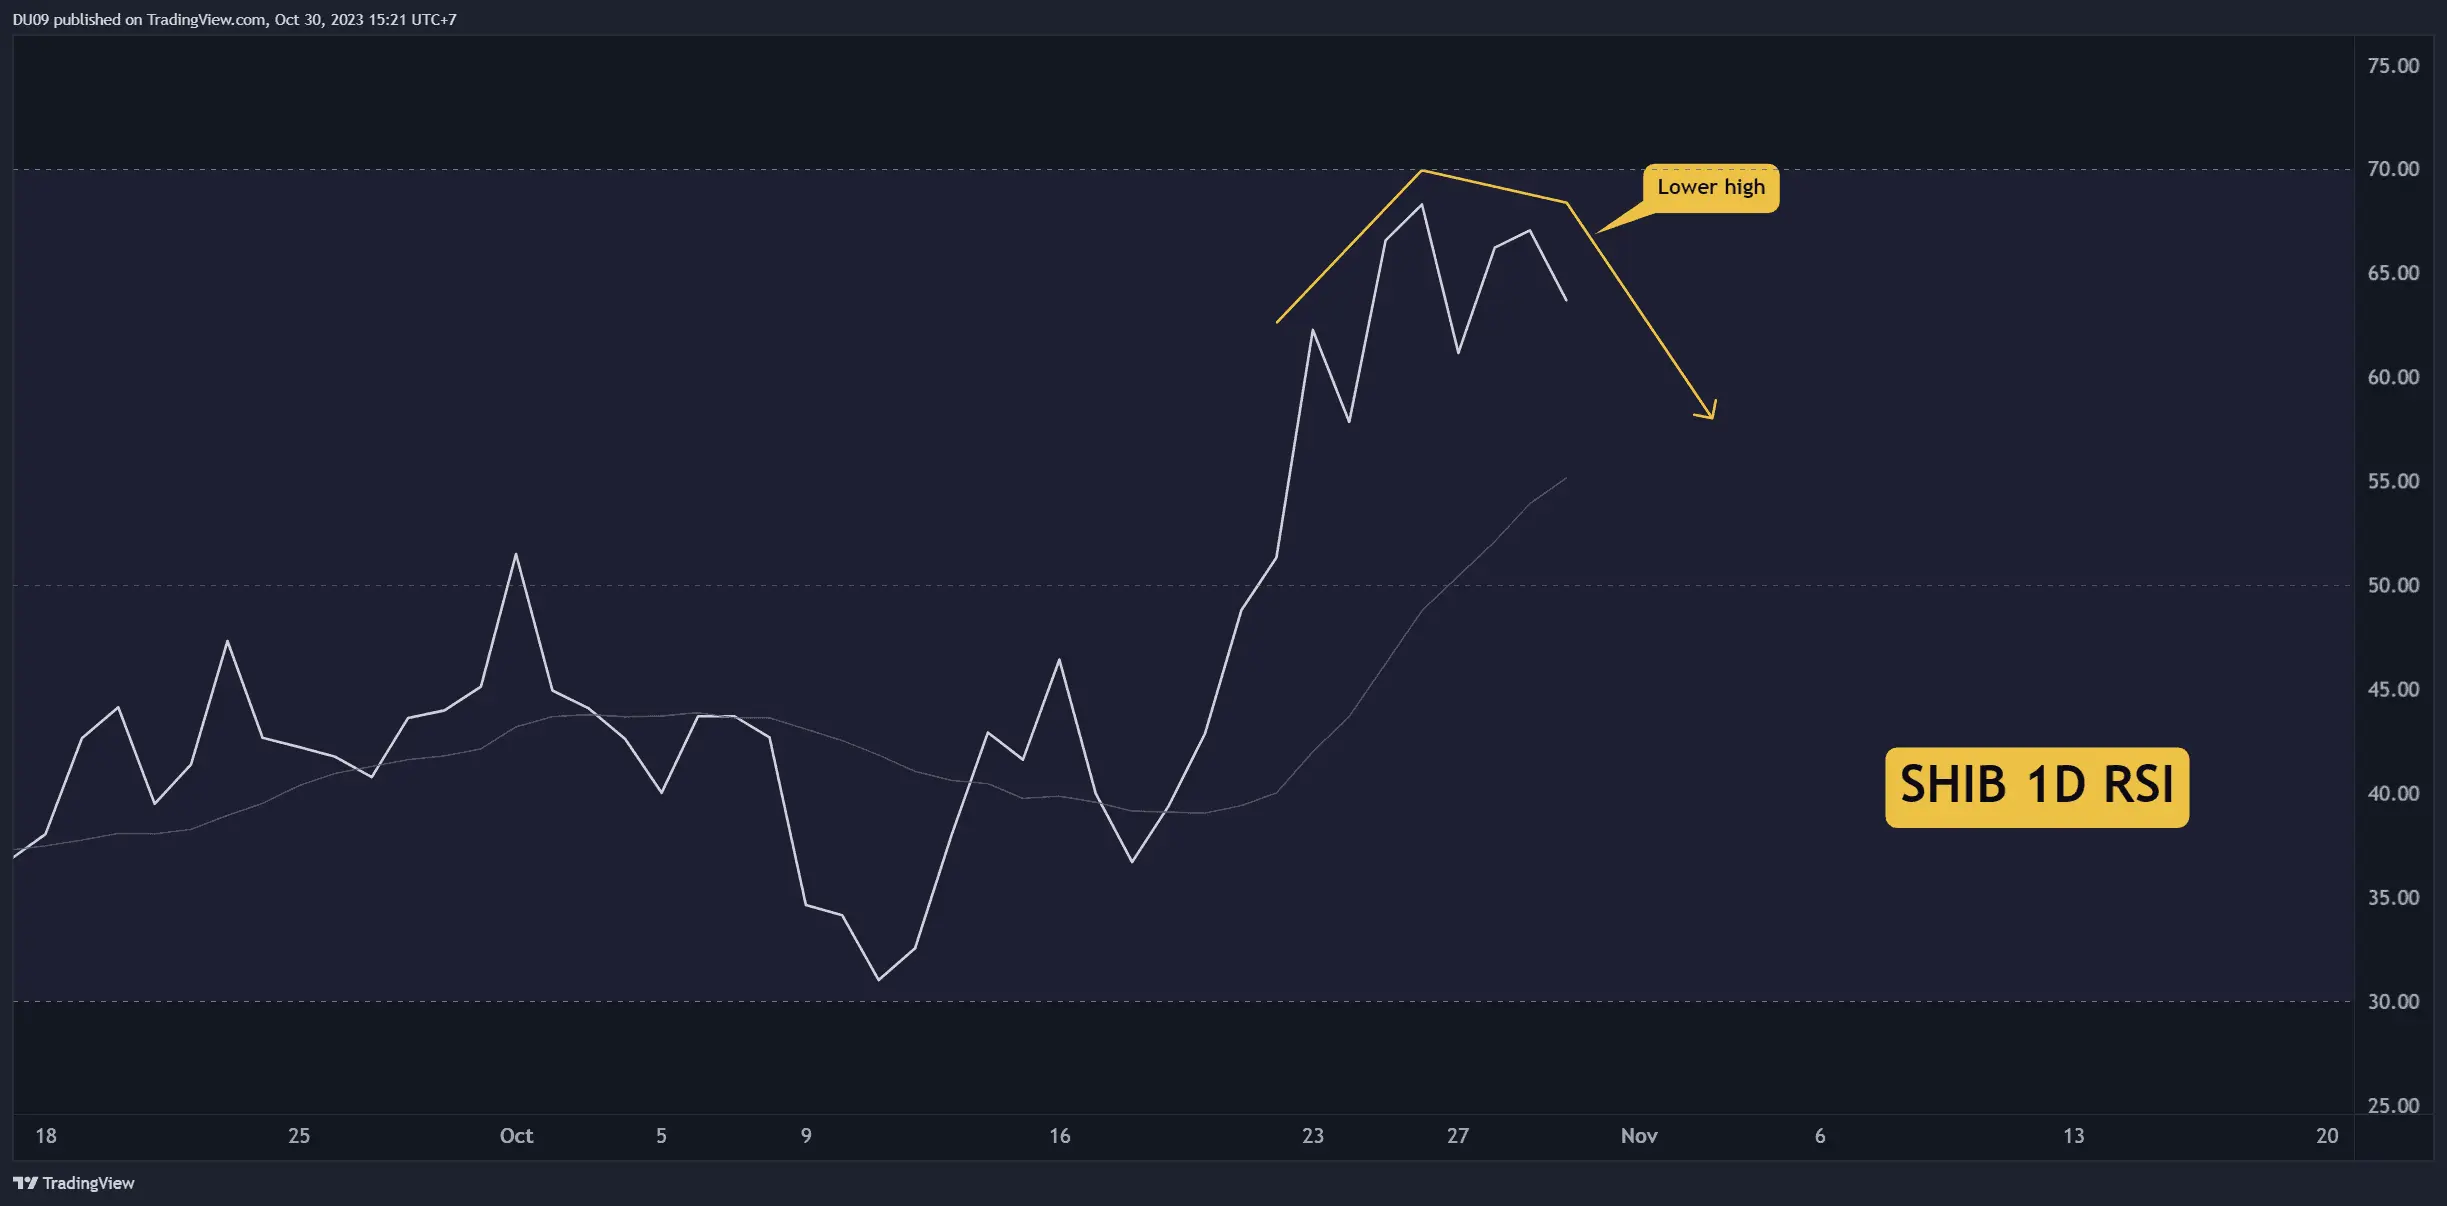 Chart by TradingView.## Bias
The bias for SHIB is bullish.
Short-Term Prediction for SHIB Price
As long as the key support at $0.0000077 holds, then this meme coin can still move higher after the pullback is completed.
Disclaimer: The information on this page may come from third parties and does not represent the views or opinions of Gate. The content displayed on this page is for reference only and does not constitute any financial, investment, or legal advice. Gate does not guarantee the accuracy or completeness of the information and shall not be liable for any losses arising from the use of this information. Virtual asset investments carry high risks and are subject to significant price volatility. You may lose all of your invested principal. Please fully understand the relevant risks and make prudent decisions based on your own financial situation and risk tolerance. For details, please refer to
Disclaimer.