Post content & earn content mining yield
placeholder
gatefun
gatefun
Trump issues another warning: If the voter bill fails to pass, he will halt signing all legislation — could crypto legislation be delayed?
gate liveLIVE
819
live-coin
  • Reward
  • 1
  • Repost
  • Share
LittleGodOfWealthPlutusvip:
Direct to the Moon!🌕🌛🌛
Doggy, where can you go up? Make room $BTC
BTC1,49%
View Original
post-image
  • Reward
  • 1
  • Repost
  • Share
从亿开始vip:
Have a question
#GateForAl
Gate Launches Gate CLI, a lightweight command-line trading tool designed specifically for developers, quantitative traders, and AI Agents.
Key Highlights:
🔹 Direct access to exchange functions: market data queries, order creation and management, account information retrieval
🔹 No need for complex API integration or programming
🔹 Capable of automatically executing trades based on strategy decisions
🔹 Supports deployment in servers, scripts, or CI environments
🔹 Multi-account management and flexible credential priority settings As a core component of the Gate for AI fram
post-image
Gate广场_Officialvip
Gate Launches Gate CLI, a lightweight command-line trading tool designed specifically for developers, quantitative traders, and AI Agents.
Key Highlights:
🔹 Direct access to exchange functions: market data queries, order creation and management, account information retrieval
🔹 No need for complex API integration or programming
🔹 Capable of automatically executing trades based on strategy decisions
🔹 Supports deployment in servers, scripts, or CI environments
🔹 Multi-account management and flexible credential priority settings
As a core component of the Gate for AI framework, combined with MCP and Skills modules, Gate CLI efficiently connects AI Agents with the market through a unified tool, making strategy execution faster, smarter, and easier.
Learn more: https://www.gate.com/announcements/article/50154
Explore Gate CLI: GitHub - gate/gate-cli: A command-line interface for the Gate API
#GateForAI #GateCLI
repost-content-media
  • Reward
  • 4
  • Repost
  • Share
xxx40xxxvip:
To The Moon 🌕
View More
Jarvis
Jarvis
Jarvis
gatefun
Created By@Irene
Listing Progress
0.14%
MC:
$2.46K
More Tokens
#CryptoMarketBouncesBack
The global financial and cryptocurrency markets have started to recover after several days of intense volatility that pushed investors into risk-off mode. Earlier this week, geopolitical tensions and a sharp surge in crude oil prices created strong uncertainty across global markets. This pressure triggered selling across cryptocurrencies, equities, and other risk assets as traders reduced exposure and waited for clearer macro signals.
However, sentiment began to stabilize as oil prices cooled and fears of a major geopolitical escalation eased. This improvement helped
BTC1,49%
ETH1,15%
SOL0,83%
XRP1,46%
post-image
post-image
post-image
  • Reward
  • 7
  • Repost
  • Share
Discoveryvip:
To The Moon 🌕
View More
I wanted to invest in gold in an easy and simple way, you can do so through Exchange-Traded Funds (ETFs).
Below are the details of one of the best gold ETFs in the American market:
Ticker: $GLD
Fees: 0.4%
Assets Under Management: $178 billion
2026 Return: 19.5%
Annual Return (5 Years): 24.4%
$USDG
#GateFebruaryTransparencyReport #InstitutionalCapitalImpactsMarketStructure
USDG0,01%
View Original
post-image
  • Reward
  • Comment
  • Repost
  • Share
#TrumpSaysIranConflictNearsEnd
A New Era in the Middle East: Trump’s Iran Statements and the Future of the Conflict
The US-Iran tension, one of the most volatile headlines in global politics, has seen critical developments in diplomacy and military strategy in recent days. The theme #TrumpSaysIranConflictNearsEnd, brought to the agenda through US President Donald Trump’s social media posts and press briefings, offers significant clues regarding the course of military operations in the region. Trump states that the process is nearing its conclusion, describing it as a "short-term excursion," w
  • Reward
  • 12
  • Repost
  • Share
CryptoSelfvip:
To The Moon 🌕
View More
$PI continues to rise, testing the 0.3 resistance level!
PI8,78%
View Original
post-image
  • Reward
  • Comment
  • Repost
  • Share
Technical View on Bitcoin: Bitcoin consolidates after sharp decline near key support
Bitcoin remains in a broader correction phase after failing to regain the resistance zone between $93,000 and $100,900, which corresponds to a Fibonacci correction cluster between 0.5 and 0.618. The repeated rejection from this supply area confirmed a structural breakdown, leading to a sharp decline toward lower demand levels.
The price recently dropped near the overall support at $60,000, which aligns with the Fibonacci level 0 at around $59,980. Currently, Bitcoin is consolidating around $69,000–$70,000, ind
BTC1,49%
View Original
post-image
asiftahsinvip
BTC Technical Outlook: Bitcoin Consolidates After Sharp Decline Near Key Support
Bitcoin remains in a broader corrective phase after failing to reclaim the $93,000–$100,900 resistance region, which aligns with the 0.5–0.618 Fibonacci retracement cluster. The repeated rejection from this supply zone confirmed a structural breakdown, leading to an aggressive decline toward lower demand levels.
Price recently dropped close to the $60,000 macro support, corresponding with the Fib 0 level near $59,980. BTC is currently consolidating around $69,000–$70,000, suggesting early stabilization after the sharp correction while the market attempts to establish a short-term base.
EMA Structure (Bearish to Neutral Bias)
20 EMA: $68,637
50 EMA: $73,157
100 EMA: $80,448
200 EMA: $88,706
Bitcoin continues to trade below the 50, 100, and 200 EMAs, while the 20 EMA around $68K is acting as immediate dynamic resistance.
The downward alignment of EMAs still reflects bearish pressure, though the compression between price and the short-term EMAs suggests the market may be entering a consolidation phase before the next directional move.
Fibonacci & Price Structure
0.786 Fib: $112,023
0.618 Fib: $100,899
0.5 Fib: $93,086
0.382 Fib: $85,273
0.236 Fib: $75,606
Fib 0: $59,980
BTC continues to trade below the 0.236 Fibonacci level at $75,606, confirming the broader corrective structure.
The recent bounce from the $60K demand zone indicates strong macro support. Current price action between $68K–$71K suggests accumulation or consolidation after the sharp selloff.
A sustained recovery above $73K–$75K would begin shifting momentum toward a broader corrective rebound, while a breakdown below $65K–$60K could trigger another downside expansion.
RSI Momentum
RSI is currently trading around 49–50, indicating neutral momentum.
The indicator has recovered significantly from oversold levels and is approaching the 50 equilibrium level, suggesting improving market balance but not yet confirming a bullish trend reversal.
📊 Key Levels
Resistance
$70,500–$73,000 (20/50 EMA zone)
$75,600 (0.236 Fib)
$85,200 (0.382 Fib)
Support
$69,000–$67,000 (short-term support)
$65,000–$60,000 (macro demand zone / cycle base)
RSI: 49–50 — neutral momentum
📌 Summary
Bitcoin is stabilizing after a sharp decline and currently consolidating near the $69K–$70K region above major cycle support. While downside momentum has slowed, the broader structure remains cautious below $75K.
A sustained recovery above $75K–$85K would signal the early stages of a broader corrective rebound. Until then, BTC is likely to remain in a consolidation phase between $65K and $73K as the market searches for direction after the recent selloff.
$BTC #CryptoMarketBouncesBack
repost-content-media
  • Reward
  • 3
  • Repost
  • Share
Moathalmahdivip:
Hold tight to 💪
View More
【Buy and Sell Entry Points】
- Buy Point 1: 2000 USDT (4-hour MACD momentum weakening, RSI entering neutral zone, indicating a short-term pullback. 2000 is an important psychological level, also close to the 4-hour EMA30 (2014.98) and EMA120 (2022.78) support areas, and resonates with the support formed at the low of 1991 on March 10 at 08:00.)
- Buy Point 2: 1980 USDT (If the pullback deepens, 1980 is the next important psychological support level, close to the low of 1978.92 on March 09 at 16:00, providing a deeper buying opportunity.)
- Long Position Stop Loss: 1970 USDT (Set below Buy
BTC1,48%
View Original
post-image
post-image
  • Reward
  • Comment
  • Repost
  • Share
The Bitcoin chart shows it currently trading above the middle band of the Bollinger Bands, approaching the upper band. In the short term, the bullish momentum is dominant. The Bollinger Bands are slightly opening after a period of contraction, indicating potential for further upward testing.
Short-term upward trend #BTC
BTC1,49%
View Original
  • Reward
  • Comment
  • Repost
  • Share
#CryptoMarketBouncesBack 📈🚀
After several days of heavy selling pressure, the crypto market is finally showing signs of recovery. Bitcoin has once again climbed above the $70K level, bringing back positive sentiment across the market.
The rebound appears to be driven by easing geopolitical tensions and a cooling in global energy prices. As uncertainty slightly fades, investors are gradually returning to risk assets like BTC and major altcoins.
📊 Market Snapshot • BTC moving back toward the $70K zone
• ETH holding strong above $2K
• Major altcoins showing mild recovery
Another important fact
BTC1,49%
ETH1,15%
post-image
  • Reward
  • 8
  • Repost
  • Share
xxx40xxxvip:
To The Moon 🌕
View More

According to the latest Forbes Rankings ⚡️🌟⚡️
$BNB
{future}(BNBUSDT)
BNB1,05%
post-image
  • Reward
  • Comment
  • Repost
  • Share
馬币火
馬币火
Malaysian Ringgit
gatefun
Created By@CryptoKing2026
Listing Progress
100.00%
MC:
$1.98K
More Tokens
#Gate2月透明度报告 Signal】Healthy pullback after a callback to add longs + Strong breakout at the 1H level
The 1H level just experienced a historic surge with massive volume, with a single candle rising over 25%, currently in a strong consolidation at high levels. The 4H level saw a massive bullish candle directly breaking through the long-term downtrend line, indicating a strong trend reversal signal. The current price is far from the 1H moving average, RSI shows overbought conditions, but open interest remains stable, indicating that major funds have not exited. This is a typical healthy pullbac
BLUAI29,07%
BTC1,49%
ETH1,15%
SOL0,83%
View Original
post-image
  • Reward
  • Comment
  • Repost
  • Share
#GoldAndSilverMoveHigher
The global precious metals market has recently entered a new phase of upward momentum, with both gold and silver moving higher as investors react to shifting economic conditions and geopolitical uncertainty. Across international markets, these two metals have once again reaffirmed their traditional role as strategic stores of value during periods of financial instability and macroeconomic transformation.
One of the primary forces behind the latest upward movement is the growing demand for safe-haven assets. When global markets experience volatility—whether due to geop
post-image
  • Reward
  • 14
  • Repost
  • Share
CryptoSelfvip:
Ape In 🚀
View More
#CryptoMarketBouncesBack
The global financial and cryptocurrency markets have started to recover after several days of intense volatility that pushed investors into risk-off mode. Earlier this week, geopolitical tensions and a sharp surge in crude oil prices created strong uncertainty across global markets. This pressure triggered selling across cryptocurrencies, equities, and other risk assets as traders reduced exposure and waited for clearer macro signals.
$BTC
BTC1,48%
post-image
HighAmbitionvip
#CryptoMarketBouncesBack
The global financial and cryptocurrency markets have started to recover after several days of intense volatility that pushed investors into risk-off mode. Earlier this week, geopolitical tensions and a sharp surge in crude oil prices created strong uncertainty across global markets. This pressure triggered selling across cryptocurrencies, equities, and other risk assets as traders reduced exposure and waited for clearer macro signals.
However, sentiment began to stabilize as oil prices cooled and fears of a major geopolitical escalation eased. This improvement helped restore confidence among investors and allowed capital to flow back into risk assets. As a result, the cryptocurrency market experienced a noticeable rebound led by Bitcoin, which pulled the broader market higher.
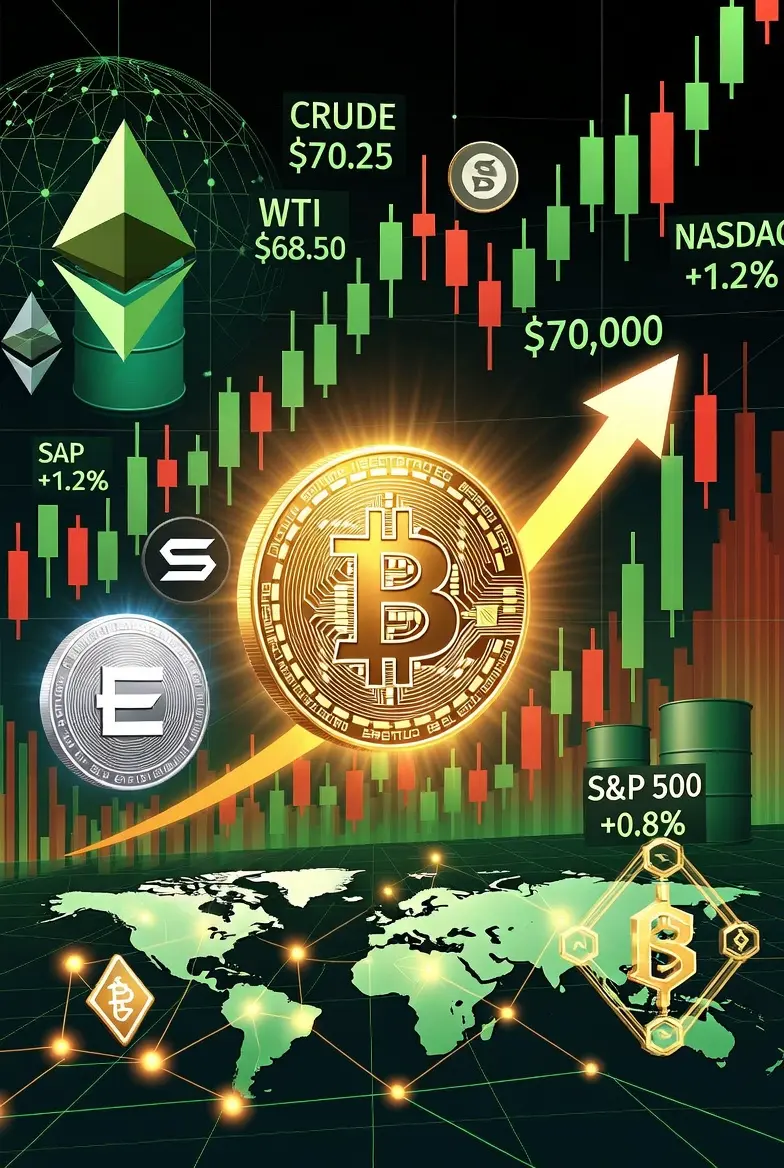
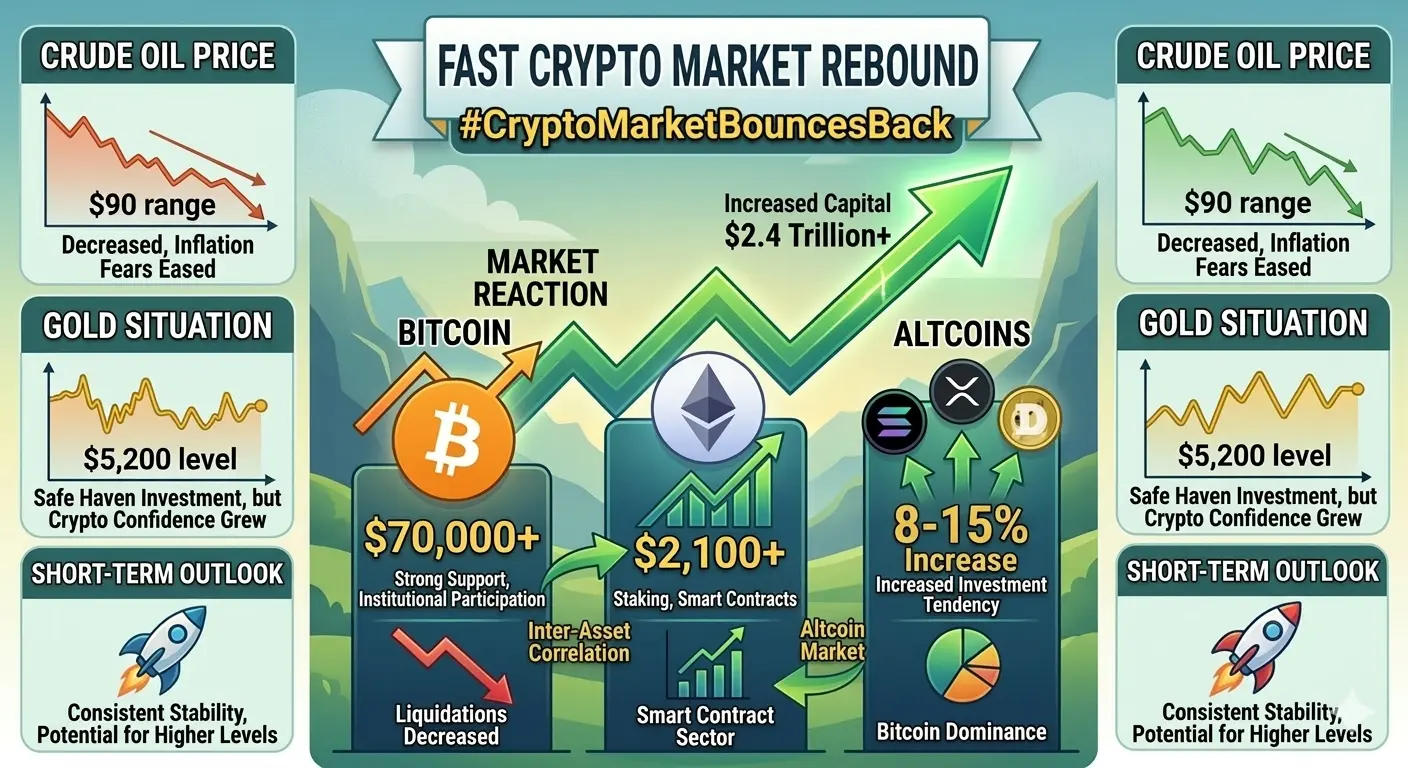
The total cryptocurrency market capitalization has recovered from around $2.2 trillion during the recent panic selling phase and is now moving back toward the $2.35–$2.4 trillion range. Trading activity has also increased across exchanges as both retail and institutional traders re-enter positions after the correction. While volatility remains present, the market rebound suggests buyers are still willing to defend key support zones across major cryptocurrencies.
🪙 Bitcoin Market Analysis
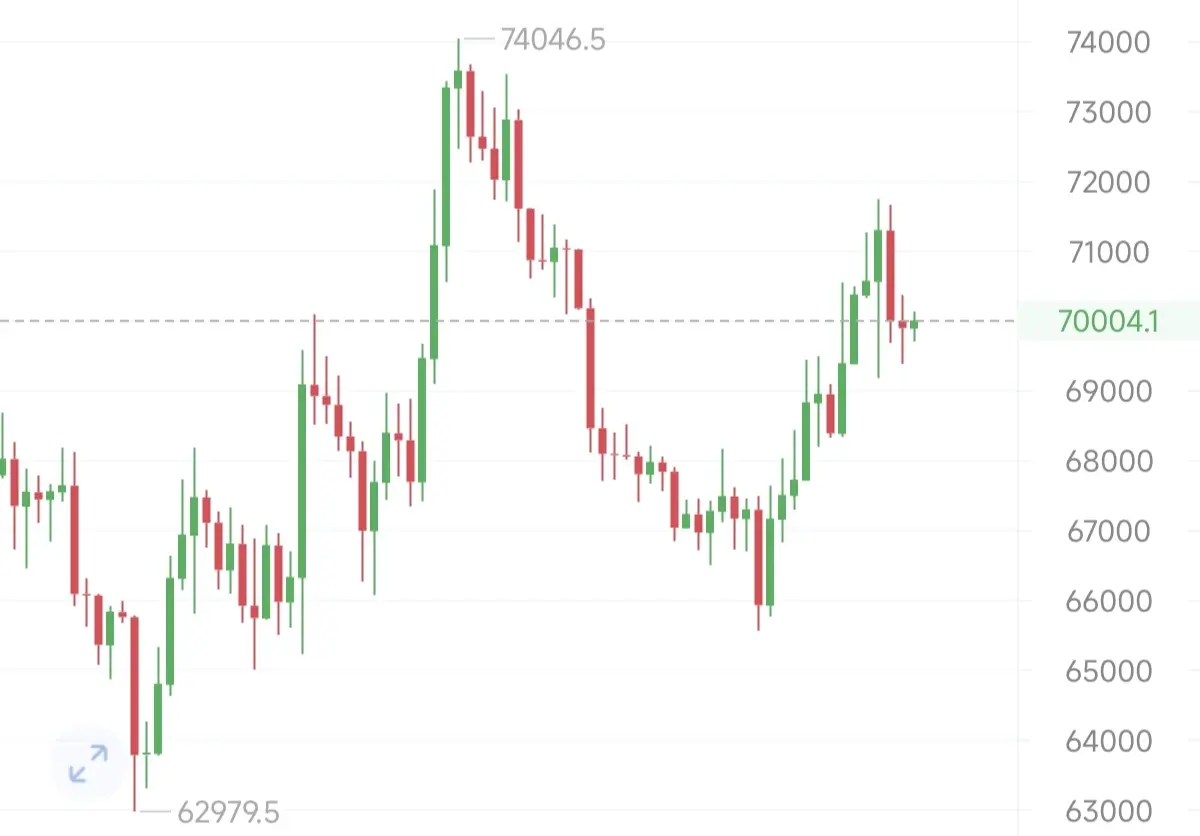
Bitcoin once again demonstrated strong resilience by leading the market recovery after briefly falling toward the mid-$60,000 region earlier in the week. During the peak of macro uncertainty, Bitcoin dropped close to the $66,000 level as traders reacted to rising energy prices and global tensions.
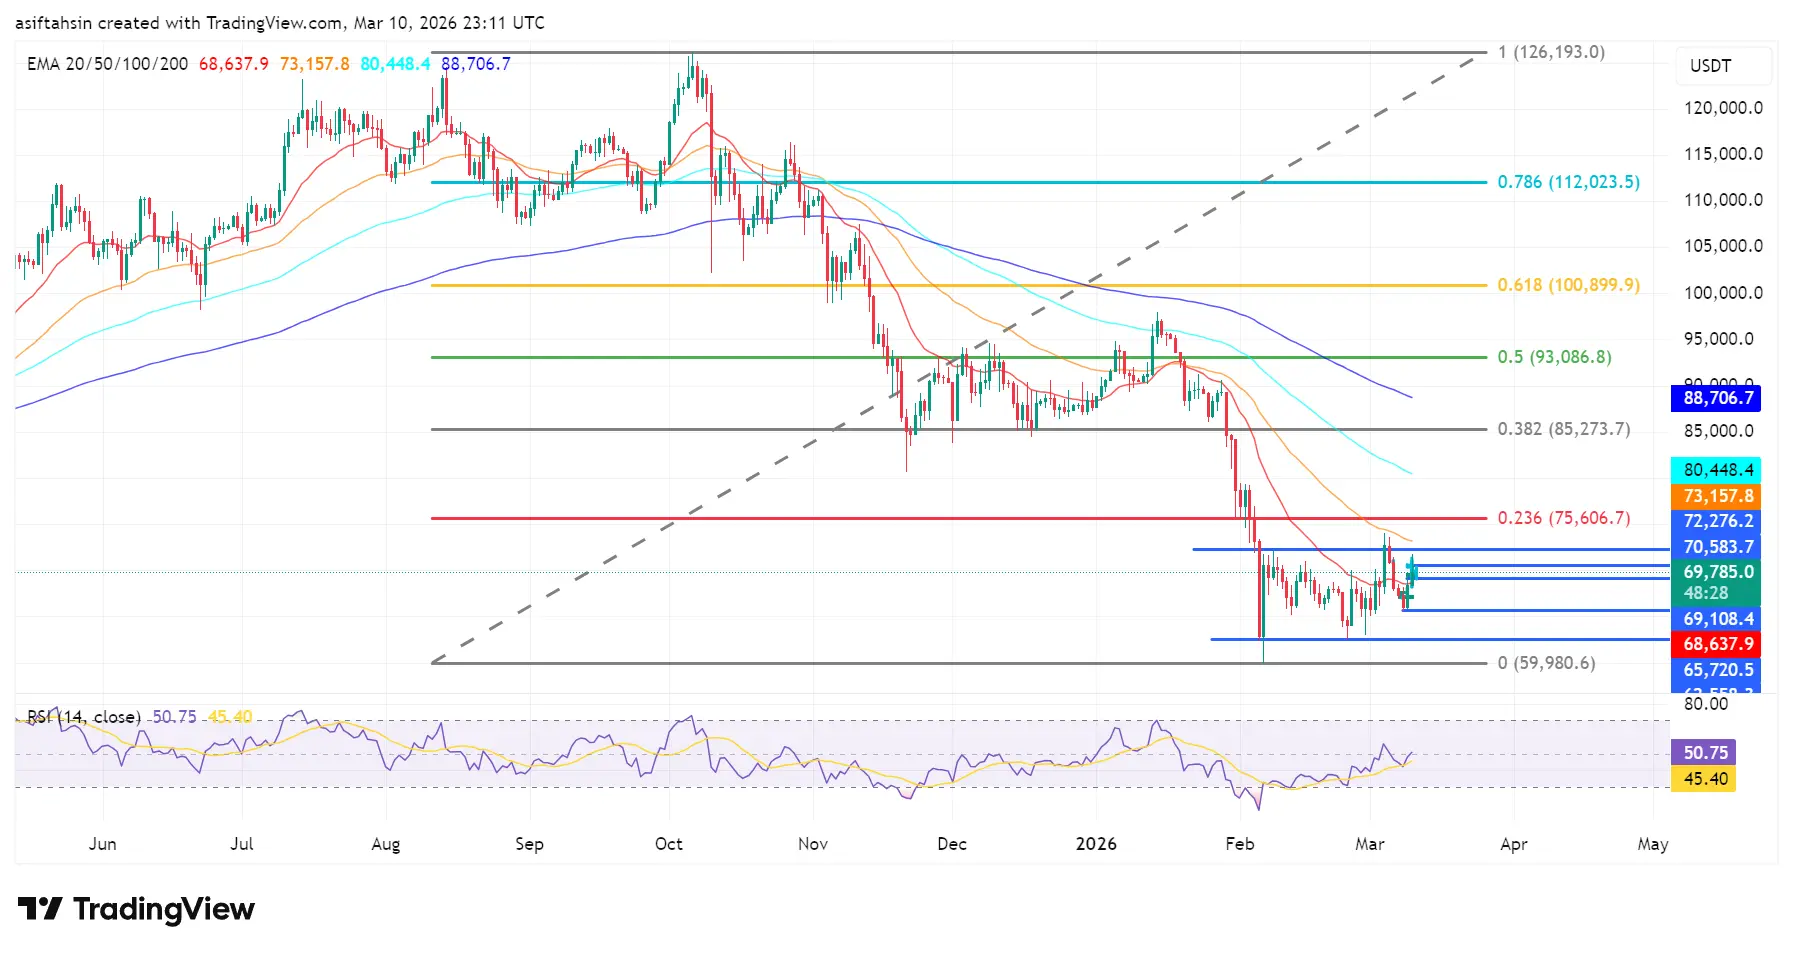
However, strong buying pressure quickly appeared around those levels, allowing Bitcoin to recover and reclaim the important $70,000 psychological level. Currently trading near $70,000, Bitcoin has rebounded roughly five to six percent from its recent lows.
The recovery was partially driven by derivatives market activity where many short positions were liquidated during the upward move. This short squeeze accelerated the rebound and helped restore bullish sentiment.
If Bitcoin continues holding above the $70,000 level, the next resistance zones could appear near $72,000 and $75,000. On the downside, strong support remains between $65,000 and $68,000, where buyers previously entered the market aggressively.
🔷 Ethereum Market Recovery
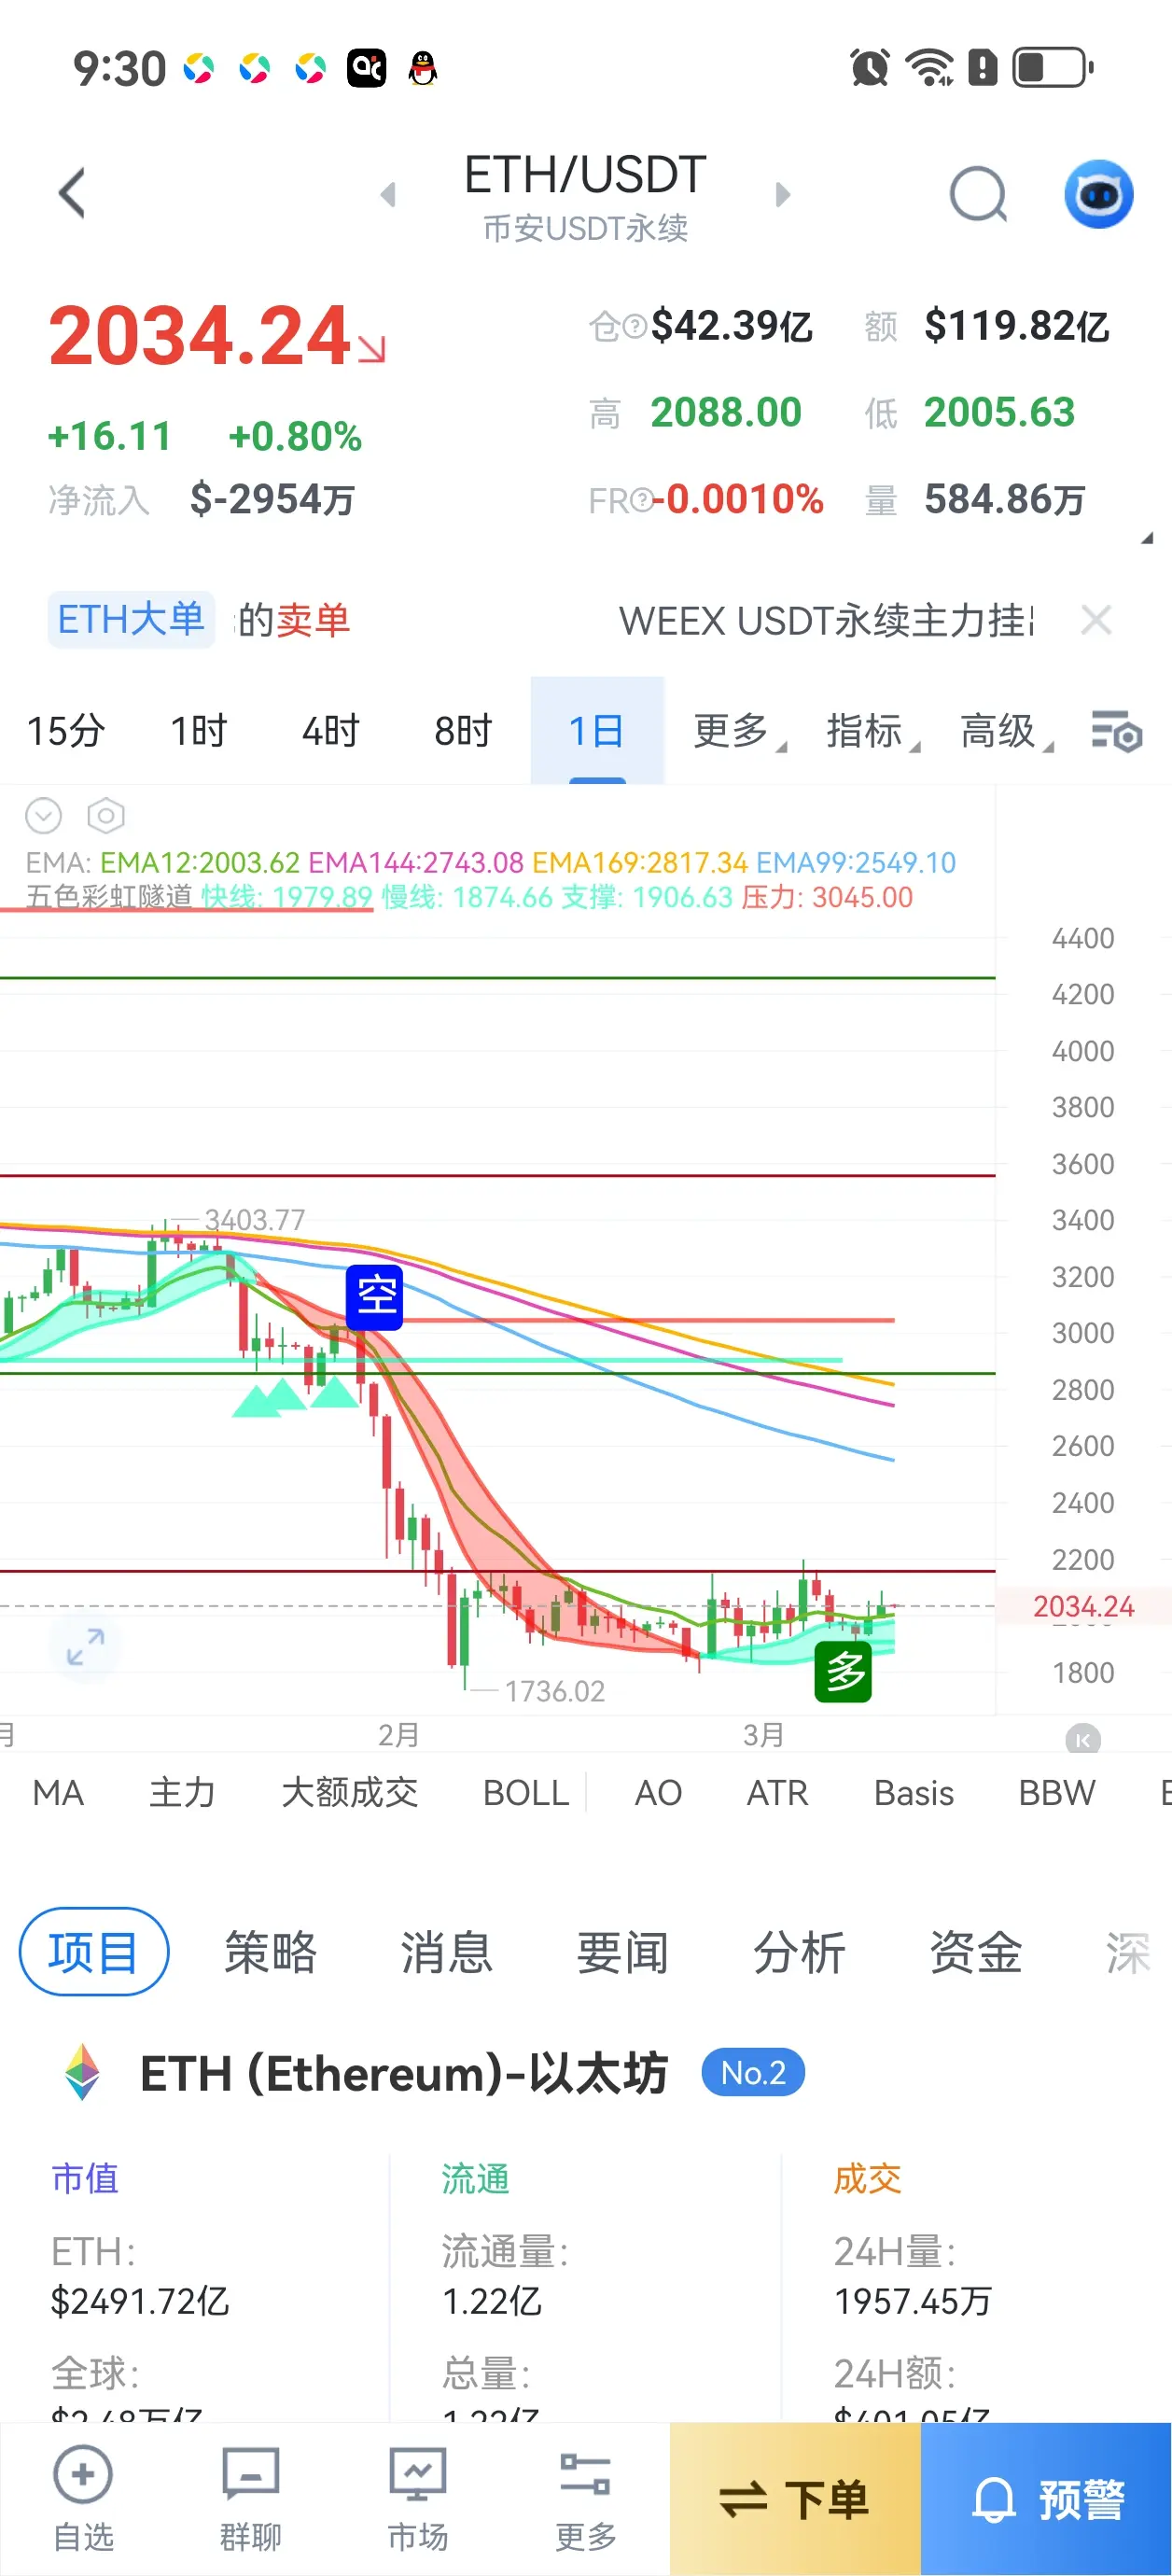
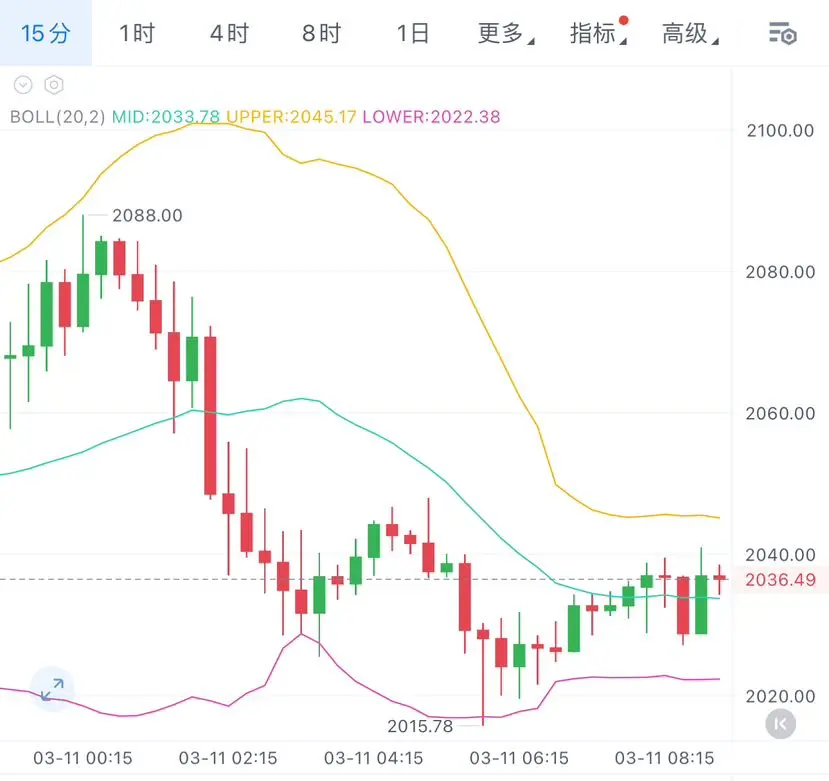
Ethereum has followed Bitcoin’s recovery closely after briefly dipping below the key $2,000 level during the correction. Selling pressure pushed ETH near the $1,900 region before buyers stepped in and supported the market.
Ethereum has since recovered and is currently trading around the $2,050 to $2,150 range, representing a rebound of approximately seven to ten percent from the recent lows.
The recovery is supported by continued staking growth and stable activity across decentralized finance platforms built on Ethereum. As more ETH becomes locked in staking contracts, circulating supply decreases, which can strengthen long-term demand.
Because Ethereum remains the second-largest cryptocurrency and the backbone of many blockchain applications, its performance continues to play a major role in determining the overall direction of the altcoin market.
🚀 Altcoins Market Recovery
Altcoins have shown an even stronger rebound compared to Bitcoin and Ethereum, which is common during market recoveries. When confidence returns, traders often move capital toward smaller assets seeking higher percentage gains.
Many altcoins have posted gains between eight and fifteen percent after the recent market bounce. Layer-1 blockchain projects and AI-related crypto tokens have performed particularly well.
Solana has rebounded toward the $85–$90 range after falling earlier during the correction. Other major altcoins including XRP, Cardano, and BNB have also recorded moderate gains as liquidity flows back into the market. Meme-based assets such as Dogecoin have participated in the rebound as retail trading activity increases.
🪙 Total Crypto Market Recovery
The overall cryptocurrency market capitalization has recovered significantly after the recent sell-off. During the peak of market fear, total market value dropped close to the $2.2 trillion region. As sentiment improved, the market climbed back toward approximately $2.4 trillion.
This rebound represents an estimated recovery of around eight to twelve percent from the recent lows, showing that buyers have returned to the market with renewed confidence.
🛢 Crude Oil Market Impact
Crude oil played an important role in influencing market volatility. Earlier in the week, oil prices surged toward the $110–$120 range per barrel due to geopolitical tensions and concerns about supply disruptions.
Rising energy prices increased inflation fears and contributed to selling pressure across risk assets including cryptocurrencies. However, as tensions eased and supply concerns stabilized, oil prices pulled back toward the $90 range.
This decline helped reduce inflation fears and encouraged investors to return to risk assets, contributing to the recent crypto market rebound.
🪙 Gold Market Situation
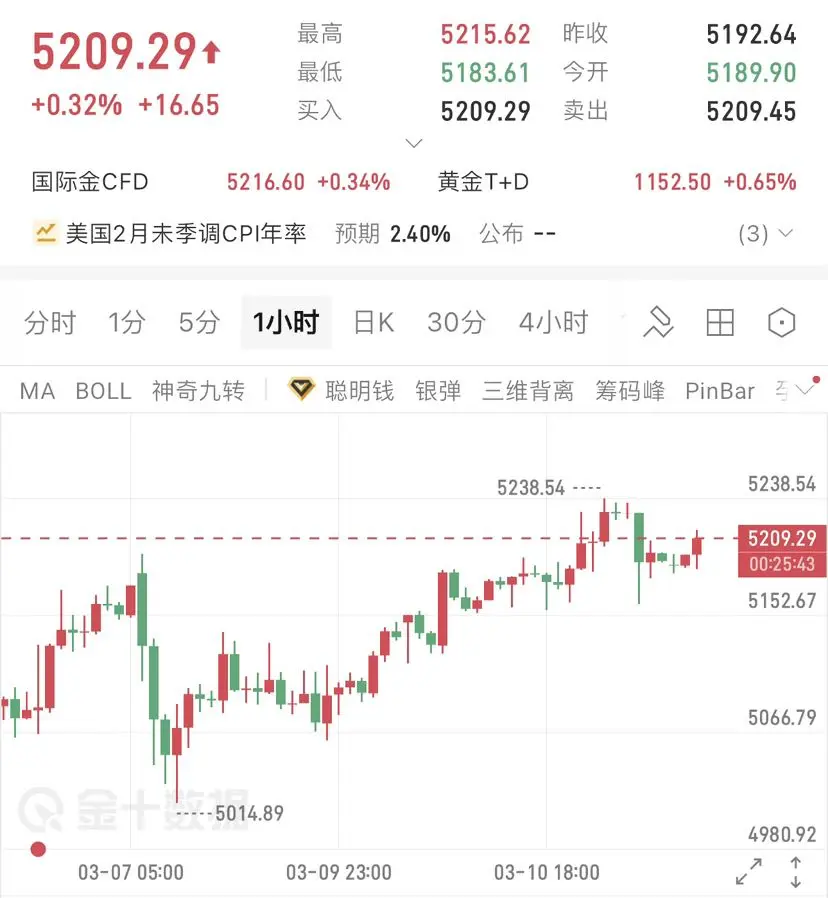
Gold saw strong demand during the period of uncertainty as investors moved toward traditional safe-haven assets. Prices briefly surged toward the $5,400 region during peak market fear.
As market sentiment improved and risk assets recovered, gold prices stabilized and are currently trading closer to the $5,200 level.
The relationship between gold and Bitcoin continues evolving as both assets are increasingly viewed as alternative stores of value during periods of financial uncertainty.
📈 Institutional Activity
Institutional participation remains one of the strongest long-term drivers of the cryptocurrency market. Investment funds and asset managers continue accumulating Bitcoin and other digital assets through regulated investment products and large-scale allocations.
This institutional demand provides strong underlying support for the market because large investors typically maintain longer investment horizons compared to short-term traders.
🔮 Short-Term Crypto Outlook
Looking ahead, the crypto market will remain influenced by macroeconomic conditions including inflation data, central bank policies, and developments in global energy markets.
If Bitcoin maintains stability above the $70,000 level and oil prices continue stabilizing, the market could attempt another move toward higher resistance zones. In that scenario, Ethereum and major altcoins may continue their upward momentum.
Overall, the recent rebound highlights the resilience of the cryptocurrency market despite macro-driven volatility. While short-term fluctuations remain likely, the broader trend suggests that demand for digital assets continues to strengthen as the market matures.
repost-content-media
  • Reward
  • 7
  • Repost
  • Share
xxx40xxxvip:
To The Moon 🌕
View More
I have repeatedly emphasized that this position is the current dividing line between bulls and bears in the market. And based on the current actual performance, although there have been some fluctuations, the overall dominance still firmly remains in the hands of the bulls.
On the daily chart, a clear streak of consecutive bullish days has already appeared, with short-term moving averages continuing to diverge upward, and all indicators maintaining a healthy bullish alignment. This indicates that the trend's resilience is still intact. Even if there is a pullback during trading, it is more of
BTC1,49%
ETH1,15%
View Original
post-image
  • Reward
  • Comment
  • Repost
  • Share
$ETH Public idea reference:
The side chick's approach is the same as Big Cake. Yesterday also surged high and then pulled back. Currently, it's consolidating, and the overall daily chart is also rebounding and moving upward in a oscillating manner!
Second Cake: During the pullback near 2015-2000, consider going north. Target around 2080-2150.
$ETH #Gate2月透明度报告
ETH1,15%
View Original
post-image
  • Reward
  • Comment
  • Repost
  • Share
March 11, 2026 Gold Morning Review
The fast line crosses below the slow line, green bars initially appear, and short-term momentum weakens. Overall, it remains in an upward channel, but after a surge yesterday, a pullback occurred. The K-line shows consecutive small bullish and bearish candles, indicating that bullish momentum is waning. Caution is needed for a potential pullback from high levels.
The price stabilizes above 5100, with moving averages in a bullish alignment, and the medium-term upward trend remains intact. The pullback is more of a technical correction after profit-taking. The
View Original
post-image
  • Reward
  • Comment
  • Repost
  • Share
Load More