Trade
Basic
Futures
Futures
Hundreds of contracts settled in USDT or BTC
TradFi
Gold
Trade global traditional assets with USDT in one place
Options
Hot
Trade European-style vanilla options
Unified Account
Maximize your capital efficiency
Demo Trading
Futures Kickoff
Get prepared for your futures trading
Futures Events
Participate in events to win generous rewards
Demo Trading
Use virtual funds to experience risk-free trading
Earn
Launch
CandyDrop
Collect candies to earn airdrops
Launchpool
Quick staking, earn potential new tokens
HODLer Airdrop
Hold GT and get massive airdrops for free
Launchpad
Be early to the next big token project
Alpha Points
Trade on-chain assets and enjoy airdrop rewards!
Futures Points
Earn futures points and claim airdrop rewards
Investment
Simple Earn
Earn interests with idle tokens
Auto-Invest
Auto-invest on a regular basis
Dual Investment
Buy low and sell high to take profits from price fluctuations
Soft Staking
Earn rewards with flexible staking
Crypto Loan
0 Fees
Pledge one crypto to borrow another
Lending Center
One-stop lending hub
VIP Wealth Hub
Customized wealth management empowers your assets growth
Private Wealth Management
Customized asset management to grow your digital assets
Quant Fund
Top asset management team helps you profit without hassle
Staking
Stake cryptos to earn in PoS products
Smart Leverage
New
No forced liquidation before maturity, worry-free leveraged gains
GUSD Minting
Use USDT/USDC to mint GUSD for treasury-level yields
More
Trending Topics
View More88.16K Popularity
176.87K Popularity
42.09K Popularity
9.73K Popularity
433.83K Popularity
Pin
Yan Ruixiang: Gold remains bullish, while crude oil cautiously watches for a potential dip to daily support
Gold
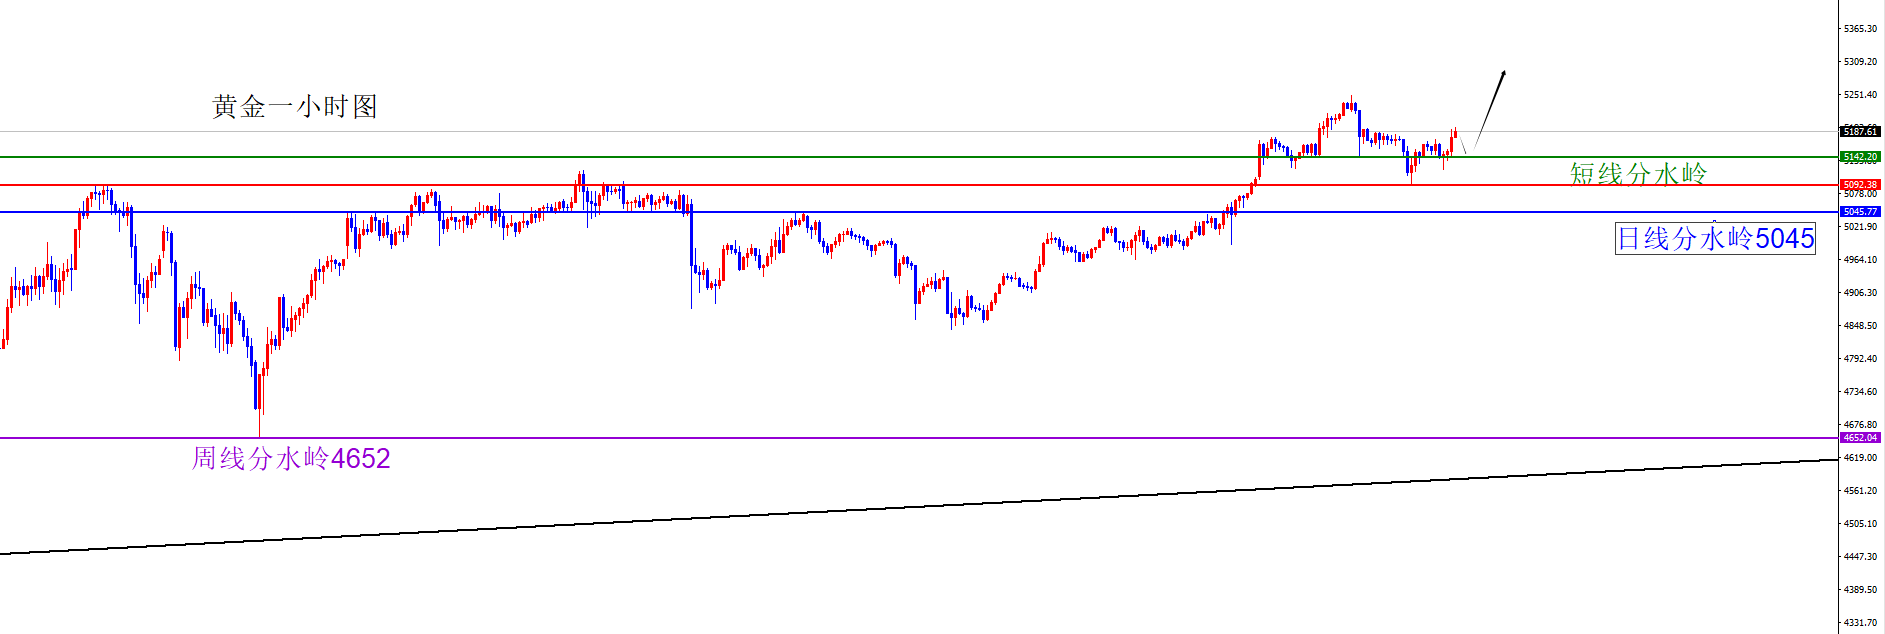
Monthly chart (long-term bullish) Support: 3700
Weekly chart (mid-term bullish) Support: 4652
Daily chart (focus on closing) Support: 5045
Four-hour chart (short-term)
Key threshold in the 5130-40 range, short-term focus on buying in the 5130-40 zone within the day
Crude Oil
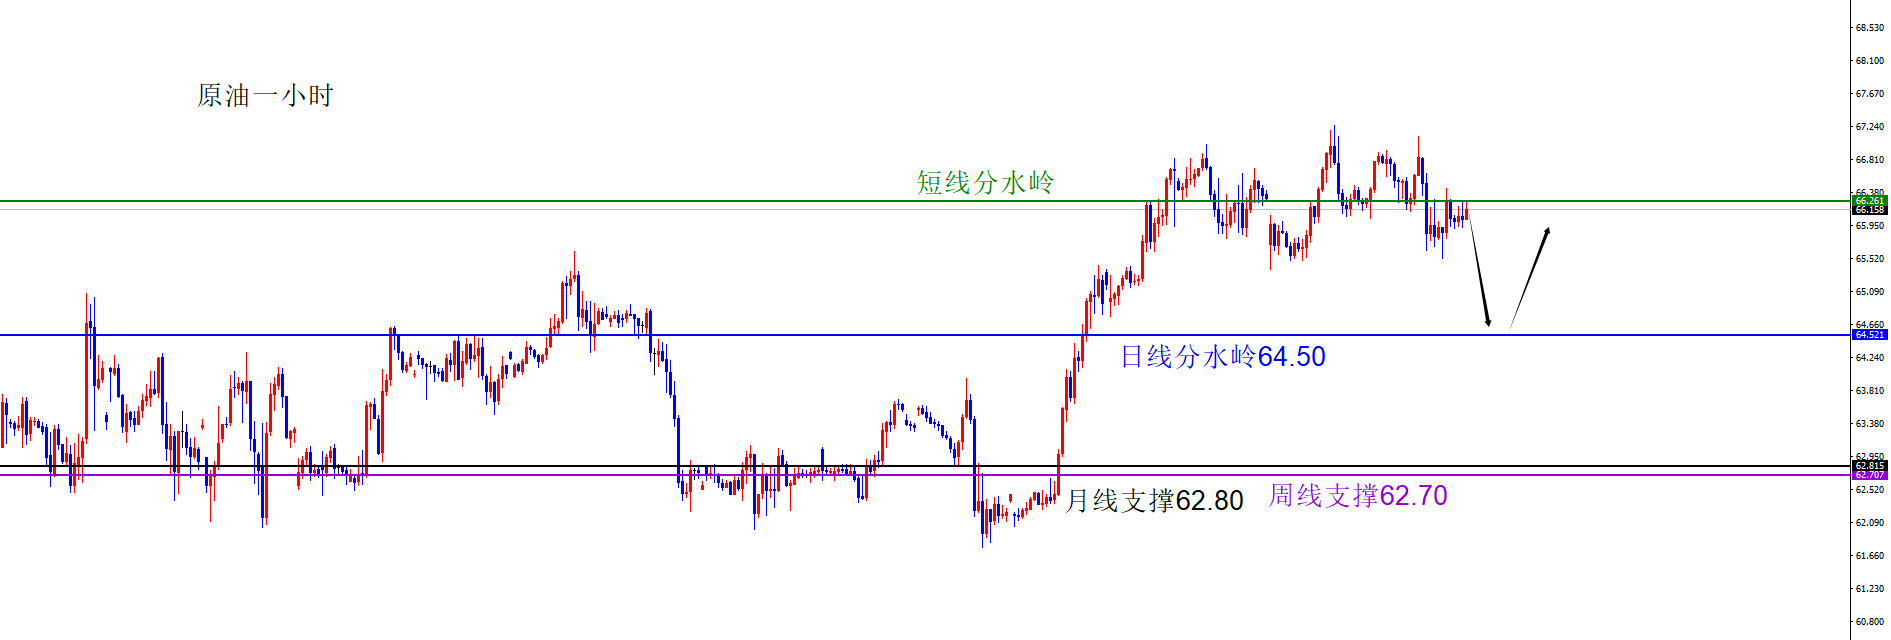
Monthly chart (long-term slightly bullish) Resistance: 62.80
Weekly chart (mid-term slightly bullish) Resistance: 62.70
Daily chart (wave-based bullish) Resistance: 64.50
Four-hour chart (short-term)
Short-term threshold near 66.30, beware of price testing the daily support at 64.50
[Key financial data and events to watch on Wednesday, February 25, 2026]
① 08:30 Australia January unadjusted CPI year-over-year
② 15:00 Germany March GfK Consumer Confidence Index
③ 15:00 Germany Q4 unadjusted GDP annualized final figure
④ 16:40 Reserve Bank of Australia Governor Lowe participates in a fireside chat
⑤ 17:00 Switzerland February ZEW Investor Confidence Index
⑥ 18:00 Eurozone January CPI final year-over-year
⑦ 18:00 Eurozone January CPI final month-over-month
⑧ 23:30 US EIA crude oil inventories for the week ending February 20
⑨ 23:30 US EIA Cushing crude oil inventories for the week ending February 20
⑩ 23:30 US EIA Strategic Petroleum Reserve inventories for the week ending February 20
⑪ Next day 05:00 NVIDIA releases earnings report
Note: The above are personal opinions and strategies for reference only. They do not constitute investment advice, are not related to client investments, and should not be used as a basis for order placement.