How High Can Hedera (HBAR) Price Go This Week?

Hedera (HBAR) has been busy behind the scenes. FedEx has joined the Hedera Council, showing that large companies are getting involved.
Hedera was also featured in a World Economic Forum session on responsible AI, placing it in wider global talks. However, Hashgraph picked up a DEVIES Award for its work on HashSphere.
Despite all that, the HBAR price is trading around $0.098, and the chart still shows a cautious structure.
- Here’s What The Hedera Chart Is Showing
- What the Indicators Are Showing
- Hedera Price Targets to Watch This Week
Here’s What The Hedera Chart Is Showing
On the 4H chart, HBAR has been in a steady downtrend for months. Price kept printing lower highs and slowly sliding from the $0.18–$0.20 area down toward the recent low near $0.072.
After touching that low, the HBAR price bounced and is now hovering just under the $0.10 mark. The chart looks more like a pause after a long drop than a real breakout.
Price is moving sideways between $0.095 and $0.10. That range is where buyers and sellers are fighting right now.
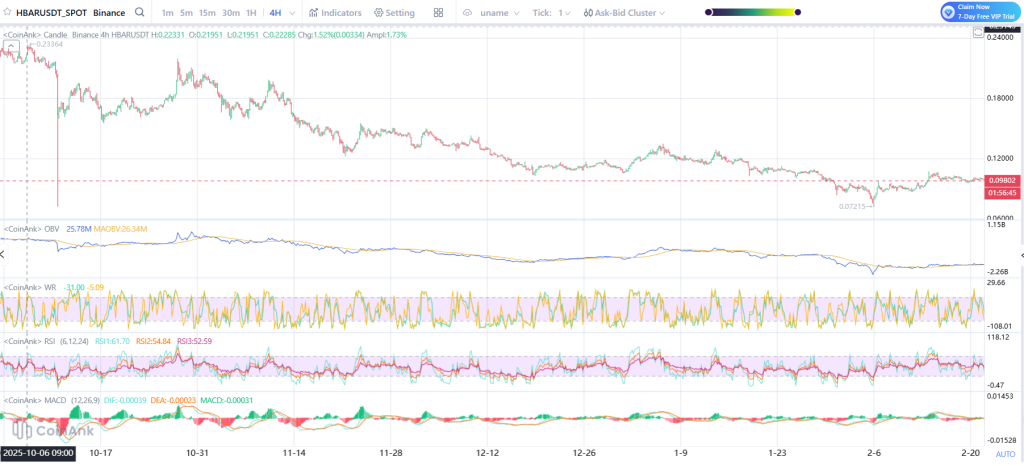
Source: Coinank
What the Indicators Are Showing
OBV has flattened after trending down for weeks. This implies that the selling pressure has eased, but the strong buying force has not yet fully come back.
The Williams %R indicator is currently close to the middle area, indicating that HBAR is not significantly oversold or overbought. The RSI is also close to the middle area, confirming the previous statement.
The MACD indicator is close to the zero level with small histogram bars. This typically indicates that the momentum is weak and the market is awaiting a signal. However, the HBAR price is stable, but there is no strong force yet.
_****Here’s Where Ripple’s XRP Price Could Be Headed This New Week**
Hedera Price Targets to Watch This Week
If HBAR stays above $0.095 and moves up, $0.11 is the first level to watch. After that, $0.12 is the next area where price struggled before.
If the buying interest is able to overcome the $0.12 level, a move towards $0.14 may be expected.
However, failure to hold above $0.095 could see the HBAR price could return towards $0.085, with the stronger level at $0.072 yet to be tested.
For now, HBAR is trading in a tight range. A decisive break above $0.11 or below $0.095 is likely to determine just how high, or how low, Hedera will go this week.
Related Articles
IOTA Coils After Trendline Break as $0.07156 Resistance Caps 40% Expansion Setup
Pepe Price Shows Early Signs of Bullish Reversal After Key Support Reclaim
Stellar (XLM) Price Near Major Reversal Zone: Key Levels Could Decide the Next Move
After 5 Years of Pain, Altcoins Just Flashed the Same Signal as 2020
Altcoin Market Cap to Revenue Ratios Reach Low Levels Amid Price Decline