
Bitcoin Cash price has returned to focus after a decisive rebound near the lower boundary of a long-forming structure on the weekly chart. The reaction developed close to the $420 region, which continues to act as structural support inside a broad ascending triangle. Price behavior at this level matters because repeated defenses often define whether a trend can extend toward higher resistance zones.
Jonathan Carter notes that BCH remains positioned above the rising trendline that has guided market structure since mid-2023. His analysis highlights how the latest bounce confirms buyer presence at a technically meaningful zone. Stability above this foundation keeps the broader bullish structure intact and leaves upside projections technically valid for the months ahead.
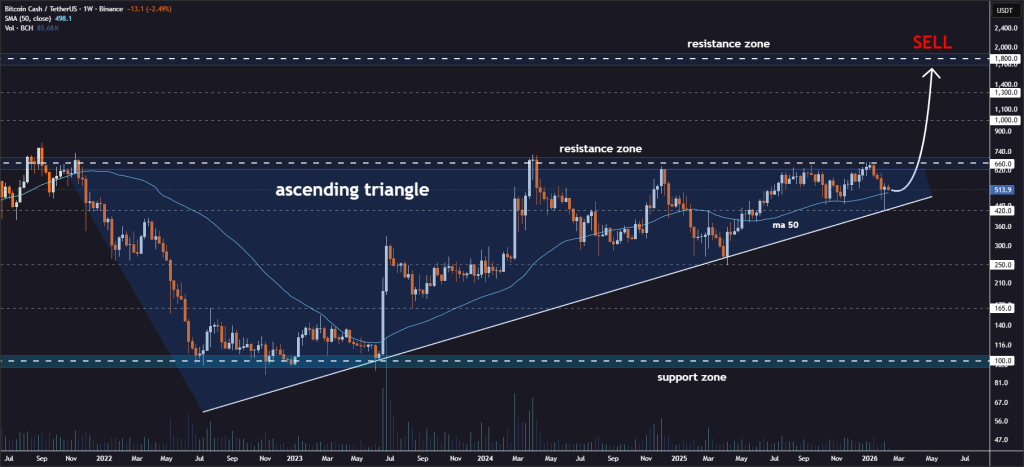
Ascending Triangle Structure Shows Why Bitcoin Cash Price Holds Strength
The weekly formation reveals a pattern of higher lows pressing toward horizontal resistance near $660. Each decline into support has produced a recovery that maintains the upward slope of the structure. Jonathan Carter explains that this configuration often precedes expansion once overhead resistance weakens through repeated tests.
@JohncyCrypto / X
Support confluence strengthens the technical picture. The 50-week moving average sits close to the rising trendline, which creates a layered defense beneath current BCH price action. Failure below $420 would break this structure and invalidate the bullish thesis outlined by Jonathan Carter. Continued defense above that level keeps probability aligned with an eventual resistance challenge.
Measured triangle projections outline potential upside zones that extend far beyond current price. Carter identifies $660 as the first barrier, followed by $1,000, $1,300, and $1,800 if bullish continuation develops across future weekly closes. Historical interaction around these regions supports their relevance as technical checkpoints.
Resistance Levels Define The Next Path For BCH Price Movement
Immediate focus centers on whether Bitcoin Cash can secure acceptance above $660. Rejection at this ceiling has shaped consolidation throughout the past cycle. A confirmed breakout would expose BCH to the $1,000 region, where prior distribution once controlled market direction. Strength beyond that zone could reopen the path toward $1,300 and eventually $1,800 under sustained bullish pressure.
Silver Price Prediction: This Trader Just Mapped Silver’s Next Big Move_**
Jonathan Carter emphasizes disciplined structure awareness through a clearly defined stop near $420. Technical invalidation provides clarity during uncertain market conditions and separates structured planning from emotional reaction. Market structure therefore remains the primary guide for interpreting future BCH price behavior.
Bitcoin Cash now trades at a decisive technical location where support has proven reliable and resistance still limits expansion. The coming weekly closes will determine whether this rebound evolves into a confirmed breakout sequence. Jonathan Carter’s mapped levels provide a framework for tracking that progression as BCH attempts to transform stability into renewed upside exploration.
Disclaimer: The information on this page may come from third parties and does not represent the views or opinions of Gate. The content displayed on this page is for reference only and does not constitute any financial, investment, or legal advice. Gate does not guarantee the accuracy or completeness of the information and shall not be liable for any losses arising from the use of this information. Virtual asset investments carry high risks and are subject to significant price volatility. You may lose all of your invested principal. Please fully understand the relevant risks and make prudent decisions based on your own financial situation and risk tolerance. For details, please refer to
Disclaimer.
Related Articles
Tensions around the Strait of Hormuz have been fluctuating, and Bitcoin falls below $74,000
The Strait of Hormuz blockade triggers a major shock in the crypto market: after Bitcoin first breaks above $78,000, it then falls back to $74,000, and the market remains in panic. This article provides an in-depth analysis of the transmission mechanism between geopolitical shocks and crypto market price action.
GateInstantTrends33m ago
Major CEX Launches Crypto-Backed Lending in UK, Supporting BTC, ETH, and cbETH for USDC Borrowing
A centralized exchange launched crypto-backed lending services in the UK, allowing instant USDC loans using BTC, ETH, and cbETH as collateral, powered by Morpho. Total loans issued surpassed $2.17 billion since the service's US debut in January 2025.
GateNews1h ago
Crypto Jack Warns Bitcoin May Drop to $48K Amid Geopolitical Tensions
Crypto trader Crypto Jack warns investors to sell Bitcoin, predicting a decline to $48,000 amidst US-Iran tensions and negative financial signals, before a potential recovery in May based on seasonal trends.
CryptoFrontier1h ago
French-listed Capital B Increases Bitcoin Holdings to 2,937 BTC
Gate News message, April 20 — French-listed company Capital B has increased its Bitcoin holdings by 12 BTC, bringing its total holdings to 2,937 BTC, according to an official announcement.
GateNews1h ago
Bitcoin’s fourth halving rally is slowing down, analysts say: BTC may have entered a “new normal”
Investment firm Galaxy analyst Alex Thorn noted that Bitcoin’s advance during this halving cycle has been lower than historical records, with volatility declining, and the market may be entering a new normal. Compared with the past three halvings, the fourth time’s price change is no longer significant. While the passage of U.S. spot ETFs has catalyzed the rally, the market’s ongoing conditions still need to be watched closely.
ChainNewsAbmedia1h ago
BTC rose 0.56% in 15 minutes: trading volume surges and buy-side dominance drives a spot rebound
From 07:15 to 07:30 on April 20, 2026 (UTC), BTC achieved a +0.56% short-term return in mainstream markets. The price range touched 74718.5 - 75568.1 USDT, and the 15-minute intraday swing reached 1.14%. In this phase, market attention warmed up, trading activity rose noticeably, and overall volatility increased.
The main driver behind this deviation is that for mainstream trading pairs such as BTC/USDT, the 15-minute trading volume increased month-over-month to +15%, forming a buy-side dominant pattern that pushed spot prices upward to break higher. Inflows directly drove the short-term upside. On-chain data shows that large BTC transfers were dispatched to new wallets in a structured, staged manner, with no concentrated sell pressure flowing to trading platforms. This releases a rebalancing signal rather than a sell signal, which helps ease short-term sell pressure. The chain
GateNews2h ago
