XRP is sitting at a level that has been important before. EGRAG CRYPTO laid it out on the weekly chart, and the pattern is hard to ignore. The same signal that appeared near the bottoms of 2018 and 2022 is flashing again, and if history is any guide, the XRP price might be closer to a turning point than most people realize.
- The Signal That Marked Two Bottoms
- The Levels That Matter and The Current Setup
- What Comes Next for XRP
The Signal That Marked Two Bottoms
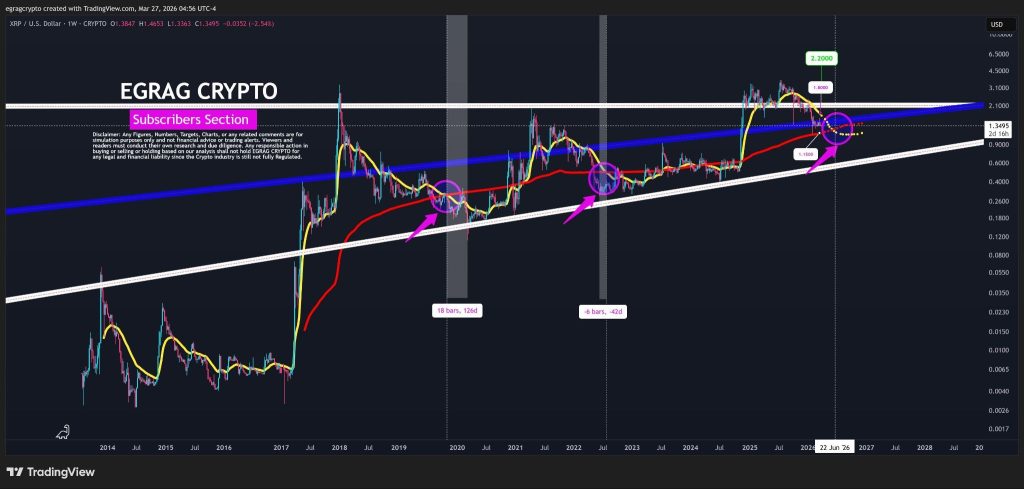
The weekly chart shared by EGRAG tells the story. There’s a yellow line and a red line. When the yellow line crosses above the red line, it doesn’t mark the exact bottom. But in both 2018 and 2022, it marked the zone. The area where the bottom formed.
Source: X/@egragcrypto
In 2018, the bottom came 126 days after the cross. In 2022, the bottom came 42 days before the cross. The timing is different, but the conclusion is the same. When this cross happens, you’re either at the bottom or extremely close to it.
Right now, that cross is happening again. The XRP price is sitting right at that transition zone. The same zone that preceded the last two major bottoms.
The Levels That Matter and The Current Setup
EGRAG’s analysis is clear about what to watch. The first level is $1.80. That’s the yellow line. A weekly close above that would mean the structure is reclaiming. That’s the first step. Above that, $2.20 is the next test. Break and hold above that, and it’s full thrust mode. That’s when the trend flips.
On the downside, if the XRP price fails to reclaim $1.80, the market isn’t ready yet. Downside remains in play. The next support to watch is $1.15, a deeper level that would likely get tested if the current zone doesn’t hold.
The XRP price is currently trading around $1.32, sitting right at that sensitive zone. The weekly chart shows the yellow line and red line converging. The cross is happening now. That’s the same setup that appeared before the last two major bottoms.
EGRAG isn’t guessing. He’s letting the chart confirm. The historical behavior matters. In 2018, this cross marked the bottom zone. In 2022, it did the same. Now it’s happening again.
Crypto Price Prediction for Today, March 27: Bitcoin (BTC), XRP, and Solana (SOL)_**
What Comes Next for XRP
XRP is at a decision point. If the yellow line crosses above the red line and holds, the bottom zone could be in. If the XRP price reclaims $1.80 on a weekly close, the structure starts to flip. If it breaks above $2.20, that’s full thrust mode. If it fails, $1.15 is the next level to watch. That would mean the market isn’t ready yet, and more downside is in play.
History says this is where bottoms form. Not the exact bottom, but the zone. The XRP price is right there. Now it’s about letting the chart confirm. A weekly close above $1.80 would be the first sign. Until then, it’s a waiting game. But the signal is flashing. And the last two times it flashed, the bottom was near. That’s not speculation.
Disclaimer: The information on this page may come from third parties and does not represent the views or opinions of Gate. The content displayed on this page is for reference only and does not constitute any financial, investment, or legal advice. Gate does not guarantee the accuracy or completeness of the information and shall not be liable for any losses arising from the use of this information. Virtual asset investments carry high risks and are subject to significant price volatility. You may lose all of your invested principal. Please fully understand the relevant risks and make prudent decisions based on your own financial situation and risk tolerance. For details, please refer to
Disclaimer.
