The HBAR cryptocurrency, part of the Hedera project, is facing a new downside risk despite a significant increase in network activity. Since the beginning of the year, HBAR’s price has fallen about 11%, and compared to the same period last year, the decline reaches 58%.
Currently, a bearish chart pattern has emerged as the total value locked (TVL) on the network has increased by nearly 50%, creating a rare contradiction between improving fundamentals and weakening price trends.
Bearish Signal Appears Amid Strong TVL Growth
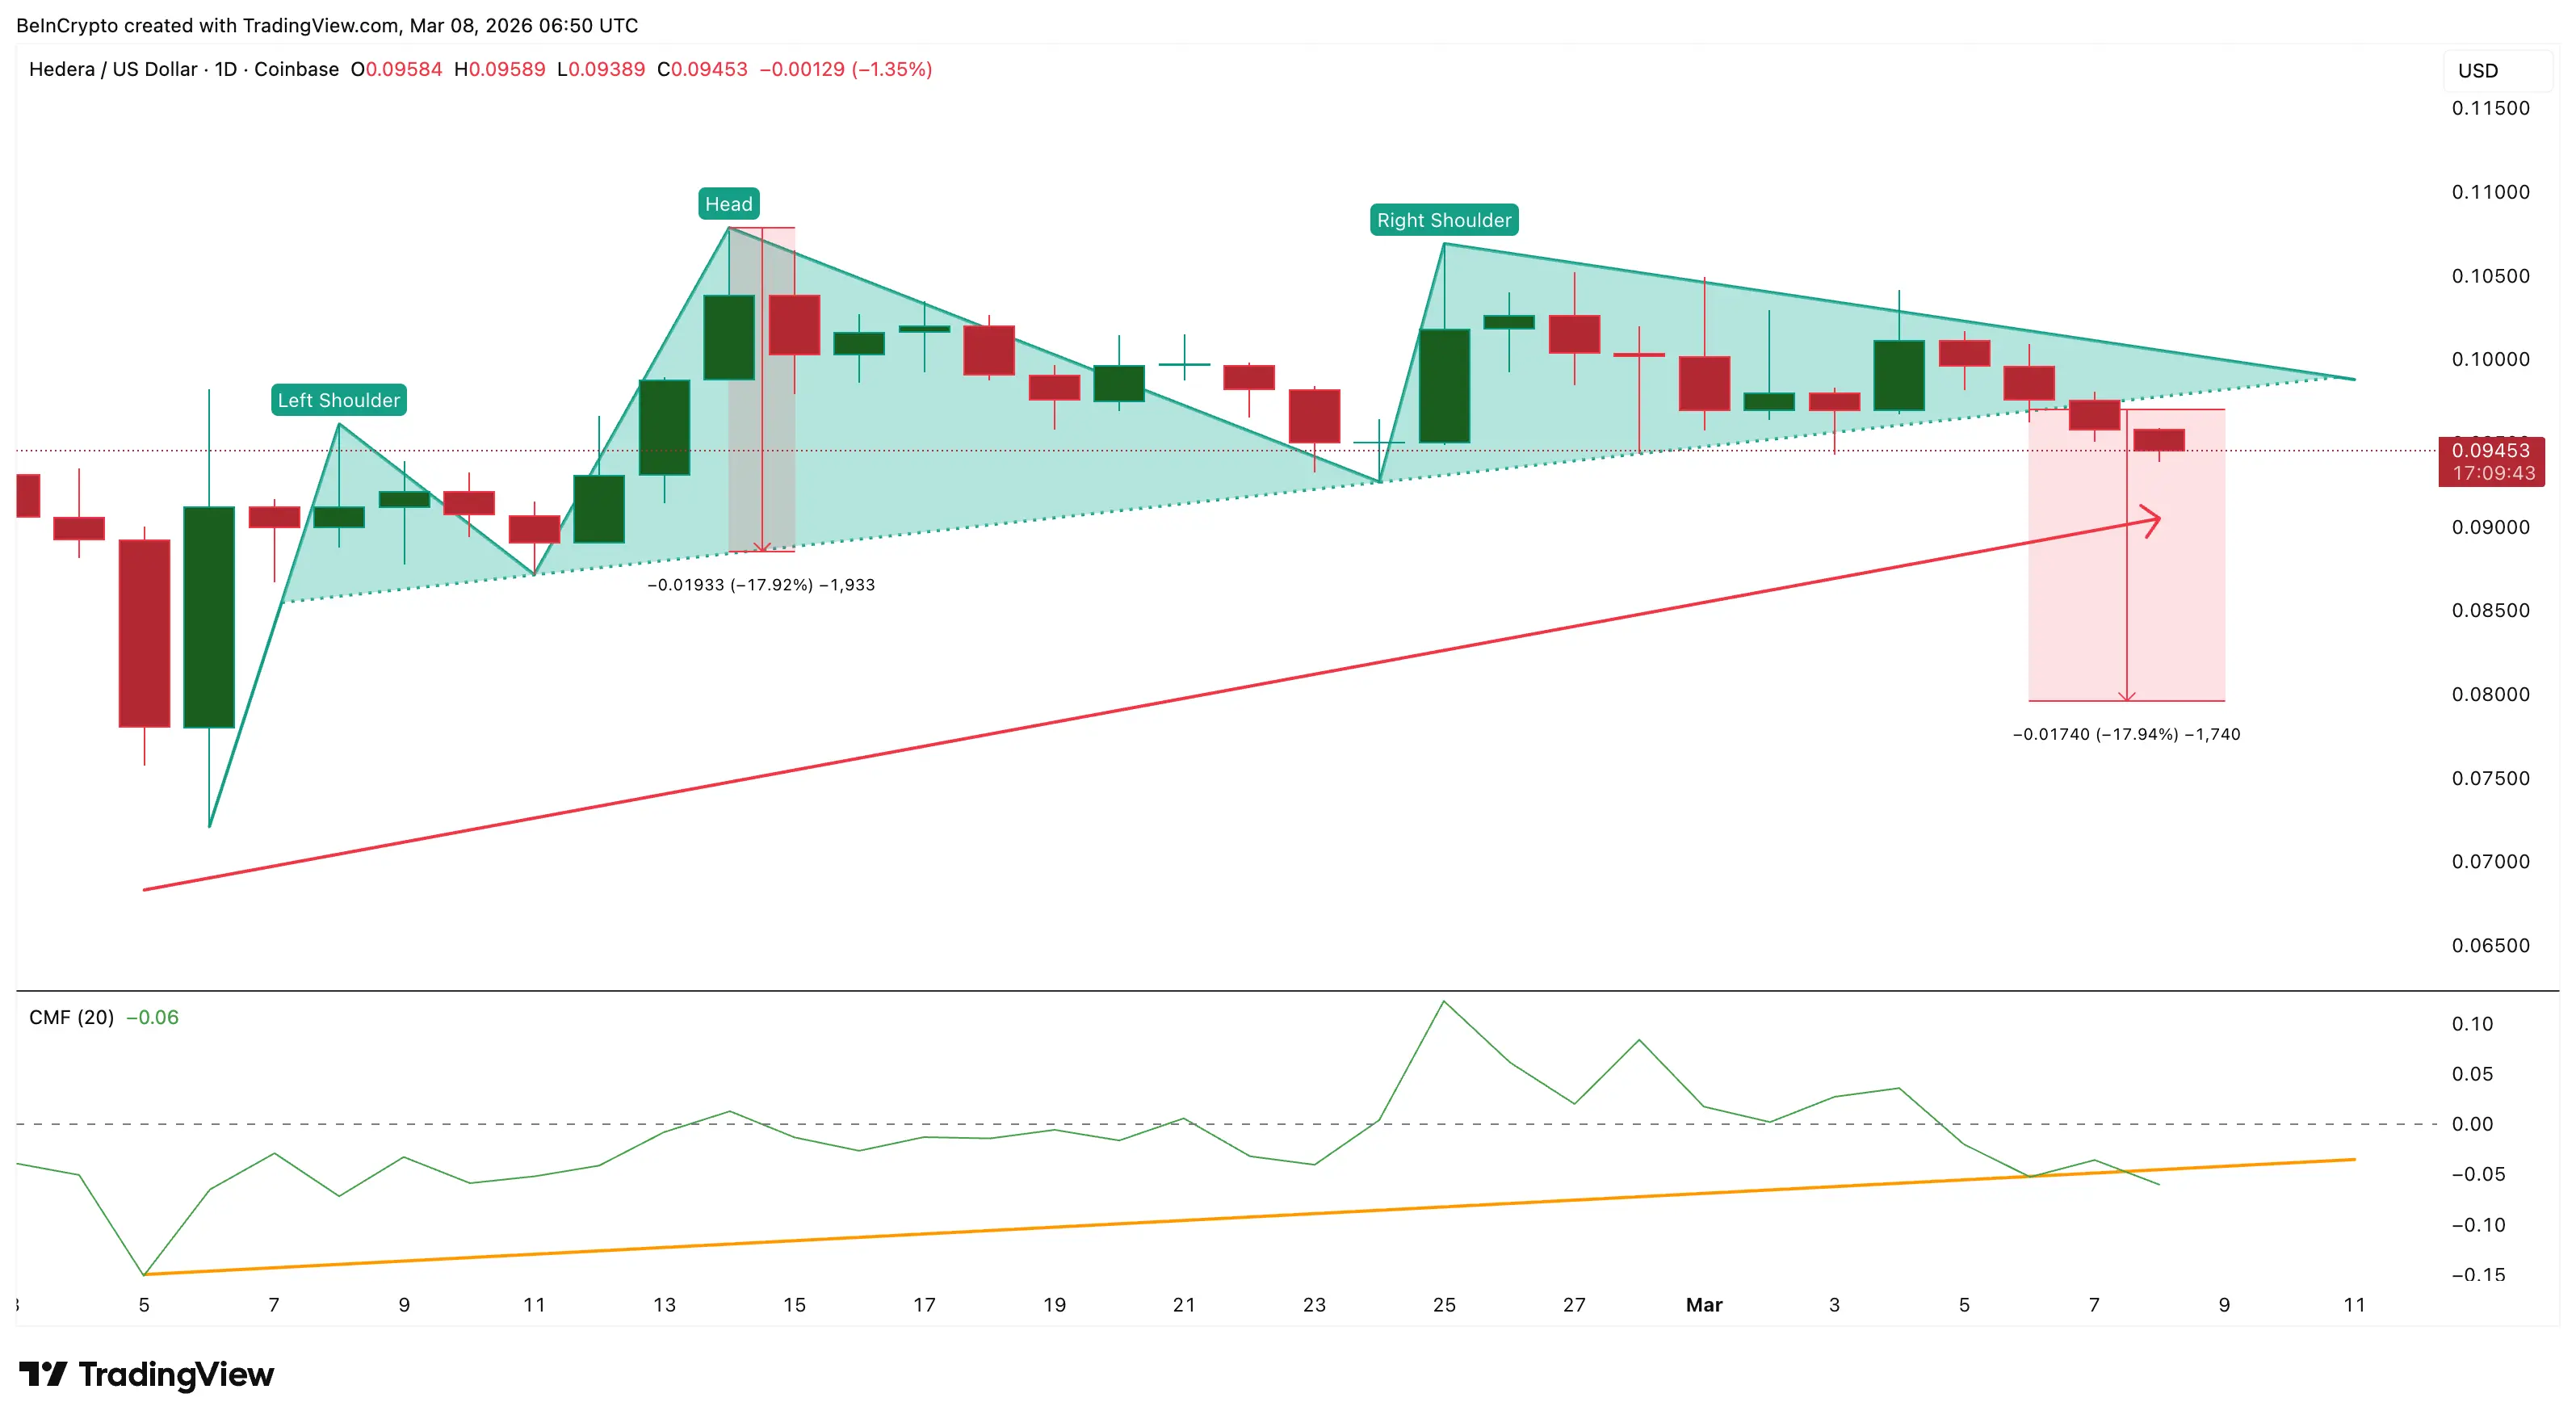
Recently, HBAR broke below the neckline of a head-and-shoulders pattern, a technical structure often signaling a trend reversal. This breakout occurred on March 7, putting HBAR at risk of further decline.
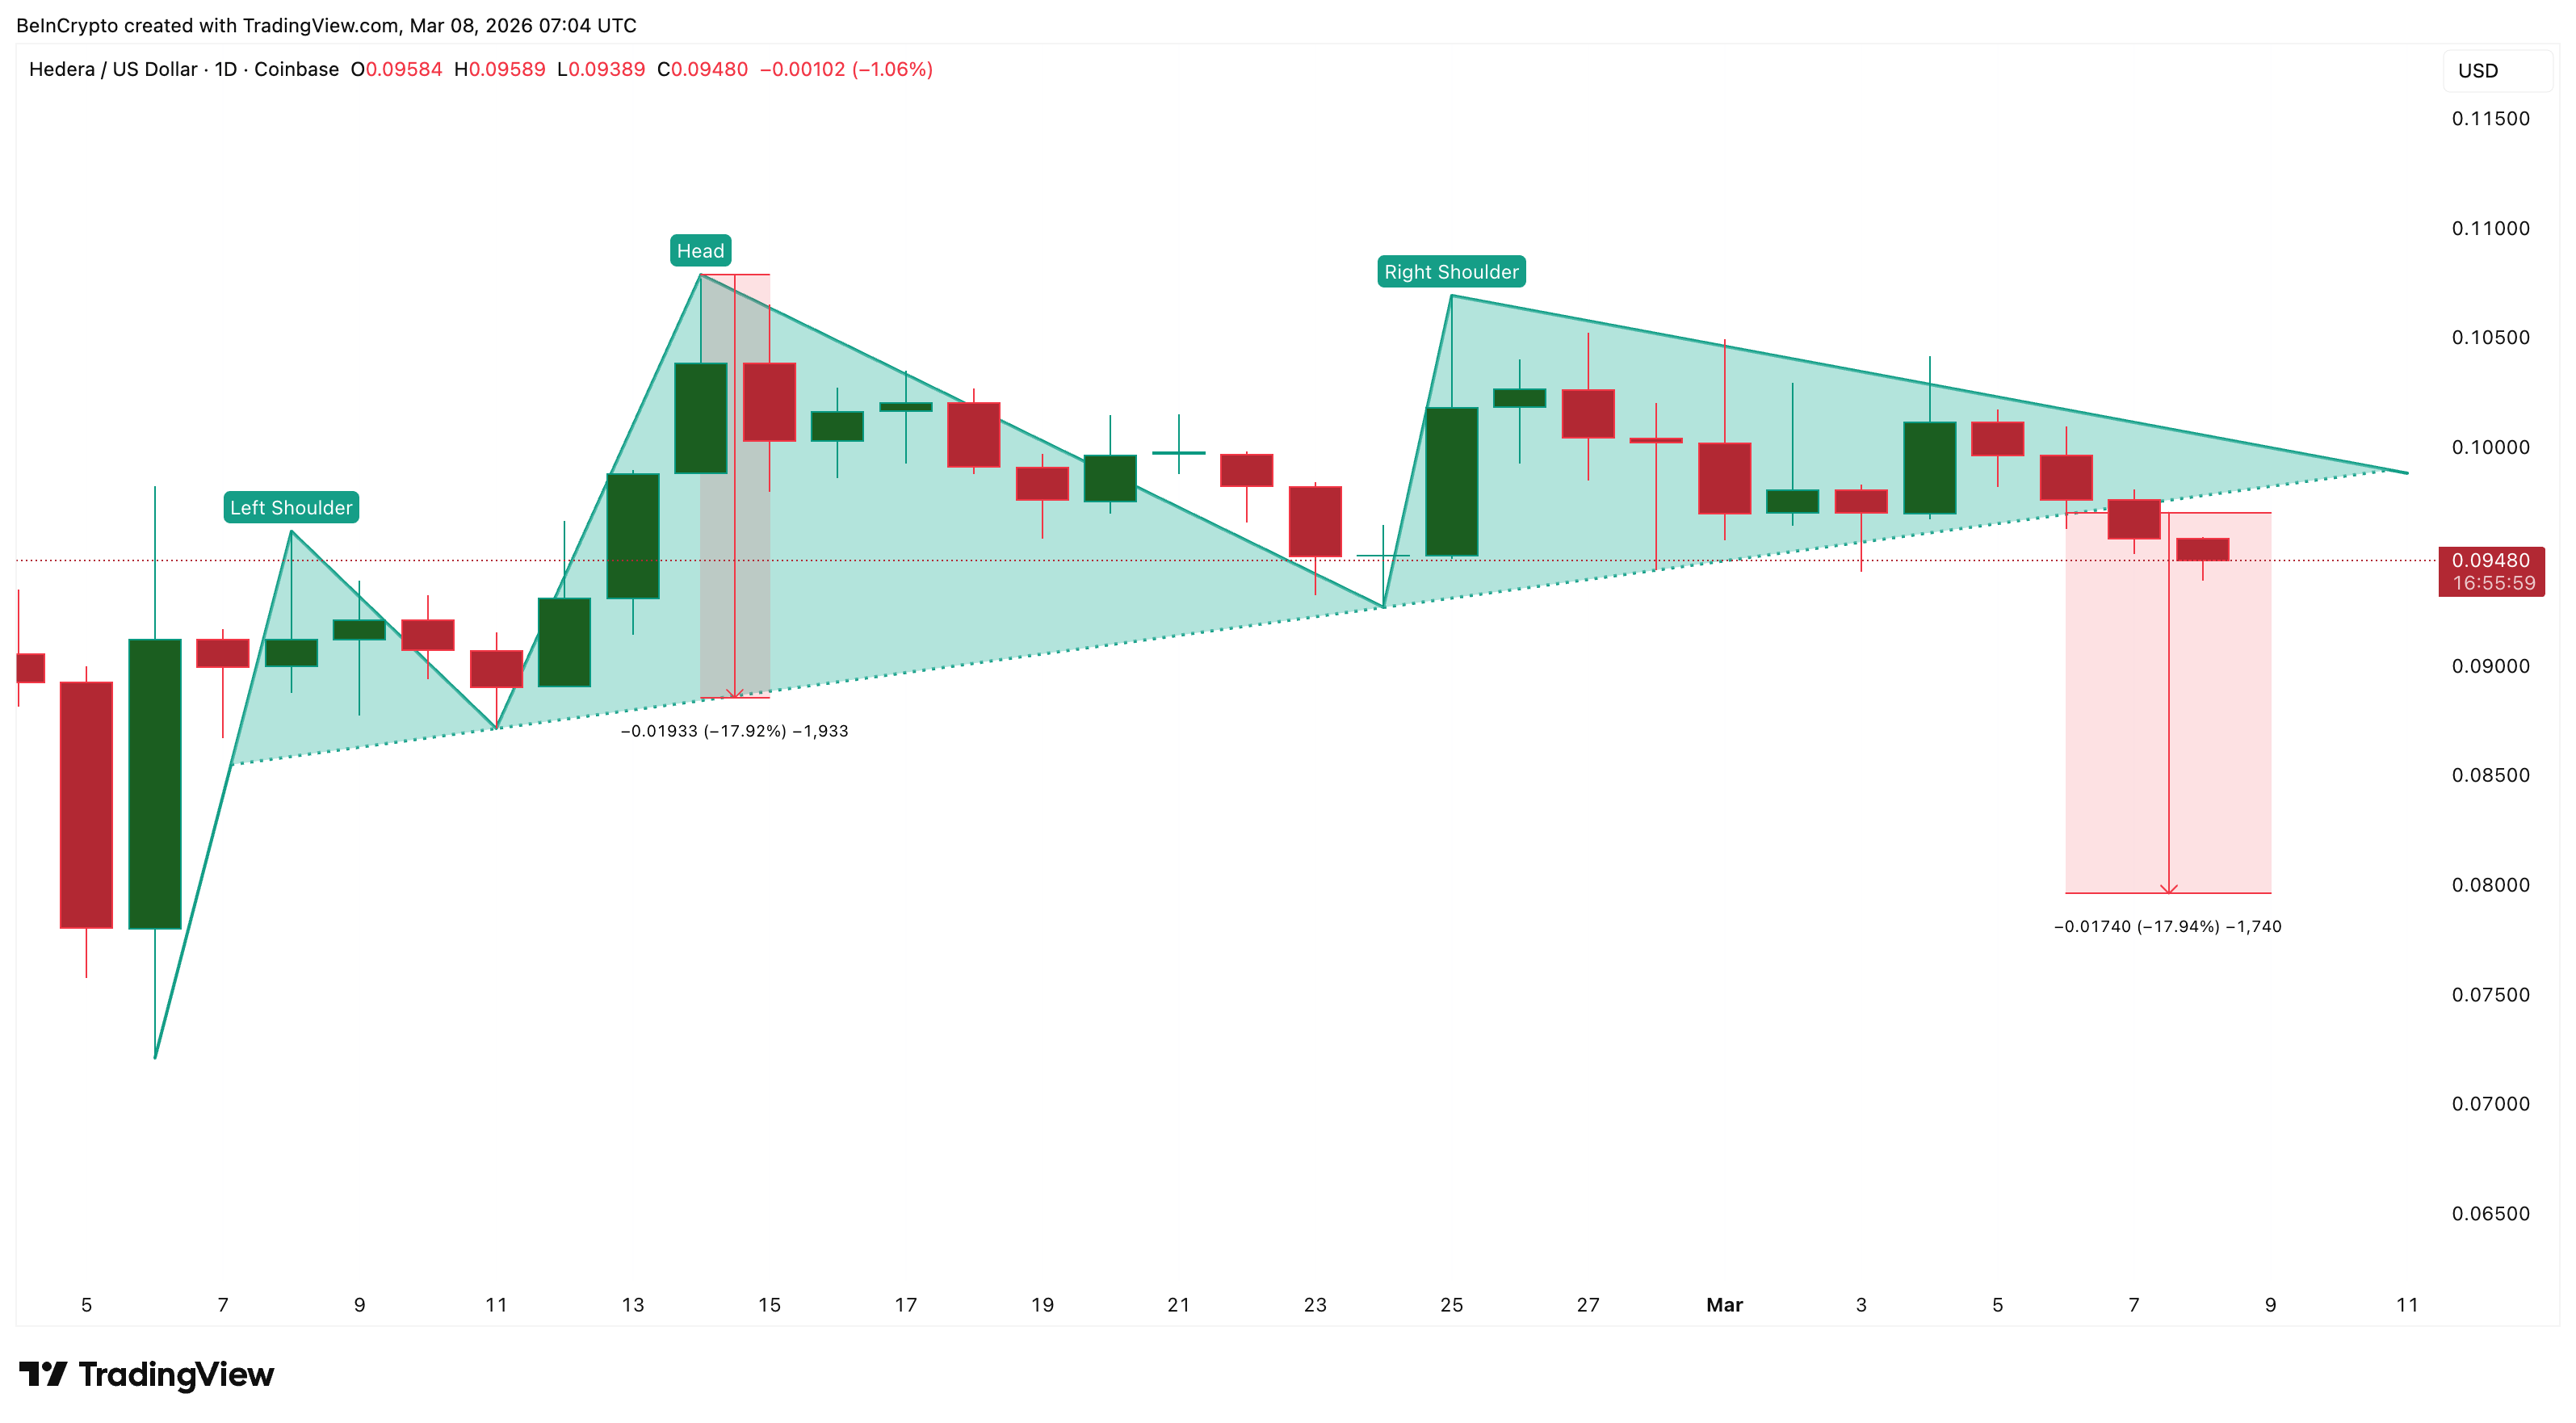 HBAR Price Structure | Source: TradingView
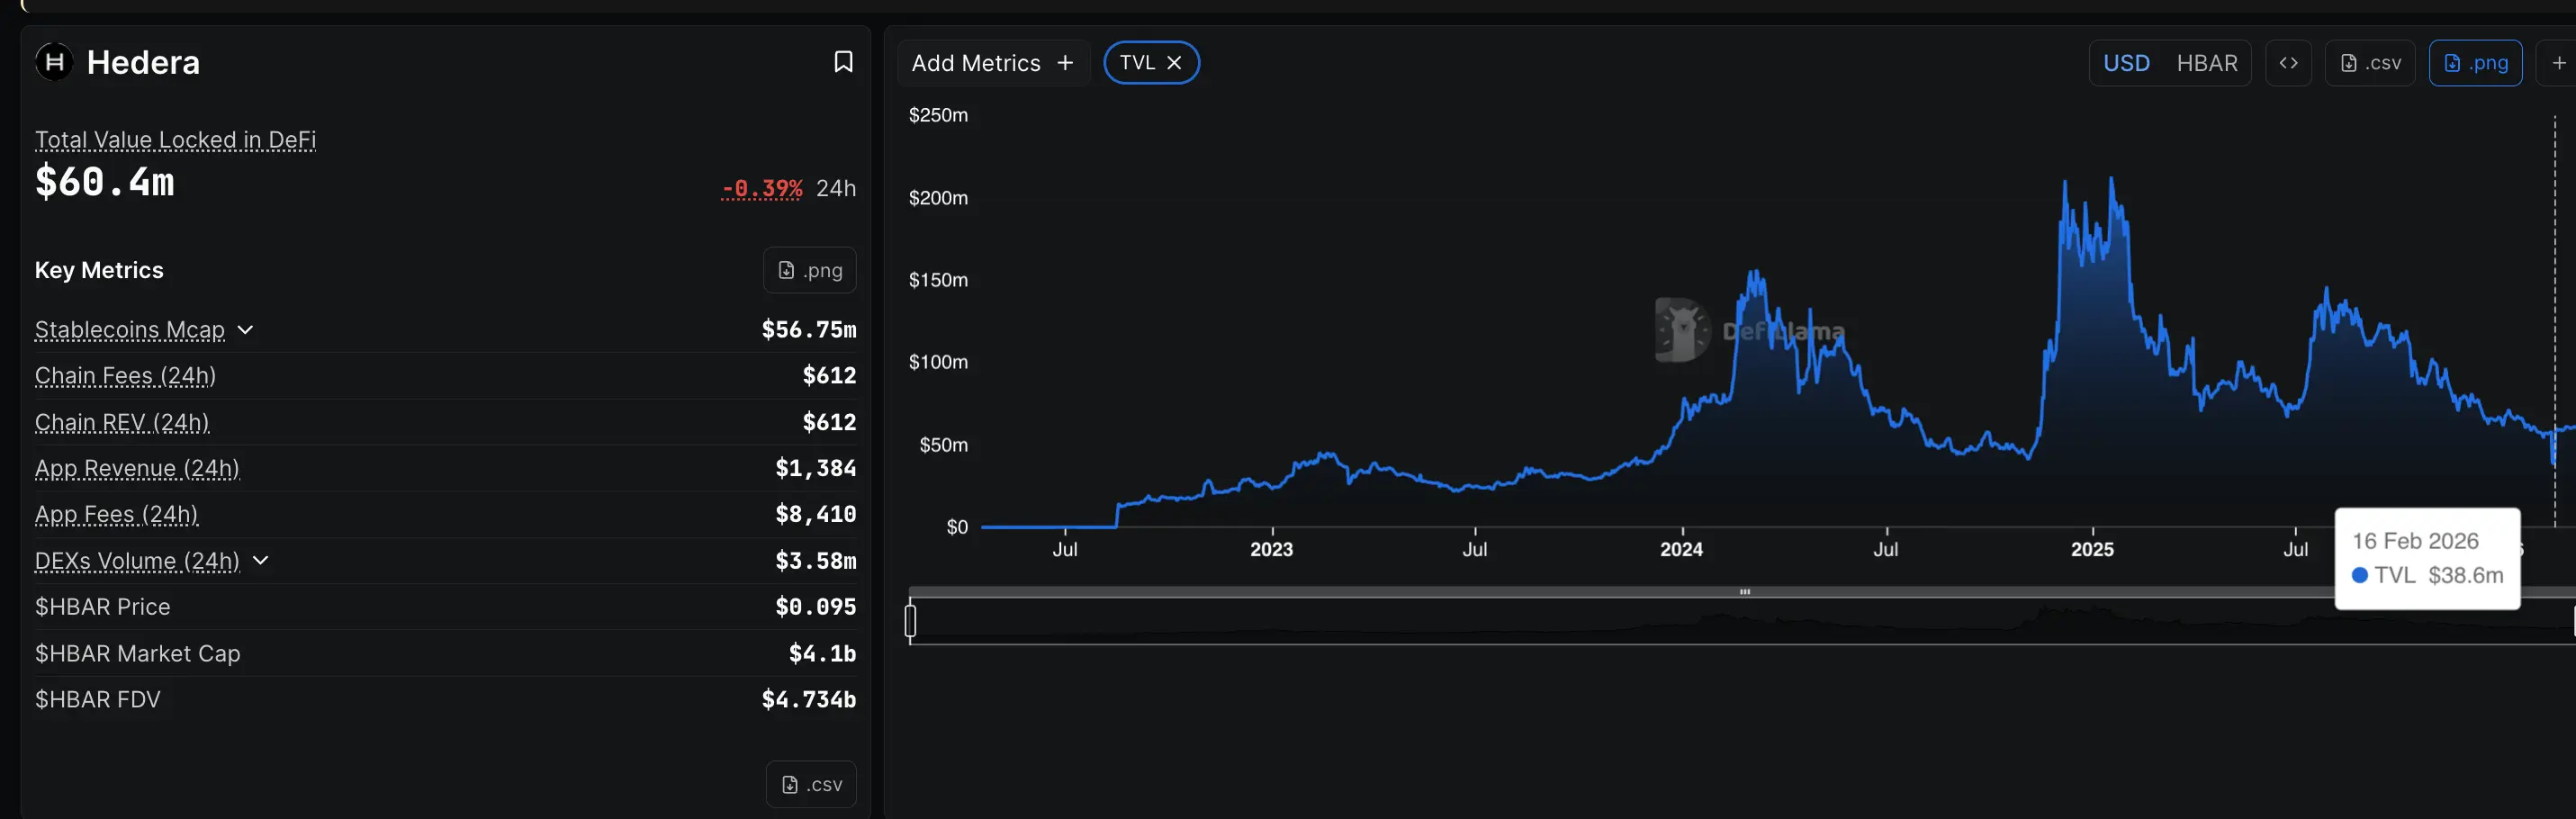
Notably, this technical weakness has occurred while Hedera’s network metrics are improving significantly. According to DeFiLlama, the total value locked (TVL)—representing the total assets deposited in decentralized applications—has risen from about $38.6 million on February 16 to $60.4 million currently, an increase of over 50% in just a few weeks.
Typically, rising TVL is a positive sign, indicating increased network usage and investor confidence. As capital flows into decentralized applications, the value of the underlying token usually strengthens. However, HBAR’s price movement does not follow this trend.
 Outstanding Performance of “Made In USA” DeFi Project | Source: Defillama
Instead of rising with the improved TVL, HBAR’s value has declined. This suggests that the market is currently prioritizing technical signals over fundamental indicators, a common occurrence during prolonged bear markets.
Although the price chart indicates risk, momentum indicators reveal that some investors are still trying to capitalize on the dip to buy more.
Retail Investors Continue Accumulating HBAR Amid Downtrend
Despite negative signals from the technical pattern, retail investors seem to remain actively involved, as reflected in the Money Flow Index (MFI). This indicator measures buying and selling pressure by combining price movements with trading volume, often used to identify accumulation during price declines. An increasing MFI suggests buyers are taking advantage of price corrections.
From February 5 to March 7, HBAR’s price has shown a slight upward trend. During the same period, the MFI also moved higher, indicating continued buying during dips.
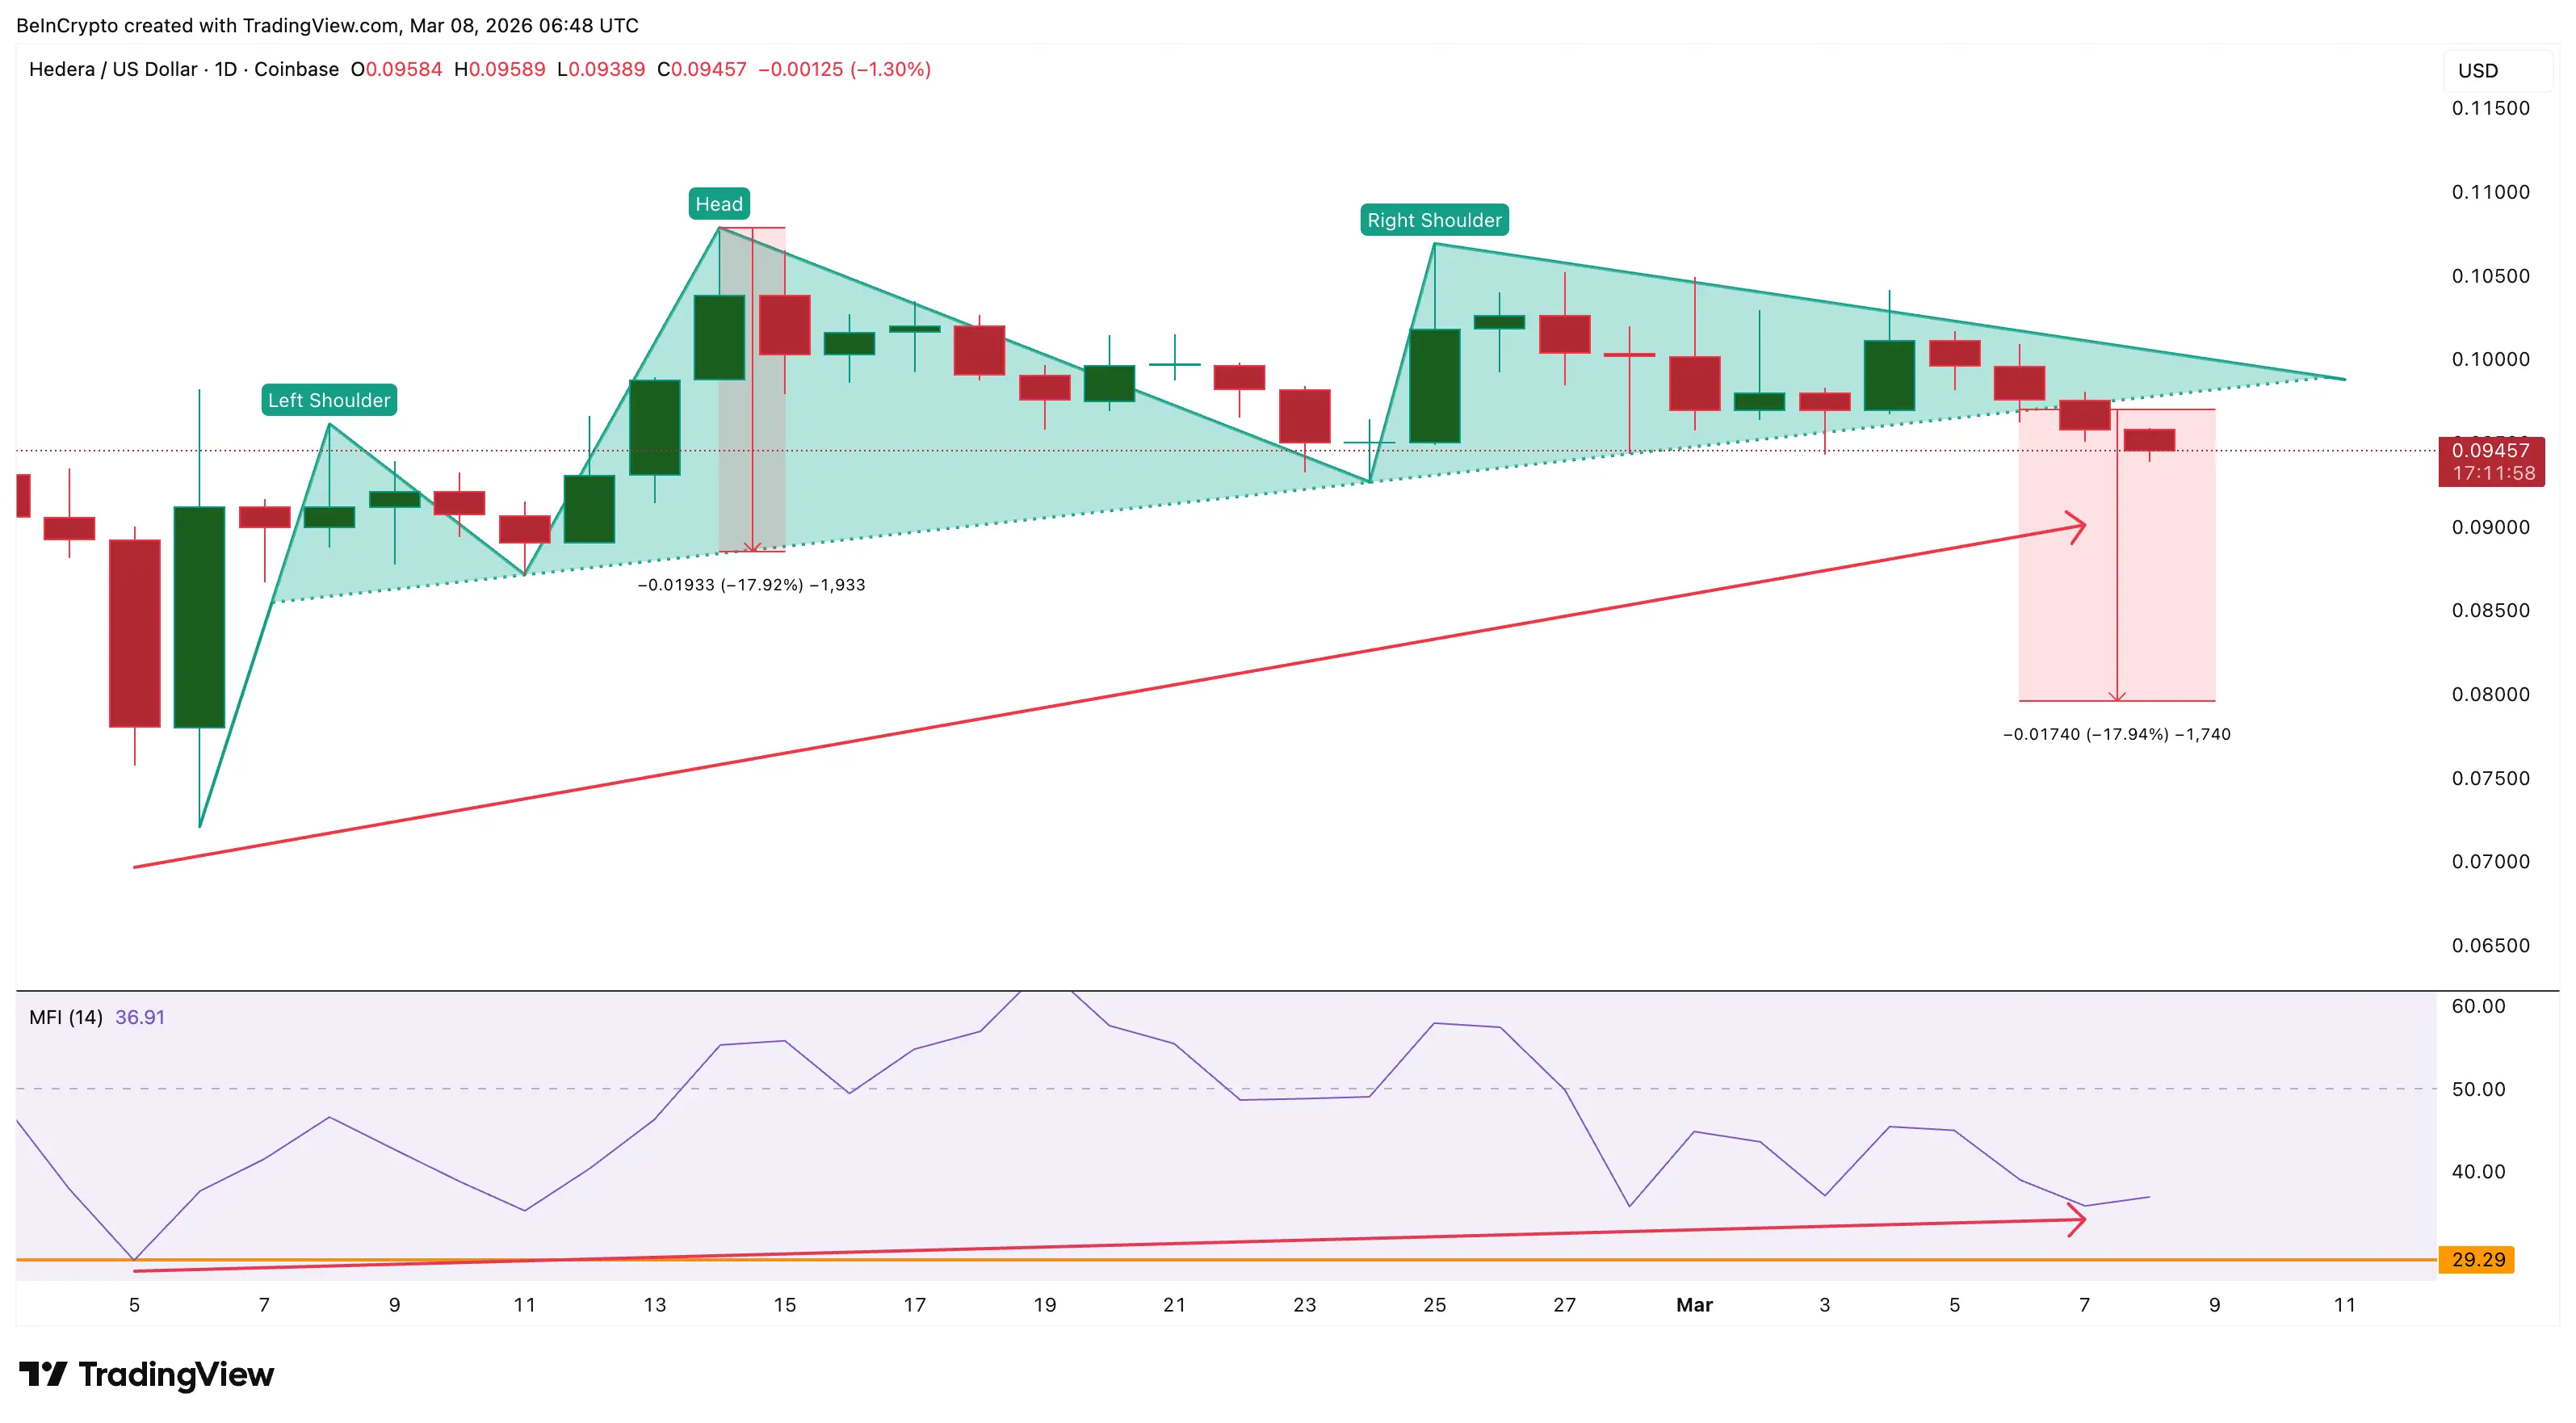 Buyers Actively Accumulating | Source: TradingView
Trading volume data on exchanges also supports this view. Since March 5, despite the weakening price, HBAR has experienced continuous outflows from exchanges. This indicates tokens are being withdrawn rather than added for trading.
Even after the head-and-shoulders pattern was broken on March 7, the outflow trend persisted. Most recently, about $526,770 worth of HBAR has left exchanges, showing some investors are still accumulating despite technical signals pointing downward.
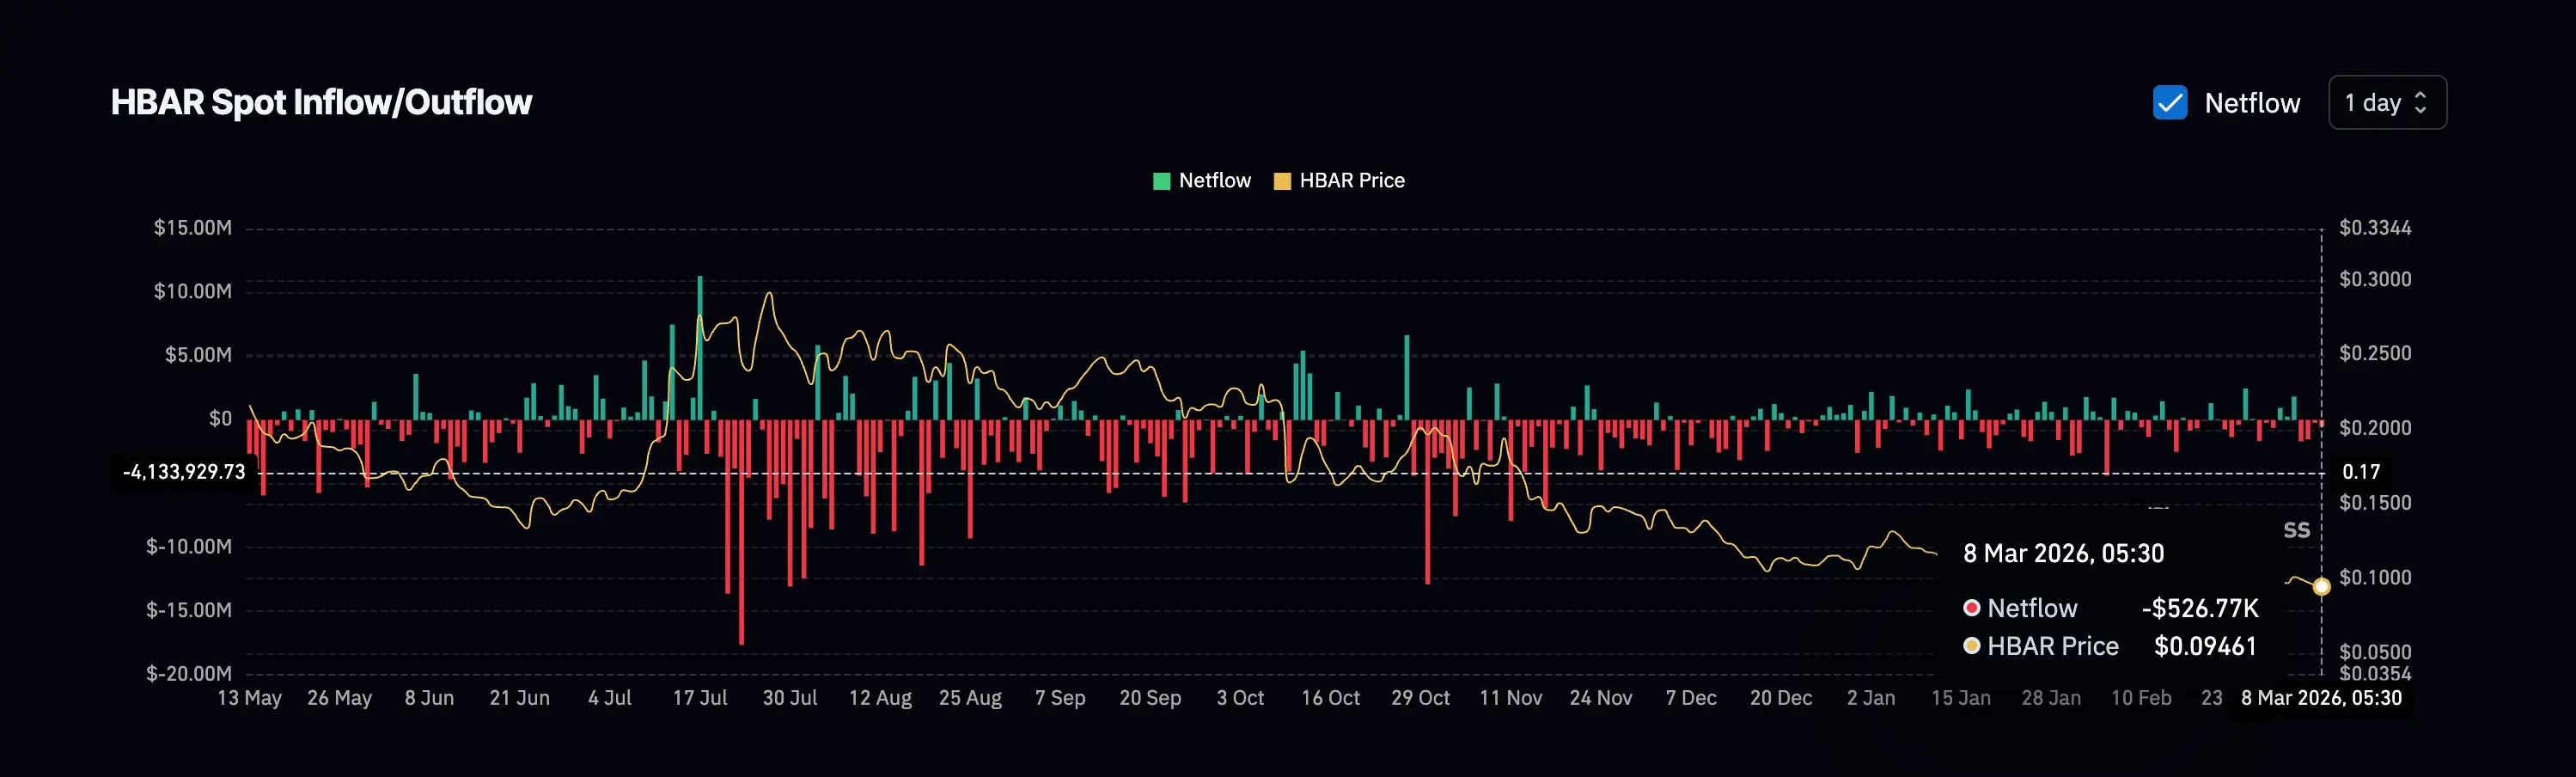 Buyers Are Active | Source: Coinglass
However, retail buying alone is unlikely to be strong enough to reverse the downtrend. For the market to stabilize and recover, larger capital inflows are needed.
Large Capital Outflows Increase Downside Risk
The Chaikin Money Flow (CMF) indicator provides a clearer view of how big money is moving. This indicator tracks whether capital is flowing into or out of an asset by combining price changes with trading volume, often regarded as a measure of institutional investor activity.
Recently, the CMF has fallen below zero, signaling that outflows have surpassed inflows from retail investors. Notably, the CMF has also broken below a steady upward trend line maintained since early February—previously a support level for HBAR’s price.
When the CMF breaks this structure, it usually indicates large investors are pulling capital out of the market, even if retail investors continue buying. Overall, the CMF remains slightly rising along with the price, suggesting that large outflows are not yet overwhelming.
 Large Capital Outflows | Source: TradingView
This creates a weak scenario: retail investors are still actively accumulating, but large capital is decreasing, increasing the risk of further declines based on technical structure.
Downside Risks Remain on the HBAR Chart
After breaking the neckline, the current head-and-shoulders pattern projects a potential drop to $0.079. From the neckline, this represents an 18% decline, and from the current price near $0.094, the remaining risk is about 15%.
To regain upward momentum, HBAR needs to break above $0.101, a resistance level that has repeatedly prevented gains since late February. A stronger recovery would require surpassing $0.106, while the entire bearish pattern would be invalidated if the price exceeds $0.107.
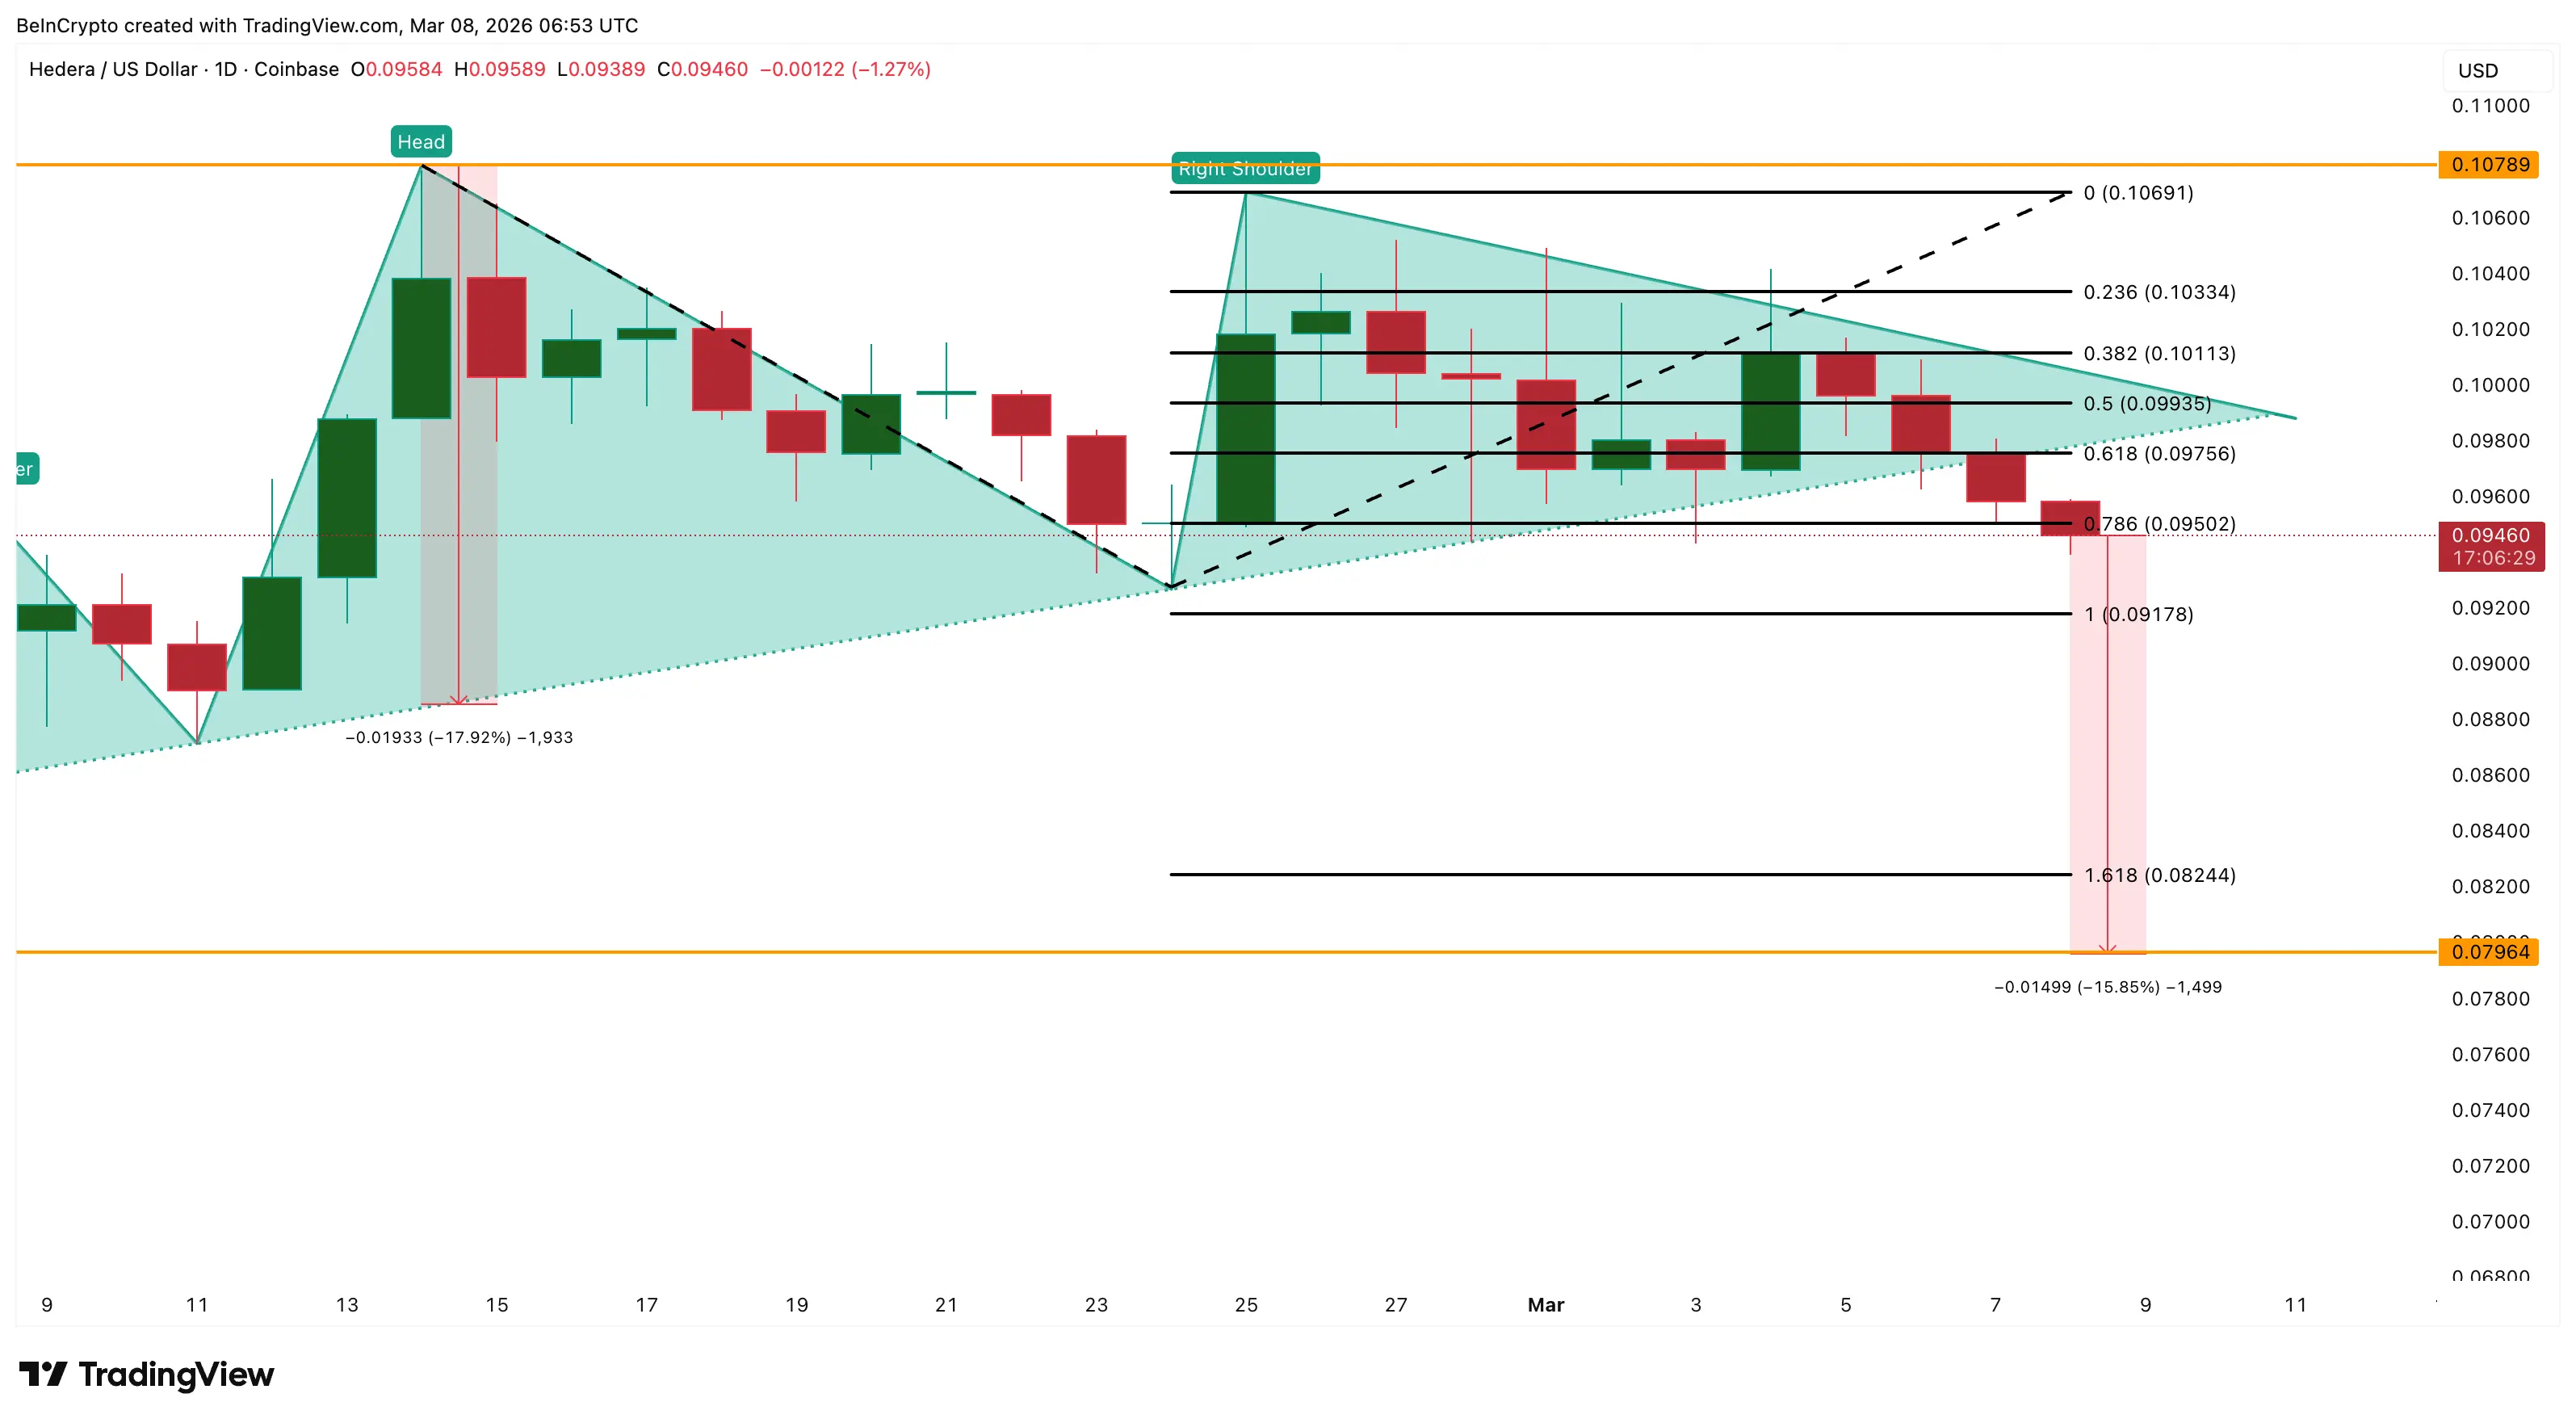 HBAR Price Analysis | Source: TradingView
However, if HBAR cannot quickly break above $0.095, the downtrend will likely continue. In this case, support levels are at $0.091 and $0.082, before reaching the final target of the head-and-shoulders pattern at $0.079.
In summary, HBAR faces a challenging period as positive fundamentals are not enough to support the token’s value amid a weakening overall market. The contradiction between technical signals and fundamental factors raises significant questions about the short-term outlook for this “Made in USA” coin.