The Solana (SOL) price chart is showing signs of weakness overall. Currently, the token’s value has decreased about 10% compared to last month, reflecting a general cooling of the cryptocurrency market. However, this decline masks a notable development. Between February 6 and March 4, Solana experienced a strong rebound, rising from $67 to $94, a nearly 40% increase in less than a month.
However, this rally is not entirely convincing, especially for long-term holders. The lack of confidence from this core investor group, combined with new technical signals, creates a potential risk of a correction in the future.
The $94 rally is not enough to convince long-term holders
During price recoveries, long-term holders often play a key role in strengthening the uptrend. When they continue accumulating assets during rising prices, it usually indicates strong confidence in the asset’s long-term potential. However, Solana’s recent rebound tells a different story.
Data from the HODL Waves indicator, a tool that analyzes investor groups based on holding periods, shows that on February 3, those holding SOL for at least three years controlled about 9.77% of the supply. But as the rally began on February 6, this group started gradually reducing their holdings from February 8 onward.
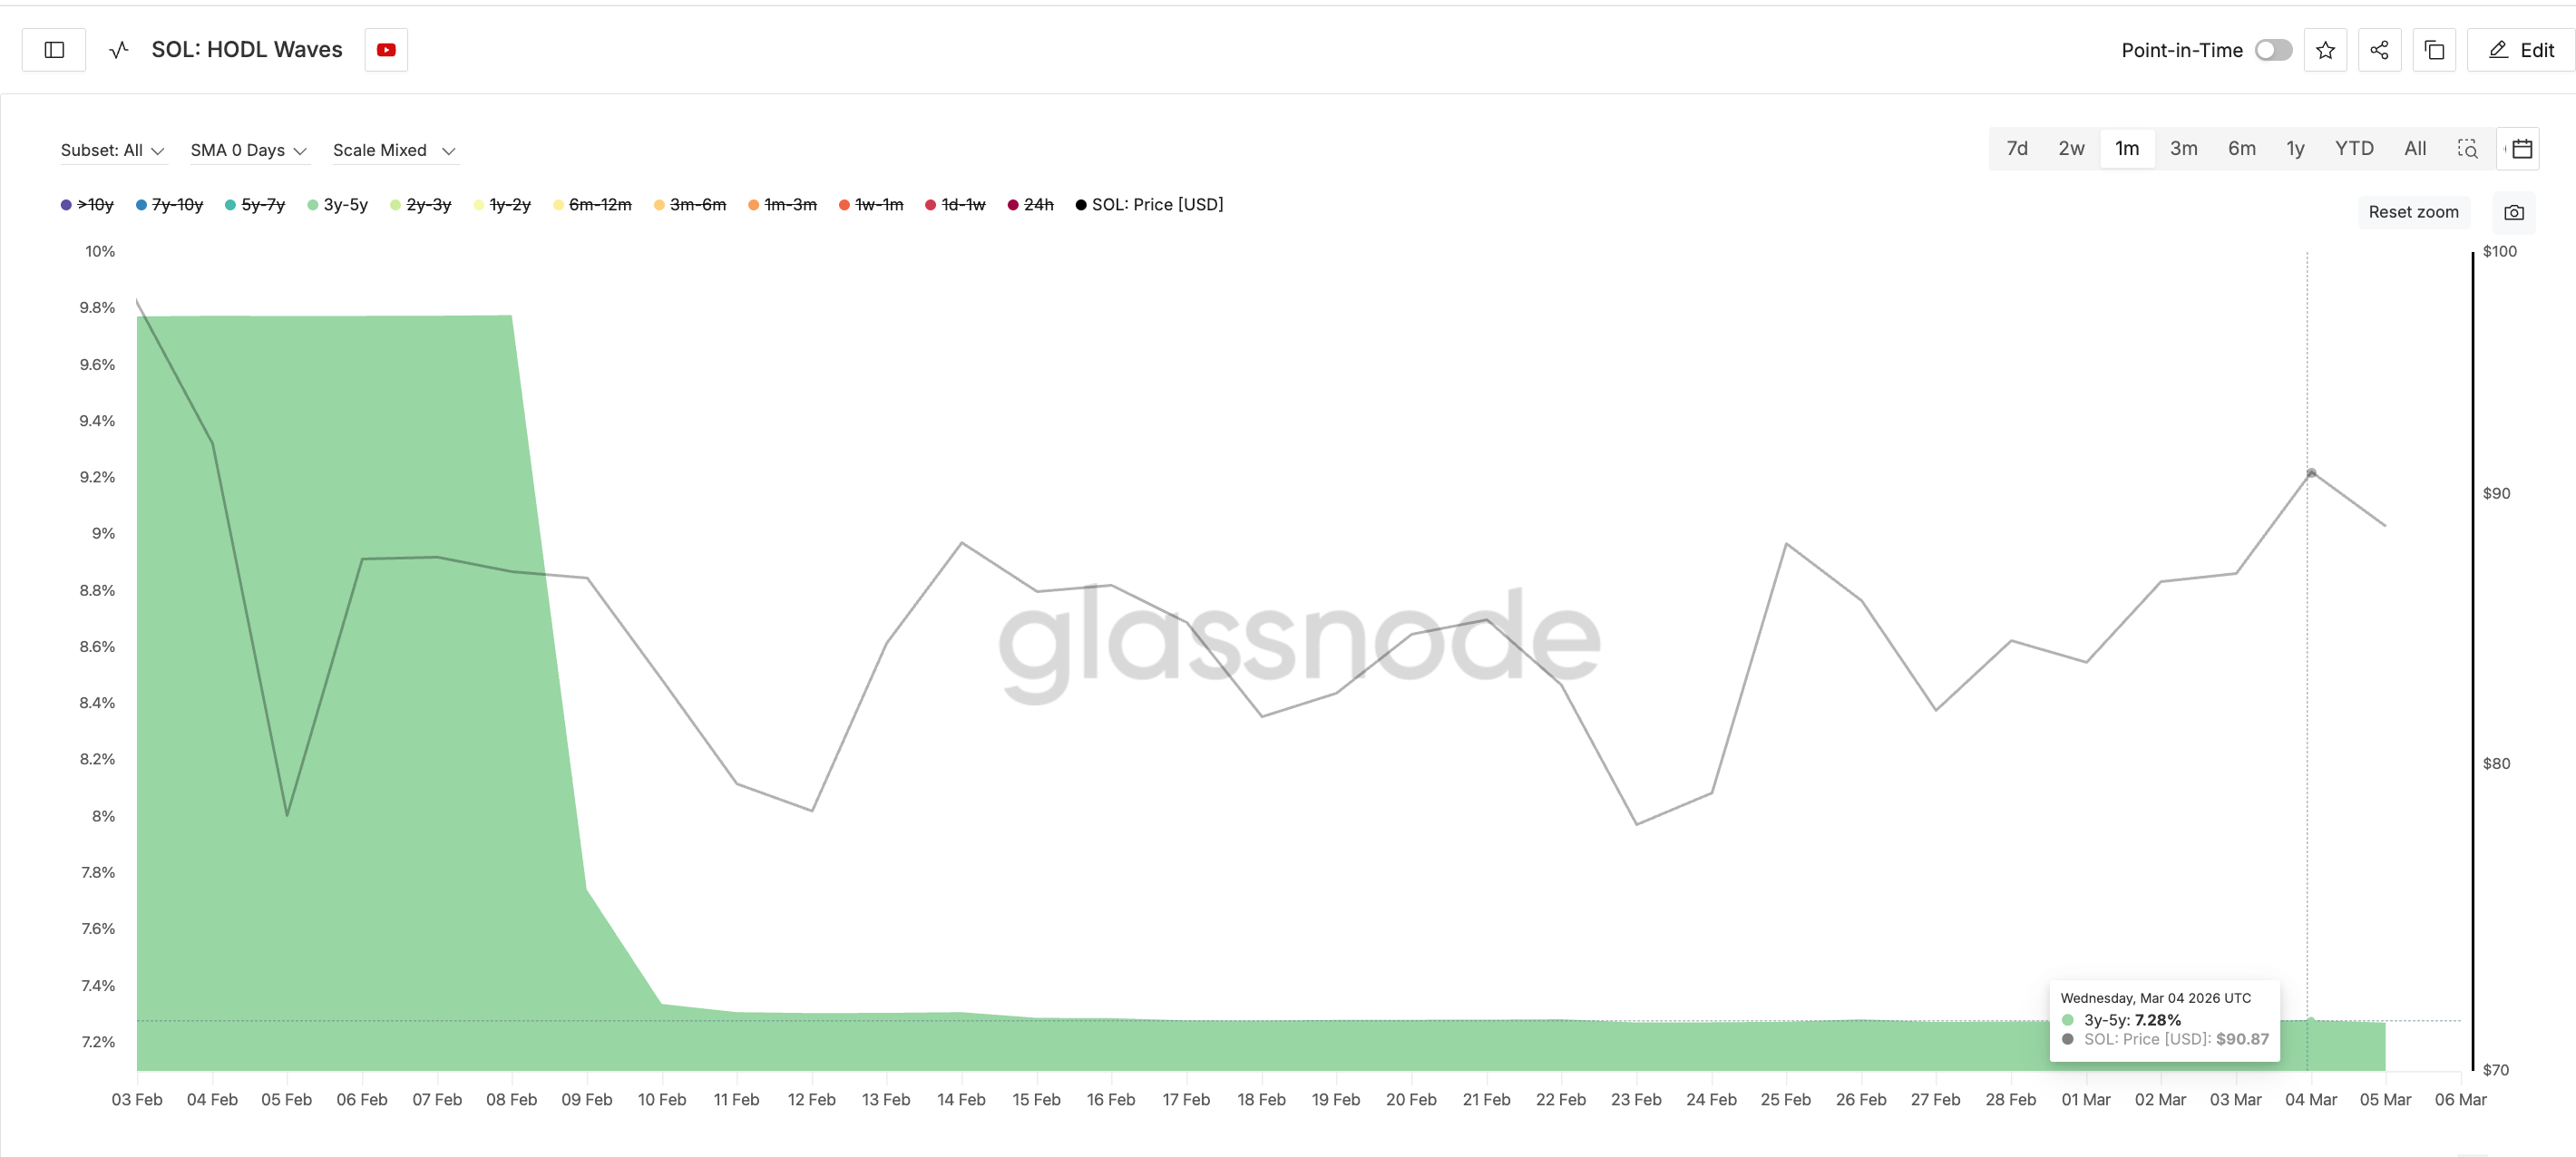 Source: GlassnodeMost sell transactions occurred early in the rally. By the time Solana hit the $94 peak on March 4, these long-term holders had almost not increased their holdings. Their ownership share dropped to around 7.28%.
 Solana price rises | Source: TradingViewThis indicates that the most loyal Solana holders did not return to support the rebound. This long-term confidence deficit becomes especially concerning as technical signals suggest momentum is weakening.
Hidden bearish divergence: Warning of waning momentum and potential sharp decline
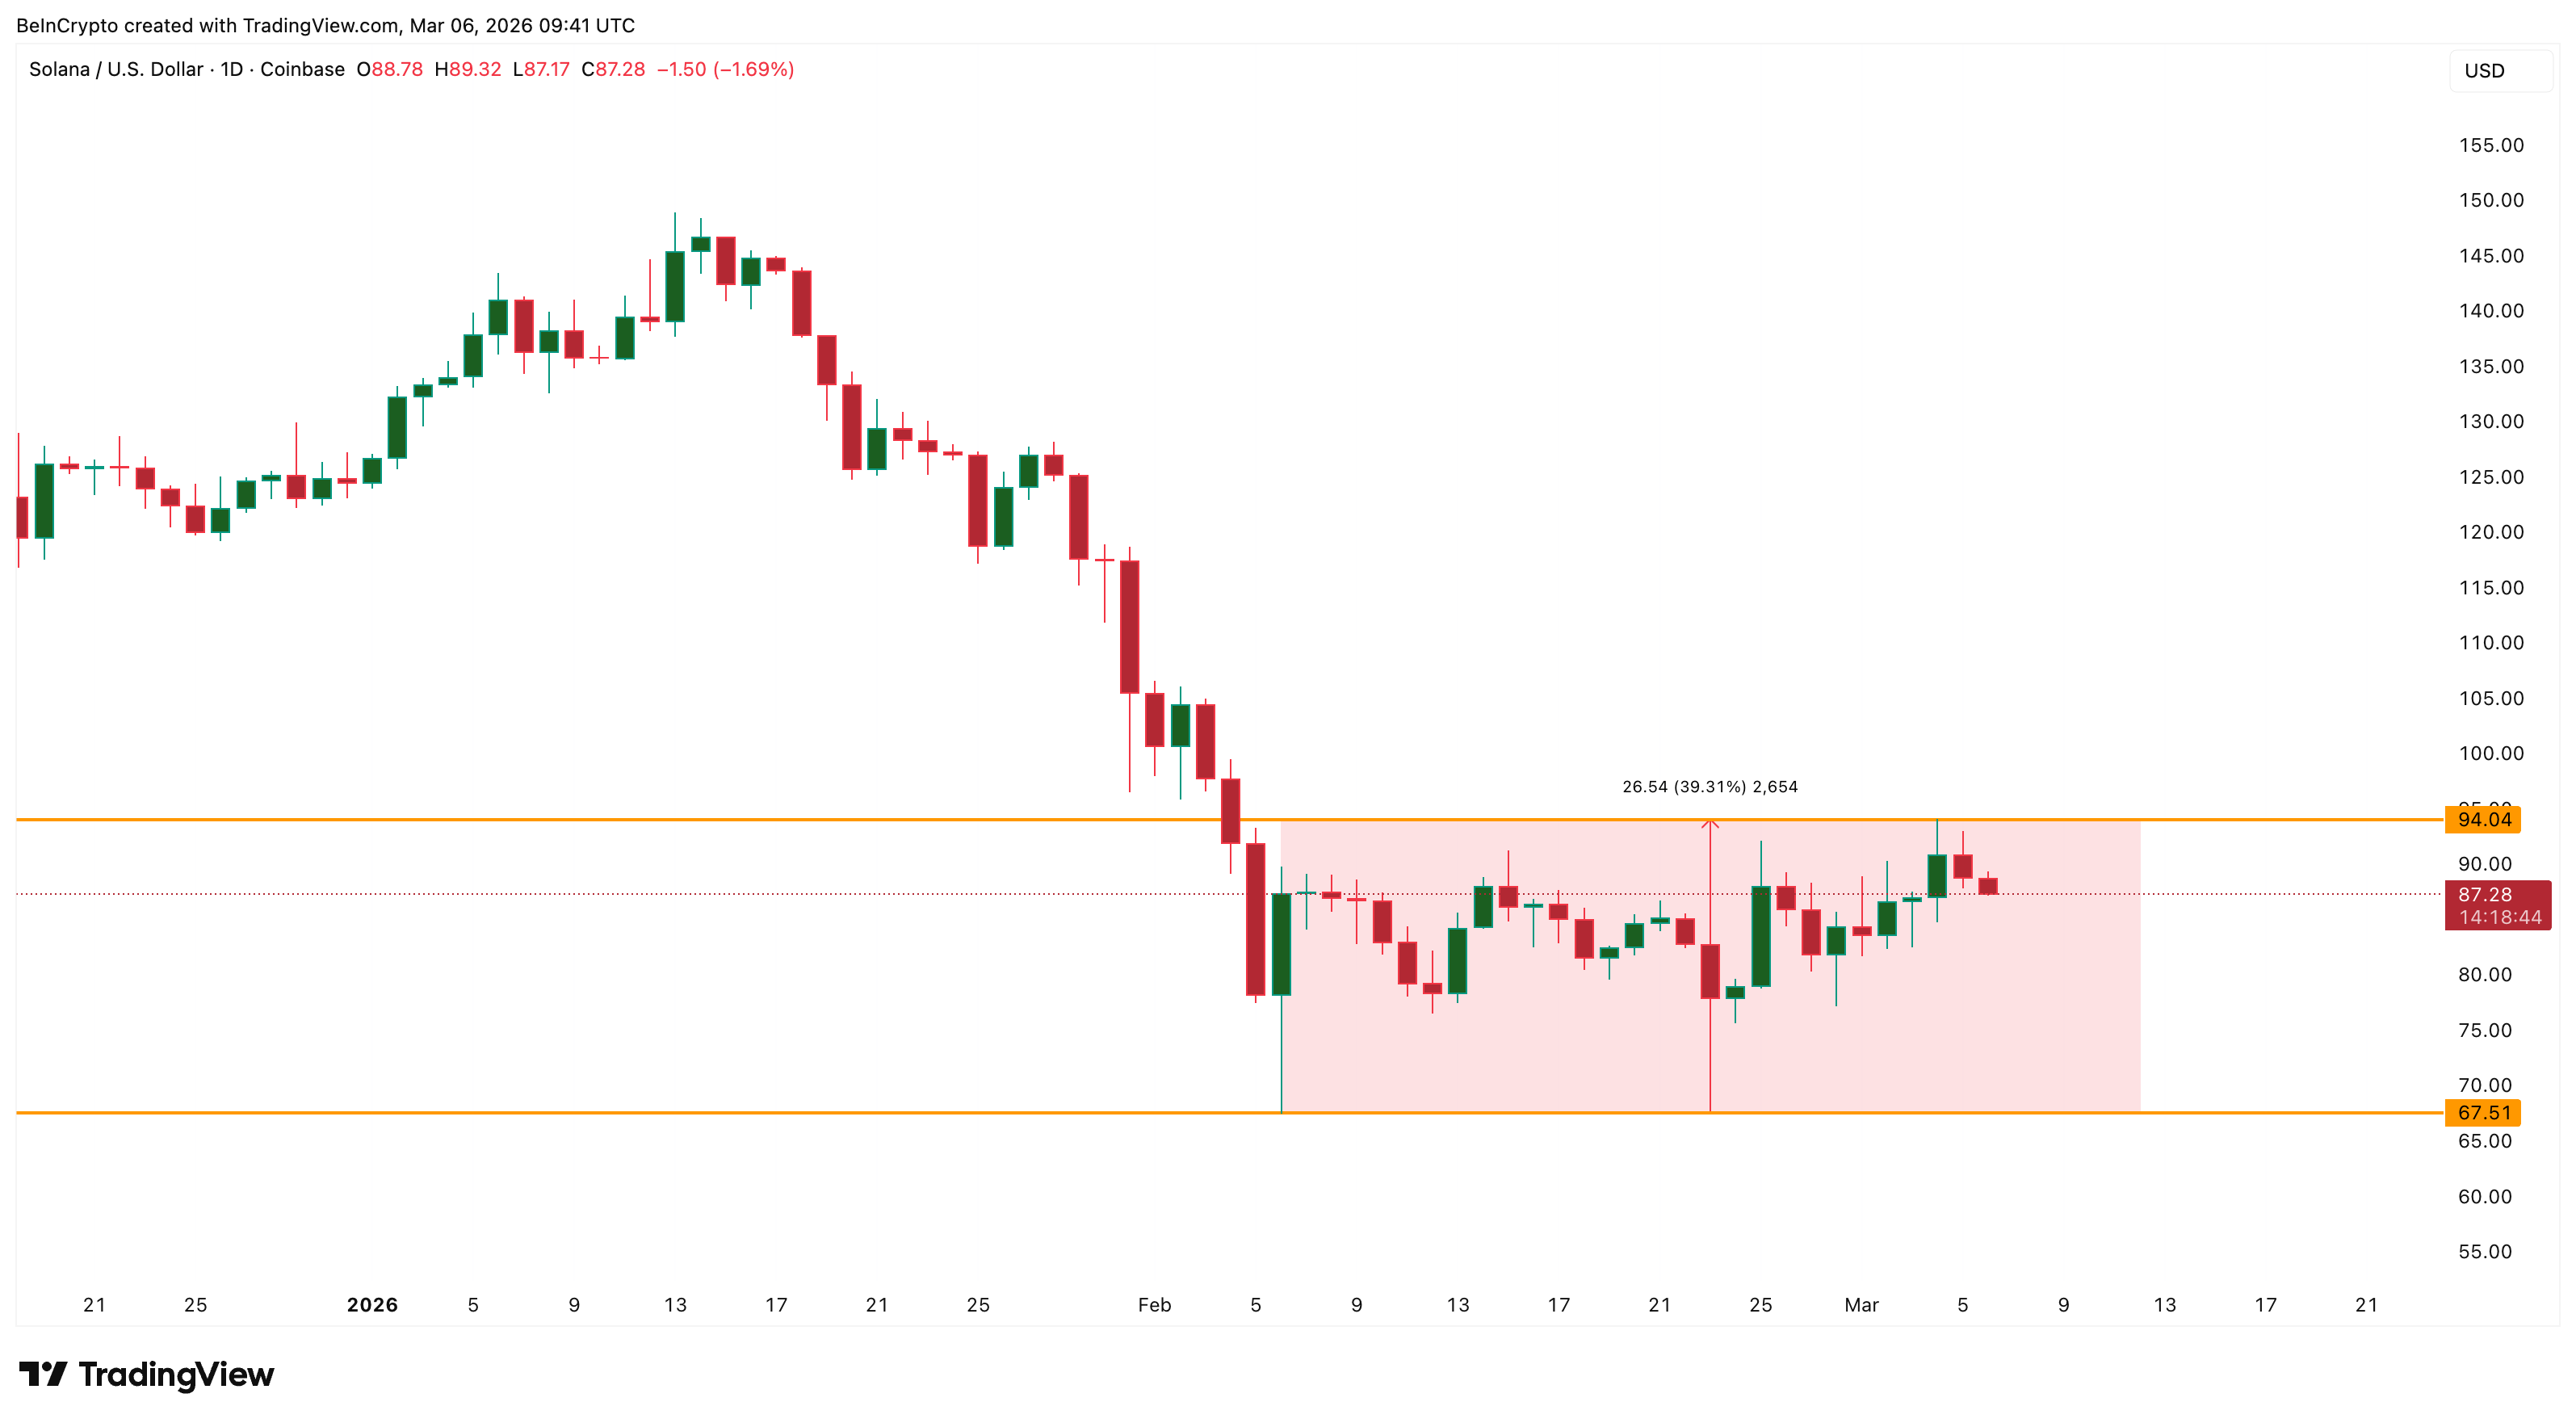
A clear warning signal has appeared on the price chart. From November 26 to March 4, Solana formed a hidden bearish divergence on the daily timeframe. This pattern occurs when the price makes lower highs while the Relative Strength Index (RSI) makes higher highs.
Hidden bearish divergence typically appears in prolonged downtrends and often signals the continuation of a decline. Currently, Solana remains within this context. Despite a significant recent recovery, the token has fallen about 34% over the past three months, indicating the broader downtrend still dominates.
The hidden bearish divergence started to take effect after Solana reached the $94 peak on March 4. Since then, the price has declined about 7%, showing selling pressure is gradually gaining strength. However, a key technical level still acts as the last barrier preventing a deeper drop.
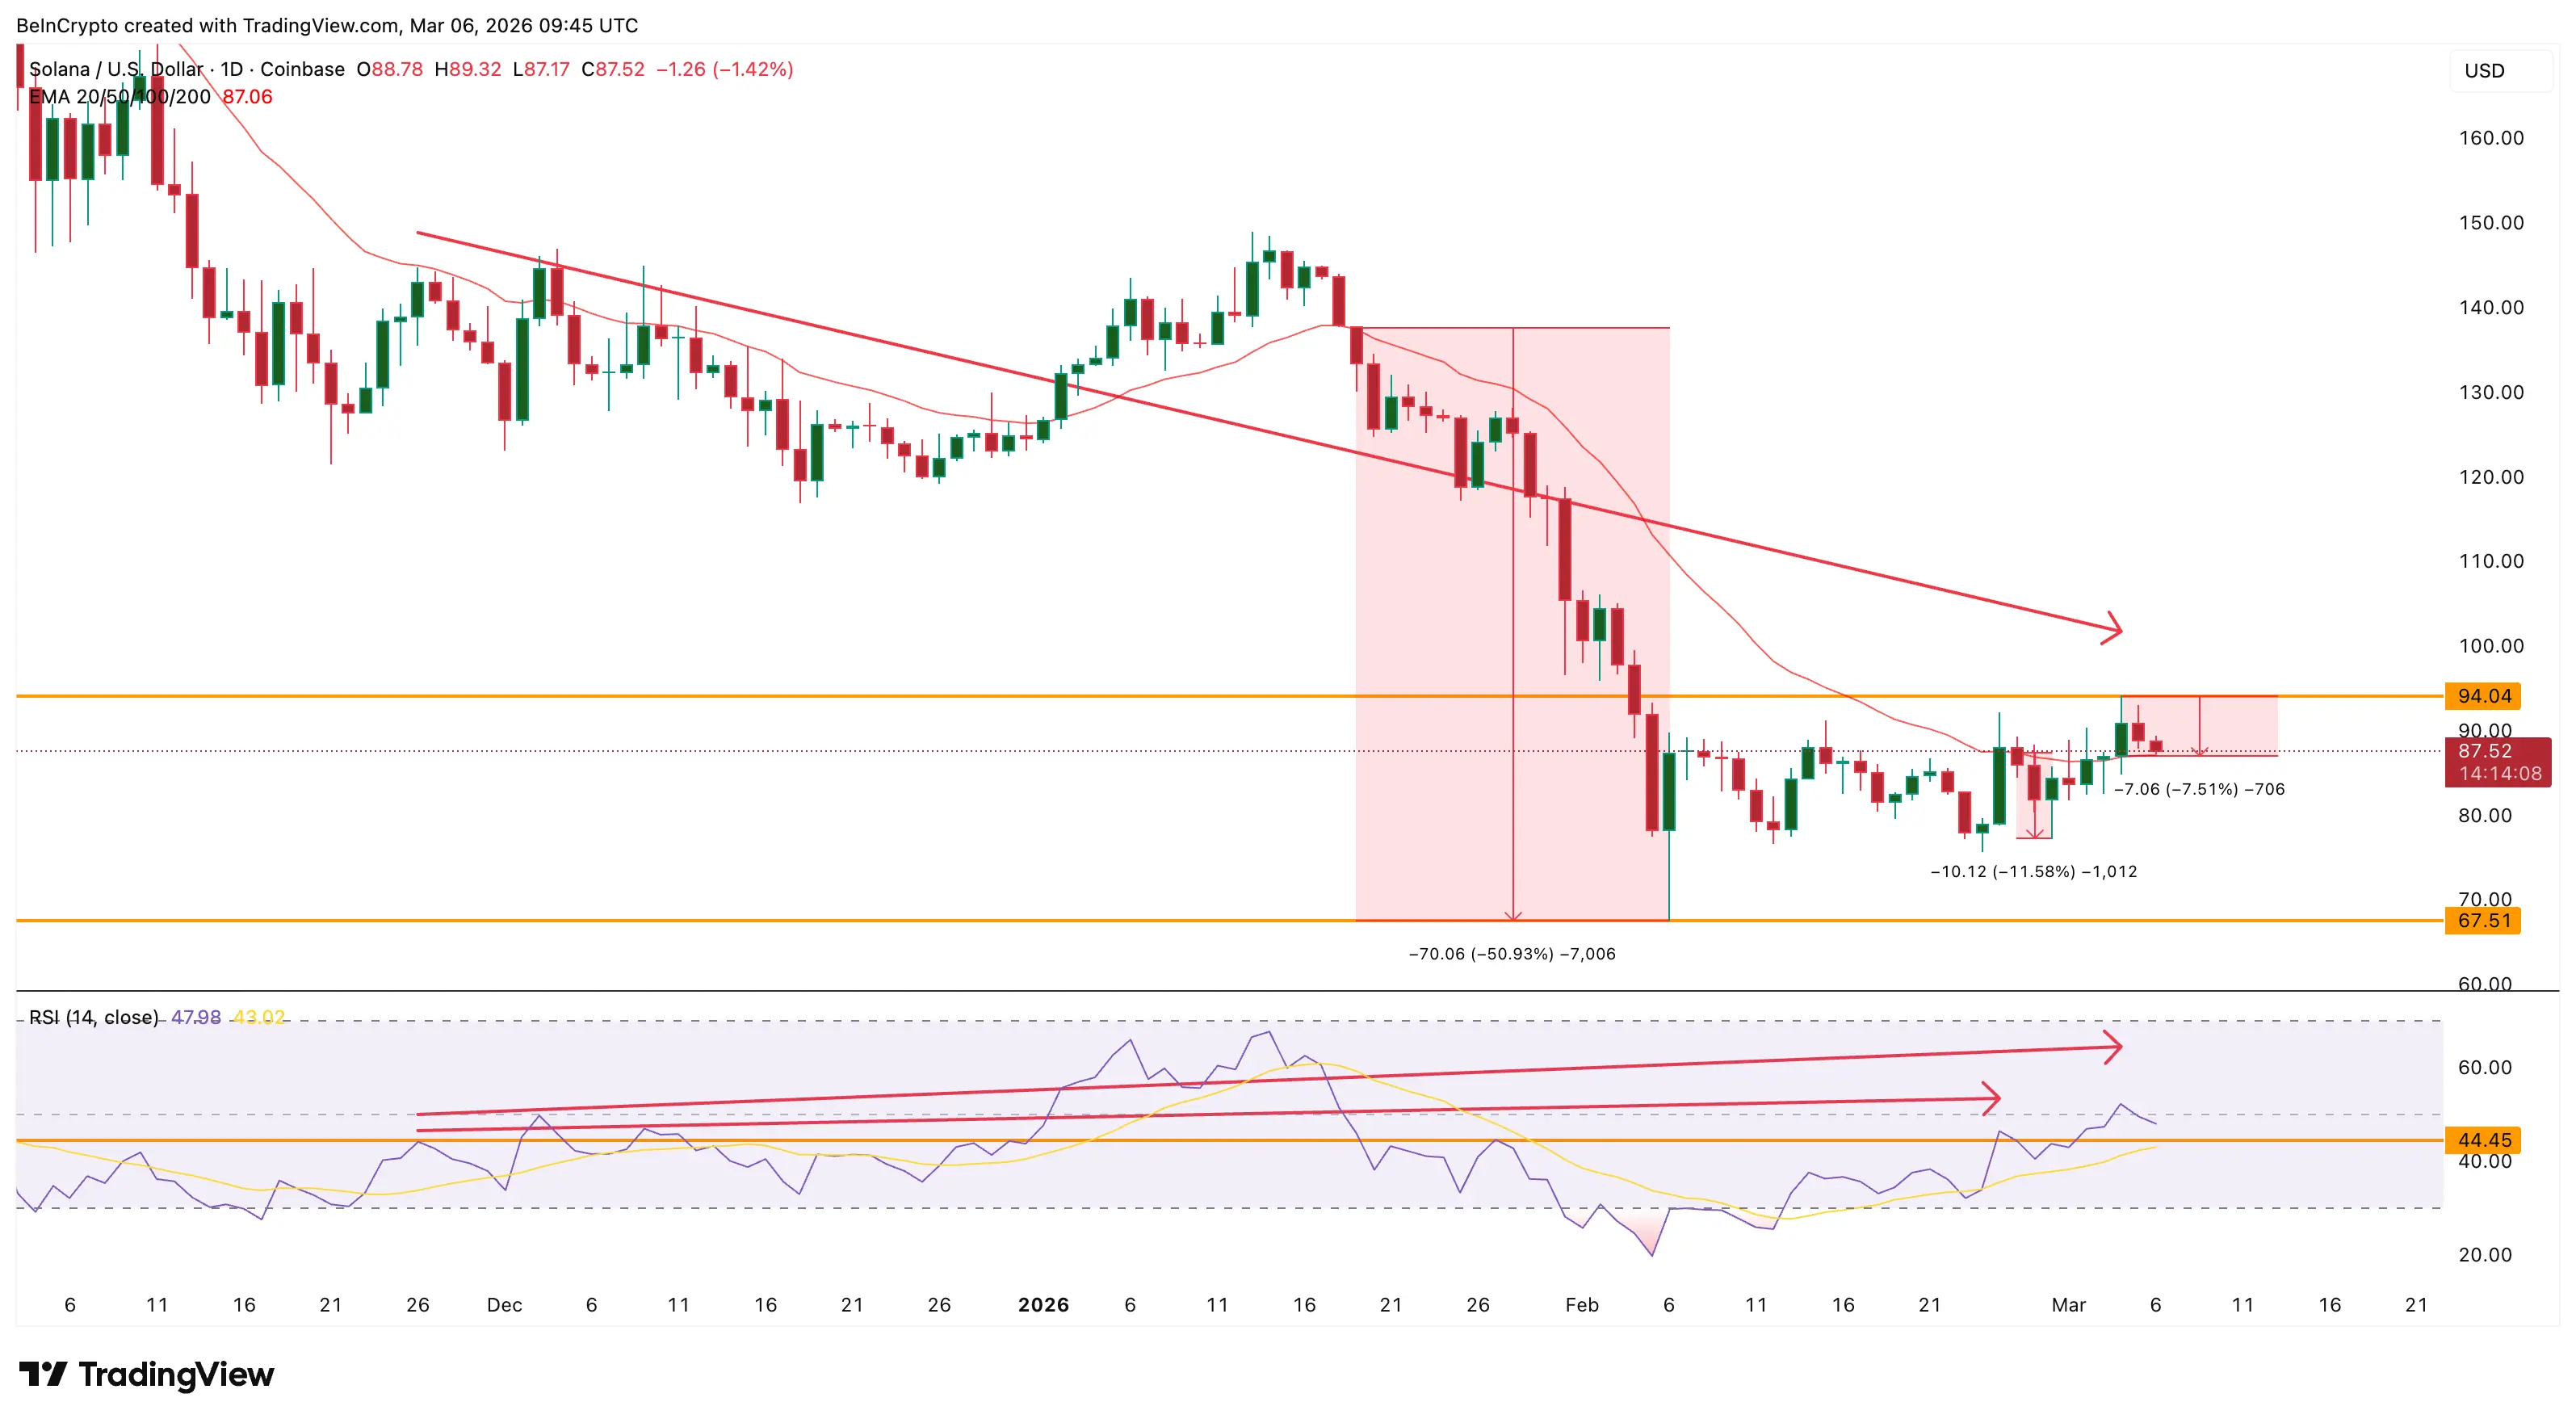
At present, Solana remains above the 20-day Exponential Moving Average (EMA), a trendline reflecting the average price over the past 20 days with more weight on recent prices. This EMA has repeatedly proven to be an important support level. When the price falls below the 20-day EMA, declines tend to accelerate sharply. For example, on January 18, when Solana broke below the ~$137 EMA, the price plunged to $67 by February 6.
 Hidden bearish divergence | Source: TradingViewHowever, this time, the market may lack a strong investor group to defend this support. Long-term holders have reduced their holdings during the rally, and now another group appears to be selling off.
Long-term holders start selling as Solana hits break-even levels
Although long-term holders sold during the initial rally, the medium- and long-term investor groups continued accumulating. The Hodler Net Position Change indicator shows that holders with over 155 days of holding have been steadily increasing their positions since December 24, 2025. For weeks, data recorded consistent accumulation.
However, this trend has suddenly reversed. The recent Hodler Net Position Change indicator turned negative, with a decline of about –635,750 SOL, indicating current selling activity has surpassed previous stable accumulation.
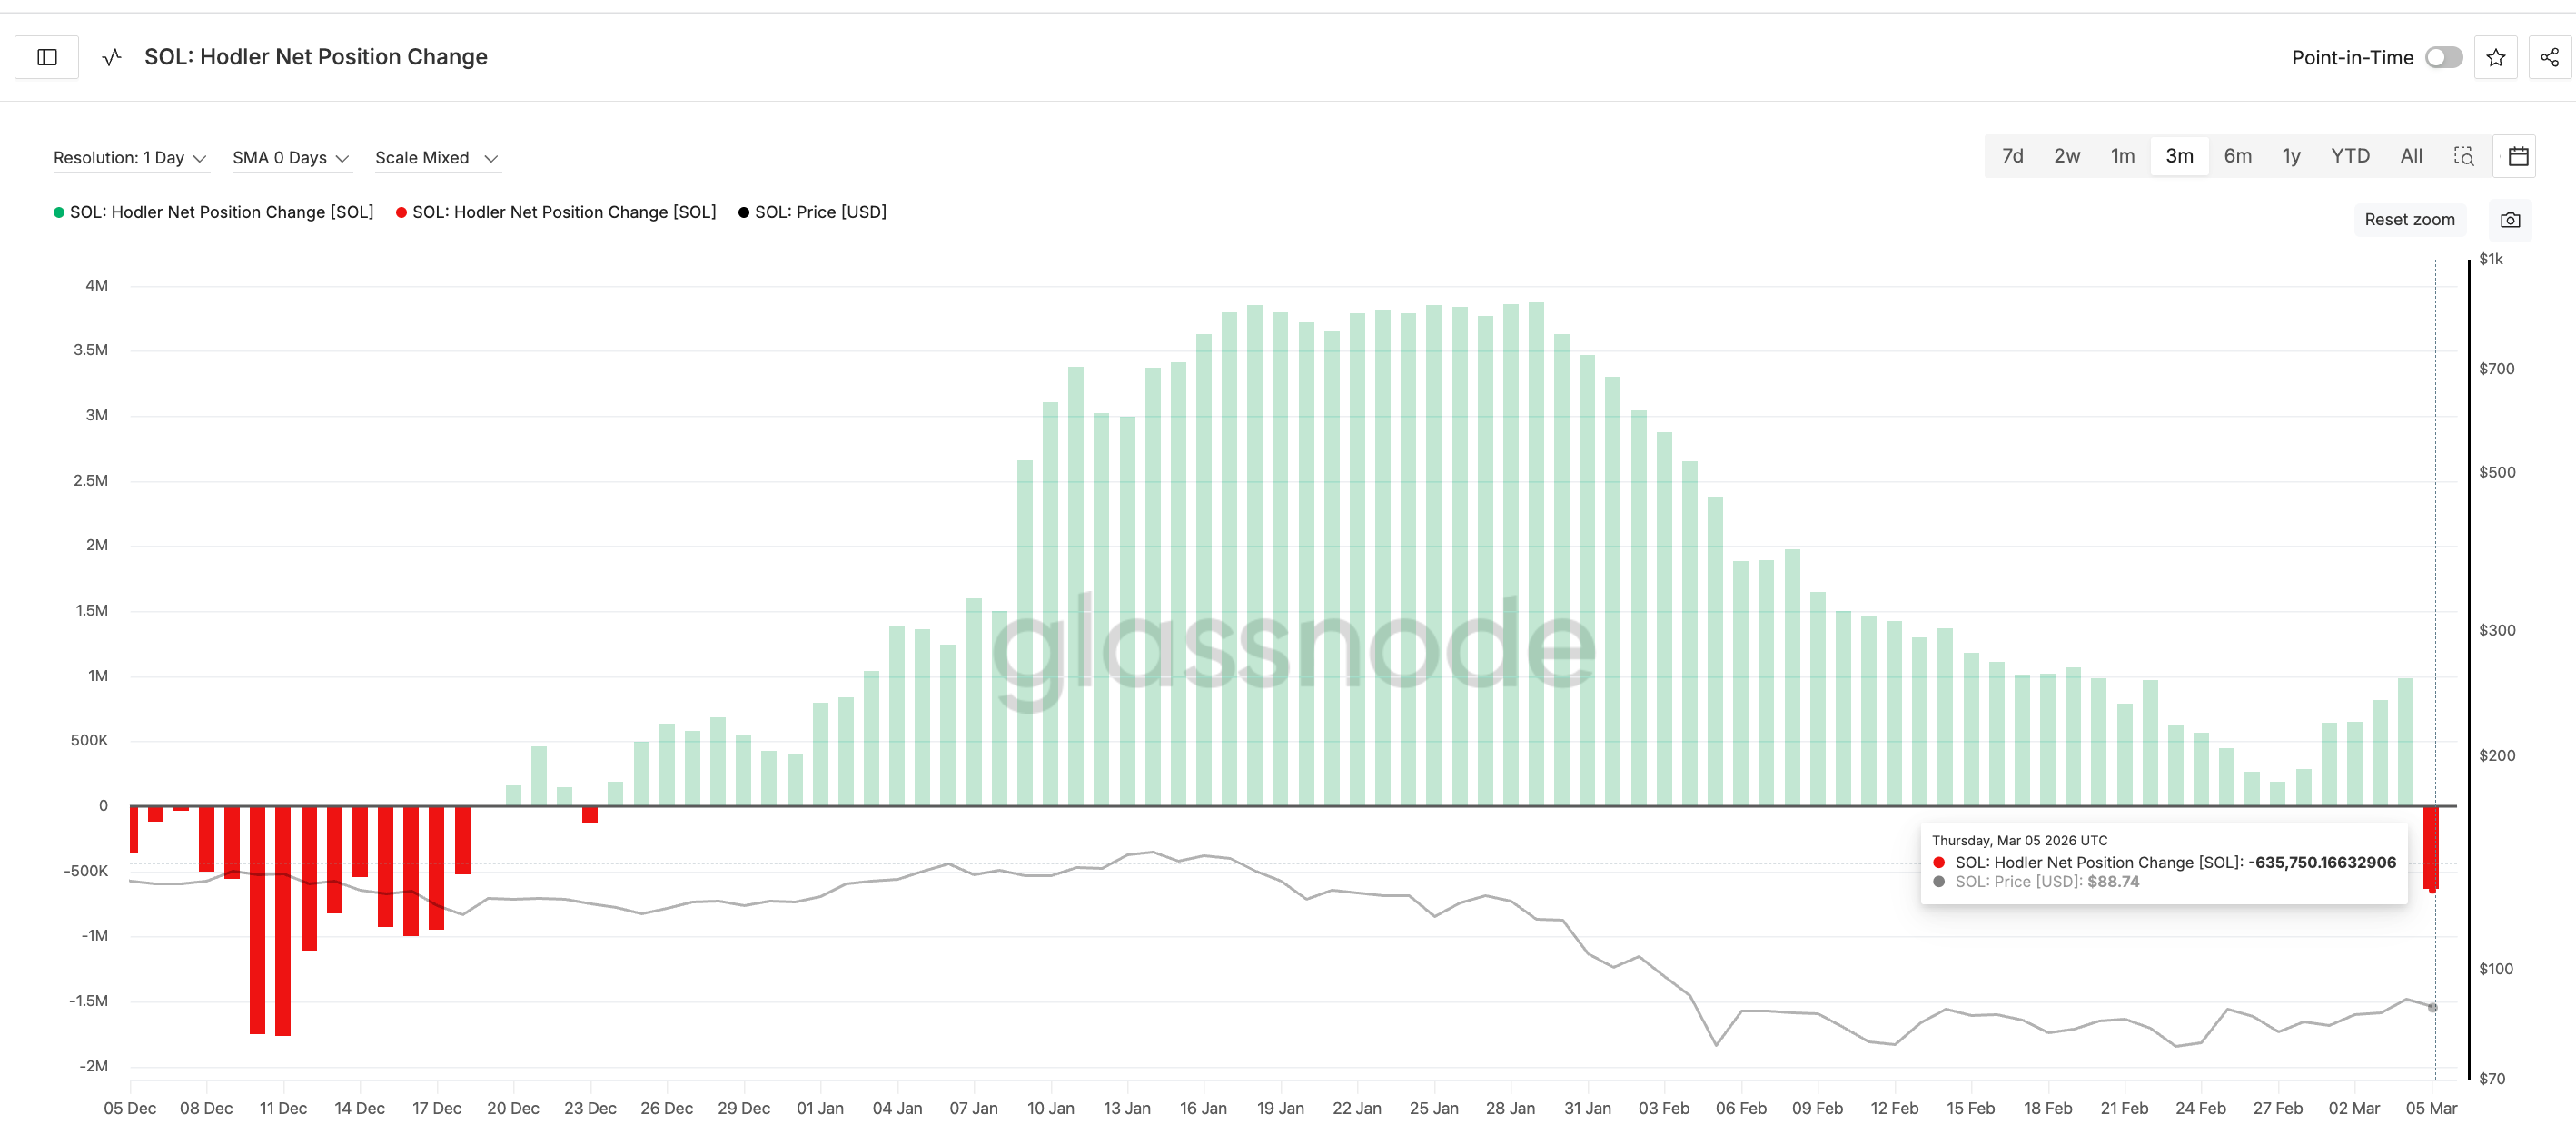 Holder exiting the market | Source: GlassnodeThis change occurred at a critical moment when Solana was trading within a key cost basis zone from $86.80 to $87.82. About 13.1 million SOL were accumulated within this range, making it one of the strongest support zones on the chart.
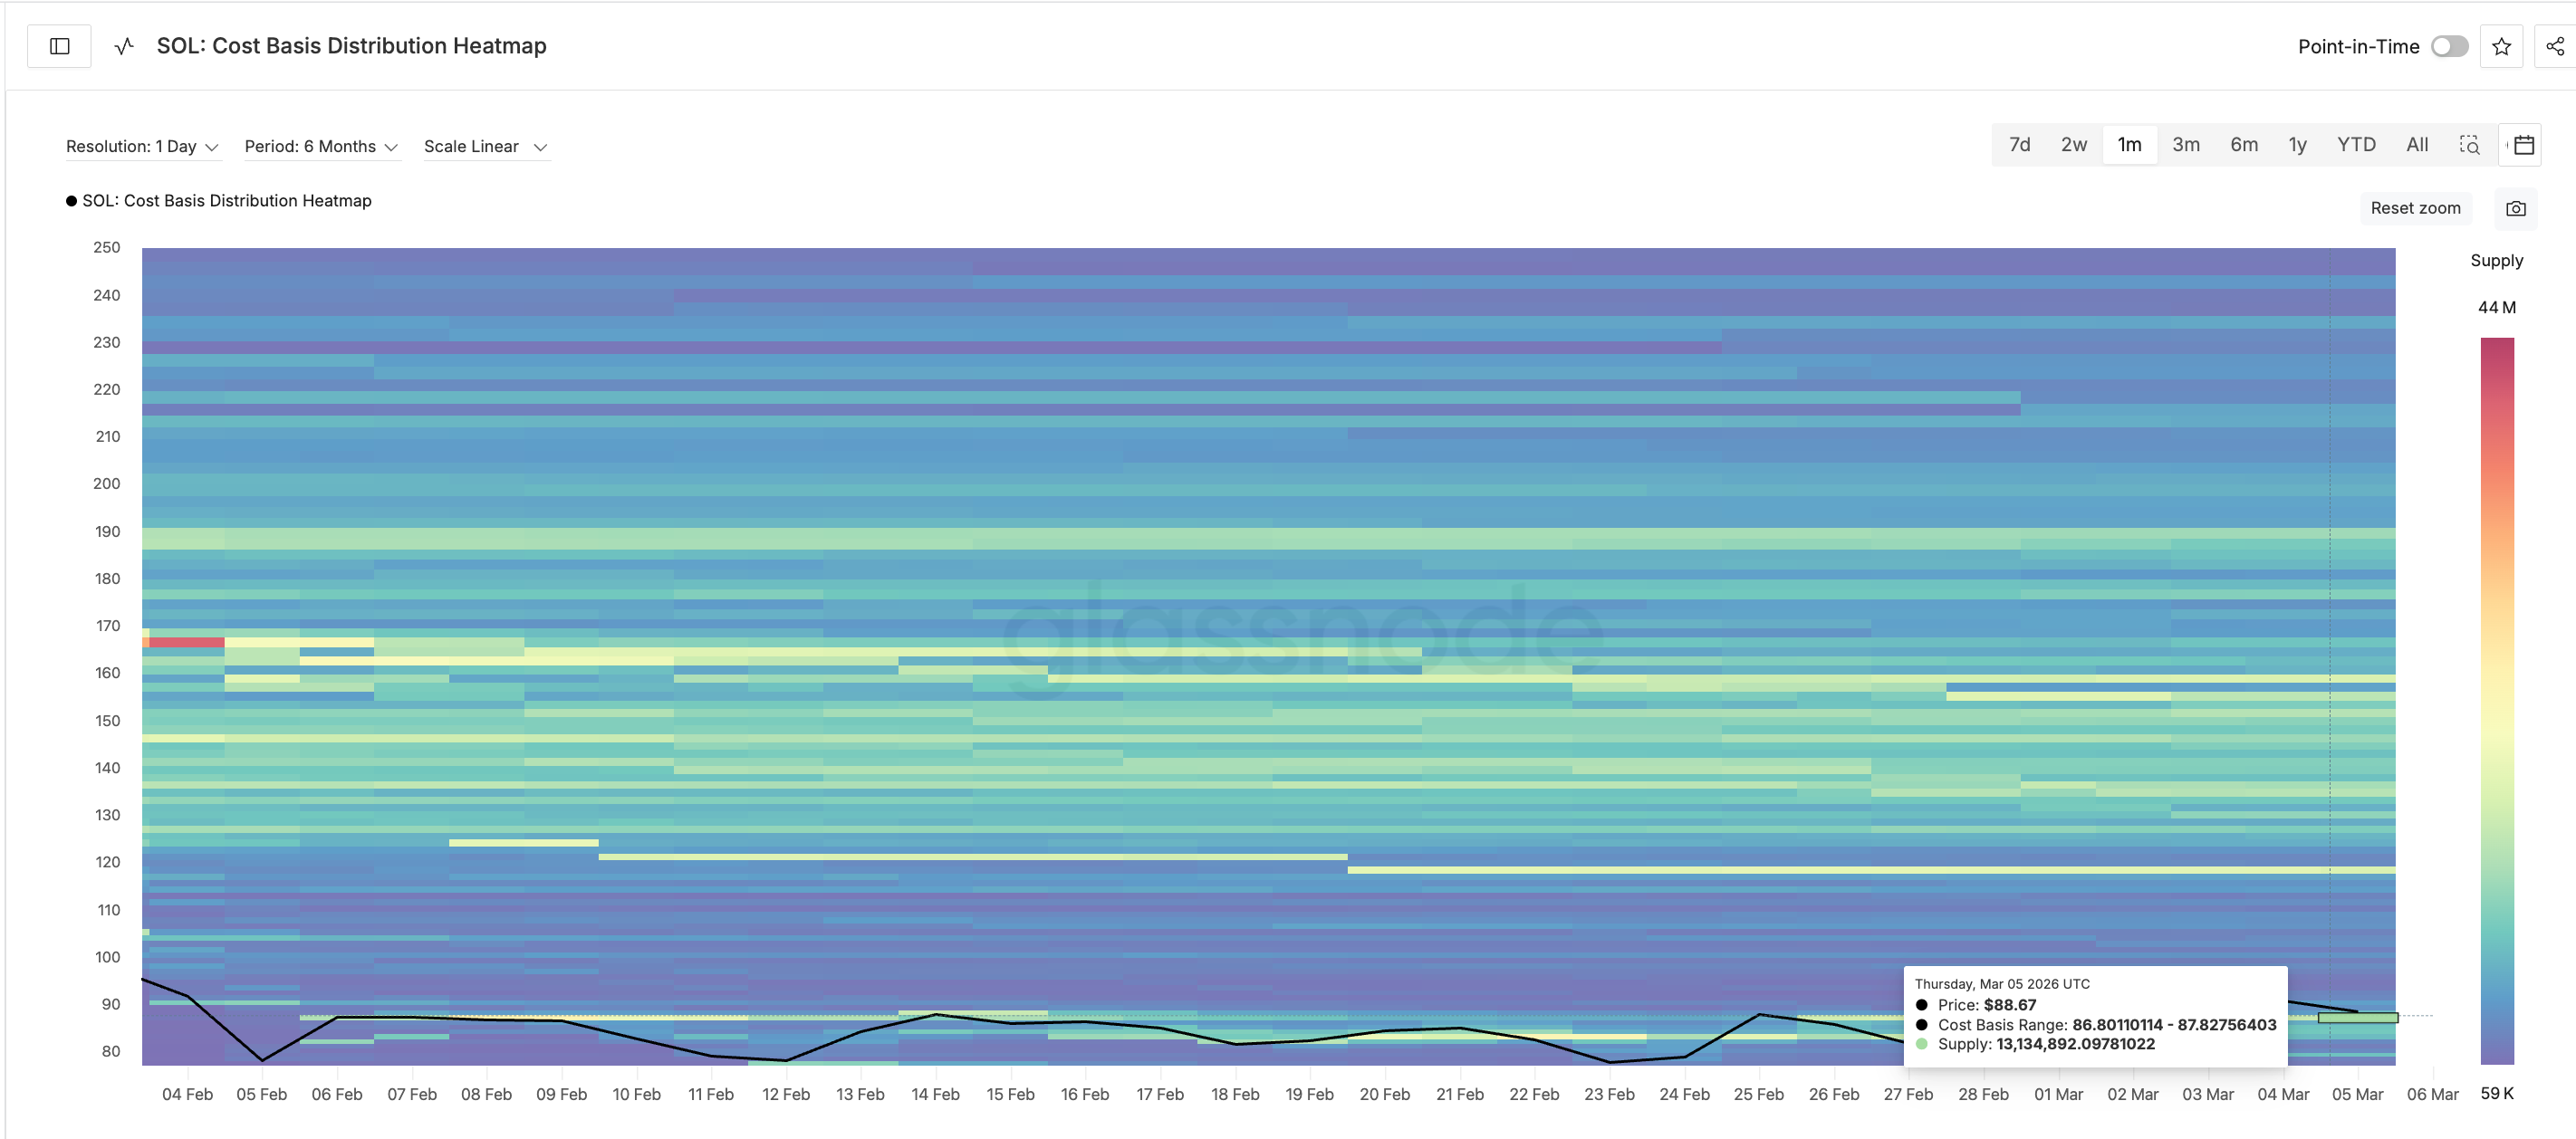 Cost basis heatmap | Source: GlassnodeCost basis zones often serve as strong support levels, as investors are generally willing to defend the prices at which they bought. However, if this zone is broken, the decline could accelerate rapidly.
Failing to hold the $87.82 level—the intersection of price and the cost basis cluster—could push Solana below both the 20-day EMA and the strong support zone. This scenario might trigger a deeper correction, with the price falling to $77.67, corresponding to the 0.618 Fibonacci retracement level. If weakness persists, the price could drop further to $73.21 or even $67.52—the initial price level that sparked the February rally.
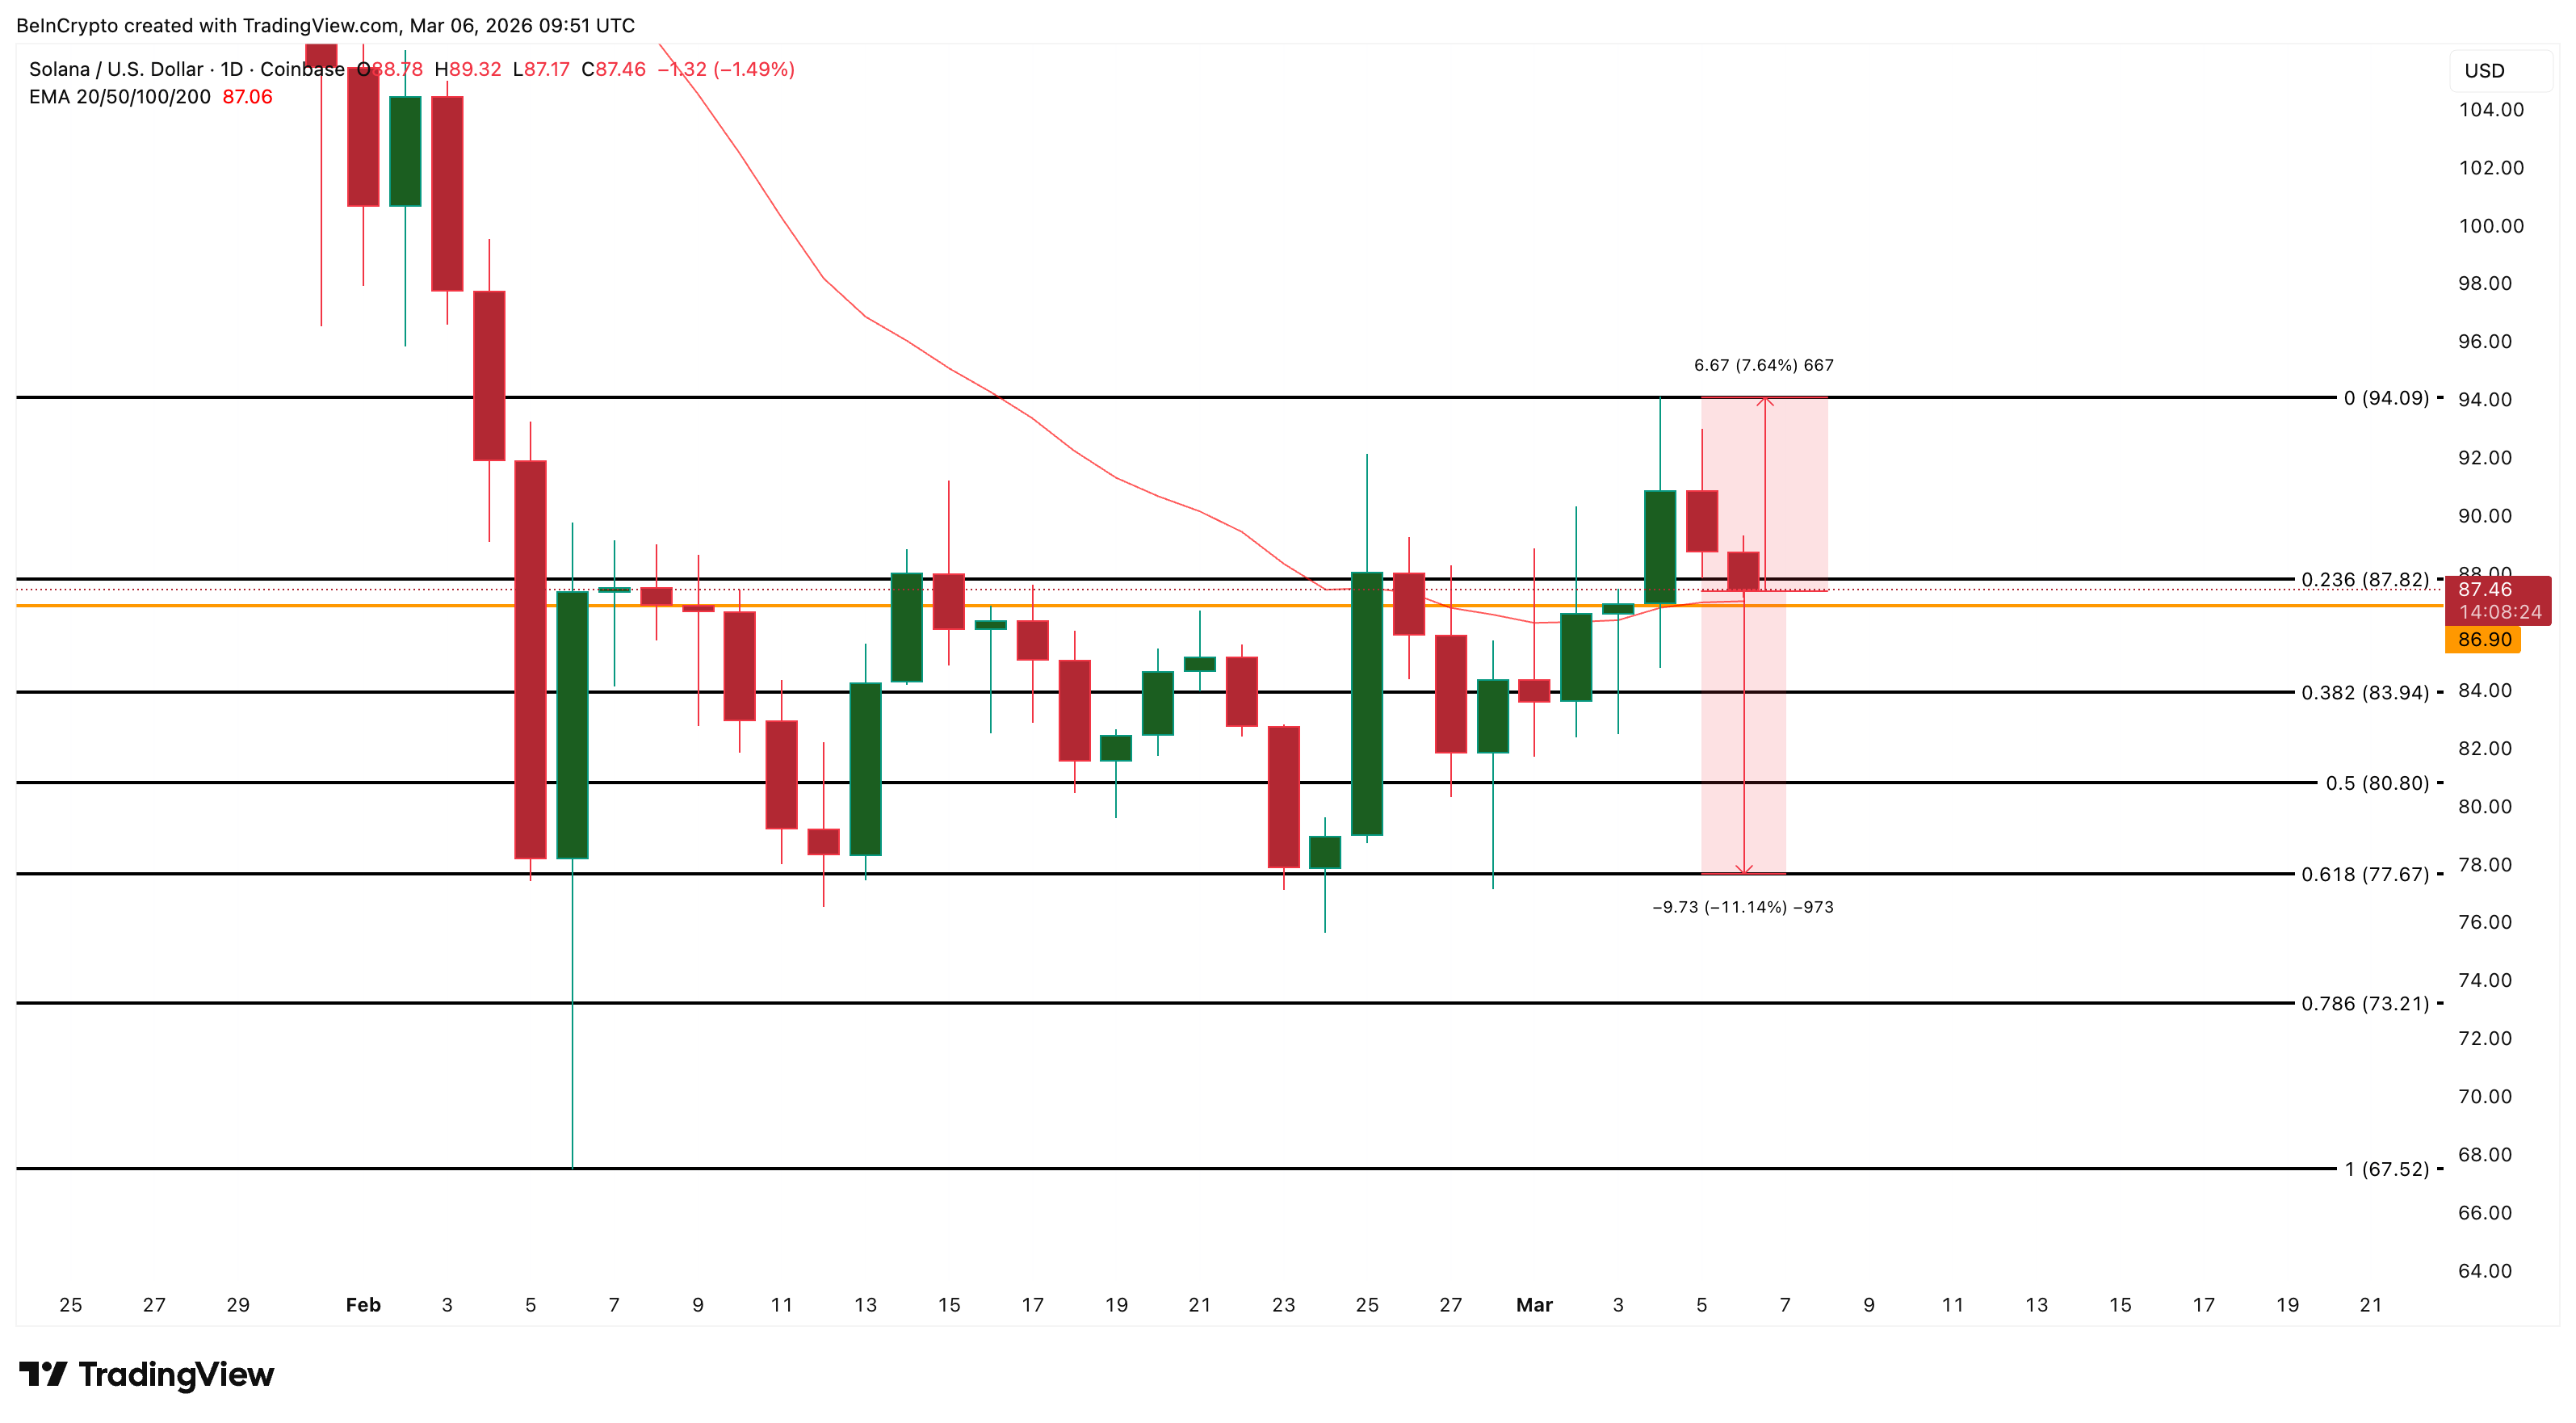 Solana price analysis | Source: TradingViewHowever, this negative outlook could be invalidated if buyers regain control. To restore upward momentum, Solana needs to break above the $94.09 level, the previous peak during the recent rebound.
Solana faces a critical crossroads
Currently, Solana is at a crucial crossroads. The $94 rally demonstrated short-term strong demand, but the lack of support from long-term investors makes this recovery uncertain. If selling pressure continues around the $86–87 support zone, the price is likely to decline further. Conversely, if buyers can regain control and push the price above key resistance levels, Solana could resume its upward trend in the near future.
Disclaimer: The information on this page may come from third parties and does not represent the views or opinions of Gate. The content displayed on this page is for reference only and does not constitute any financial, investment, or legal advice. Gate does not guarantee the accuracy or completeness of the information and shall not be liable for any losses arising from the use of this information. Virtual asset investments carry high risks and are subject to significant price volatility. You may lose all of your invested principal. Please fully understand the relevant risks and make prudent decisions based on your own financial situation and risk tolerance. For details, please refer to
Disclaimer.