U.S. spot Ethereum ETF funds attracted $169 million in net inflows on Wednesday — the highest in two months, according to data from SoSoValue. The new capital influx indicates that institutional investor interest in Ethereum is gradually returning, even as the global financial markets remain highly volatile.
Leading the capital flow is the Grayscale Ethereum Mini Trust ETF with $59 million. Following is BlackRock’s iShares Ethereum Trust with $39 million, while Fidelity Investments’ Ethereum fund attracted an additional $30 million.
Total daily inflows nearly reached the peak of $175 million recorded in January. The new capital momentum emerges amid escalating geopolitical tensions in the Middle East. Some investors are reportedly shifting funds away from traditional assets into cryptocurrencies as a hedge against global uncertainties.
At the same time, staking activity on the Ethereum network has picked up again. The amount of ETH waiting to become validators has increased to about 3.4 million ETH, while the withdrawal queue has decreased to 58,944 ETH, according to Validatorqueue data.
This increase has extended the validator onboarding time to approximately 57 days, reflecting growing participation in network security. The rise in staking registrations also indicates that many large investors continue to lock ETH to earn yields rather than sell during this volatile market phase.
Ethereum Price Forecast: ETH Faces Pressure Around $2,110
In the past 24 hours, Ethereum (ETH) saw approximately $58 million in liquidations, with $35.7 million in long positions, according to CoinGlass data. This suggests the market remains volatile, with traders continuously adjusting their positions amid sharp price swings.
On the daily chart, ETH is currently trading around $2,080. The short-term trend remains neutral but slightly tilted upward, as the price stays above the recent key support zone at $1,850, while market momentum is gradually stabilizing.
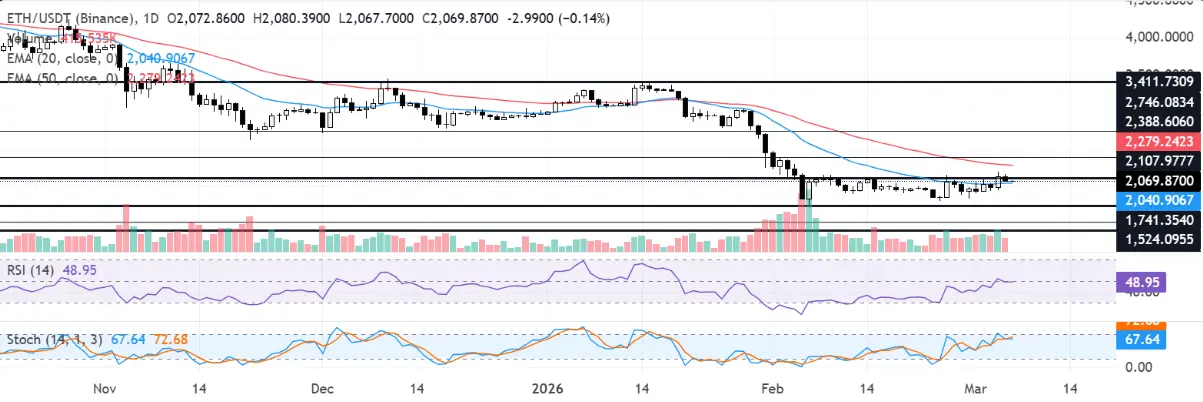 Daily ETH/USDT Chart | Source: TradingView Technical indicators also reflect a market “cooling down.” The Relative Strength Index (RSI) has recovered to around 40 after entering oversold territory, indicating selling pressure has significantly weakened. Meanwhile, the Stochastic Oscillator has fallen from overbought levels after a strong rebound, suggesting easing correction pressure, but a clear bullish trend confirmation has yet to materialize.
Above, ETH continues to face considerable resistance near the 20-day Exponential Moving Average (EMA) at around $2,040–$2,050, which is limiting recovery efforts. Further out, the 50-day EMA near $2,280 remains a critical barrier, indicating that the medium-term trend still faces significant hurdles despite recent upward movements.
On the technical front, the nearest resistance is around $2,108, coinciding with the recent short-term high and the 20-day EMA. If ETH closes above this level, the price could extend its rally toward $2,388, aiming for higher targets at $2,746.
Conversely, the first key support is at $1,741. Breaking below this level could trigger renewed selling pressure, pushing the price down to $1,524 and $1,404 — the lower bounds of the current trading range.
Disclaimer: The information on this page may come from third parties and does not represent the views or opinions of Gate. The content displayed on this page is for reference only and does not constitute any financial, investment, or legal advice. Gate does not guarantee the accuracy or completeness of the information and shall not be liable for any losses arising from the use of this information. Virtual asset investments carry high risks and are subject to significant price volatility. You may lose all of your invested principal. Please fully understand the relevant risks and make prudent decisions based on your own financial situation and risk tolerance. For details, please refer to
Disclaimer.
