XRP Latest Update: Price Surges Past $3.50 Amid New Market Rally

2025-07-21 04:23:23
Beginner
Quick Reads
Leveraging the most recent market data and on-chain analytics from July 2025, this report provides an in-depth analysis of the factors driving XRP’s price above $3.50 and examines its technical patterns and potential future trends. It equips beginners with clear, up-to-date information on XRP and offers actionable trading recommendations.

Recent Price Performance and Trading Volume Trends


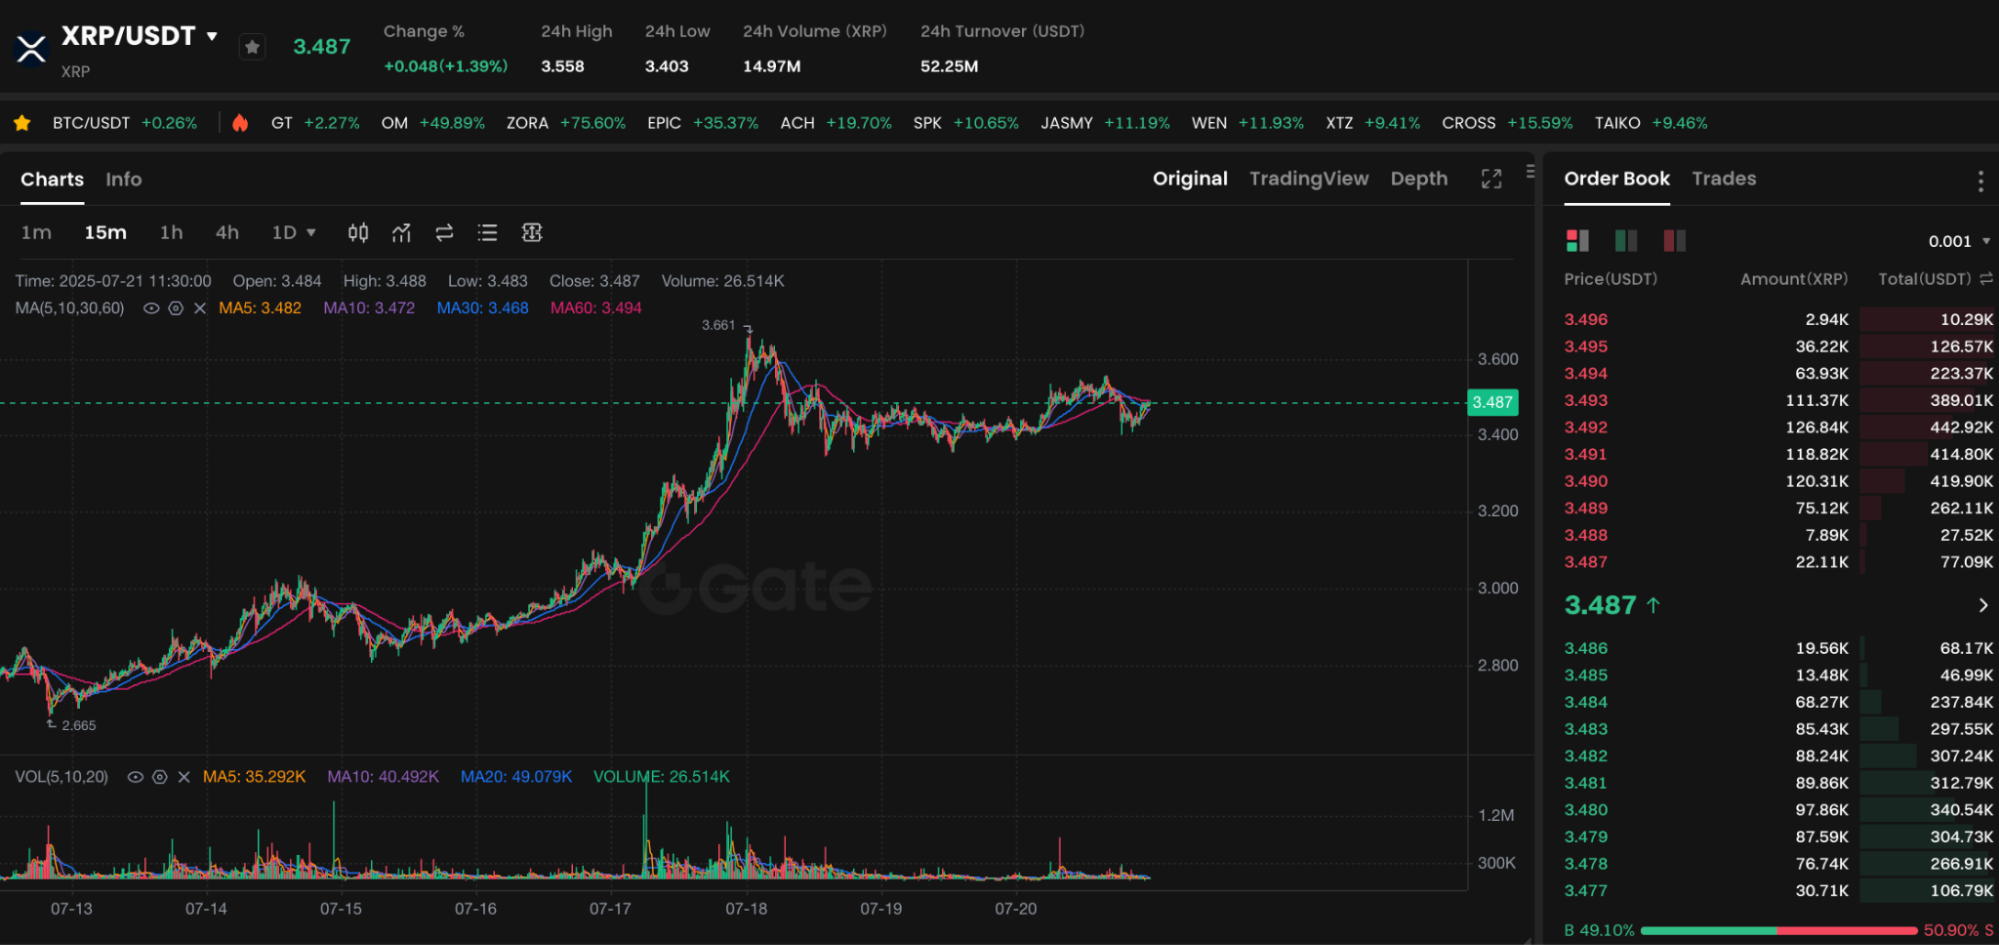
Chart Source: https://www.gate.com/trade/XRP_USDT

Since mid-July 2025, XRP’s price against the US dollar has continued its steady uptrend. On July 21, XRP reached an intraday high of $3.52, gaining over 4% before retracing to close near $3.47. Over the past week, XRP’s price has climbed 12%, marking the highest price since March this year. At the same time, average daily trading volume surged from around $2 billion at the start of July to nearly $3.5 billion, highlighting strong market participation.

Analysis of Key Technical Indicators

  1. Moving Averages: This week, XRP’s 20-day and 50-day moving averages formed a bullish crossover (“golden cross”). The price has remained well above both averages, which confirms a short-term bullish trend.
  2. Relative Strength Index (RSI): The RSI is currently around 68, close to the overbought threshold but still below 70, indicating there is still room for further upside.
  3. Bollinger Bandwidth: The upper Bollinger Band continues to rise while the lower band narrows, which has widened the bandwidth. This signals heightened volatility and increases the likelihood that the bullish trend will persist.
  4. MACD: The MACD fast and slow lines continue to trend upward above the zero line, reinforcing strong bullish momentum.

On-chain Data and Capital Flows

  • Active Addresses: Since mid-July, daily active addresses for XRP have increased from an average of 80,000 to 120,000, indicating a clear influx of new users to the network.
  • Whale Holdings: The number of whale addresses (holding at least 10 million XRP) rose by 15 in the past two weeks, accumulating a total of around 500 million XRP.
  • Exchange Outflows: Major exchanges have seen net XRP outflows totaling 230 million coins. This reduced selling pressure may help support current price levels.

Institutional Positioning and Market Sentiment

Institutional investment products from firms such as BitGo and CoinShares have reported increased holdings, with institutional buying activity dominating the period from July 15 to July 18. According to industry reports, as leading asset managers reevaluate digital assets, XRP—recognized as a benchmark for cross-border payments—is increasingly favored for portfolio allocation. The market’s Fear & Greed Index has rebounded to the “neutral to greedy” range, reflecting a recovery in investor sentiment. However, herd-driven buying remains a risk for latecomers.

Potential Risks and Trading Strategies

  1. Pullback Risk: If the price faces resistance near $3.70 or undergoes a technical correction, monitor support at $3.30 and $3.10.
  2. Macroeconomic Factors: Unexpected global economic events, such as inflation readings significantly above forecasts, could trigger risk-off sentiment and put pressure on XRP prices.
  3. Regulatory Uncertainty: Regulatory frameworks for crypto in the US and other major economies remain unsettled, which could unexpectedly impact market sentiment.
  4. Strategy Recommendations: New investors should consider accumulating in tranches if the price pulls back to the $3.40–$3.45 range, and set stop-loss orders below $3.20. If XRP breaks above $3.70 on strong volume, adding to positions may be appropriate.

Summary

XRP saw a strong rebound in July 2025, breaking above $3.50 and posting successive new highs, driven by bullish technical signals, increased on-chain activity, and growing institutional accumulation. However, all investors should exercise caution. Novice investors should determine position sizes and set stop-losses based on their risk tolerance. Take advantage of pullbacks, and aim for steady progress despite volatility.

Author: Max
Disclaimer
* The information is not intended to be and does not constitute financial advice or any other recommendation of any sort offered or endorsed by Gate.
* This article may not be reproduced, transmitted or copied without referencing Gate. Contravention is an infringement of Copyright Act and may be subject to legal action.

Share

Crypto Calendar
Tokenların Kilidini Aç
Wormhole, 3 Nisan'da 1.280.000.000 W token açacak ve bu, mevcut dolaşımdaki arzın yaklaşık %28,39'unu oluşturacak.
W
-7.32%
2026-04-02
Tokenların Kilidini Aç
Pyth Network, 19 May'da 2.130.000.000 PYTH tokenini serbest bırakacak ve bu, mevcut dolaşım arzının yaklaşık %36,96'sını oluşturacak.
PYTH
2.25%
2026-05-18
Tokenların Kilidini Aç
Pump.fun, 12 Temmuz'da 82,500,000,000 PUMP token'ı kilidini açacak ve bu, mevcut dolaşımdaki arzın yaklaşık %23,31'ini oluşturacak.
PUMP
-3.37%
2026-07-11
Token Kilidi Açma
Succinct, 5 Ağustos'ta mevcut dolaşımdaki arzın yaklaşık %104,17'sini oluşturan 208,330,000 PROVE token'ını serbest bırakacak.
PROVE
2026-08-04
sign up guide logosign up guide logo
sign up guide content imgsign up guide content img
Sign Up

Related Articles

What is Fartcoin? All You Need to Know About FARTCOIN
Intermediate

What is Fartcoin? All You Need to Know About FARTCOIN

Fartcoin (FARTCOIN) is a representative meme coin within the Solana ecosystem based on an AI-driven narrative. Its core concept originated from an experiment aimed at exploring the "boundaries between AI Agents and humor." More than just a digital asset with social attributes, the project deeply couples absurd humor culture with on-chain financial logic by integrating autonomous AI interaction models.
2026-03-04 05:38:51
Gold Price Forecast for the Next Five Years: 2026–2030 Trend Outlook and Investment Implications, Could It Reach $6,000?
Beginner

Gold Price Forecast for the Next Five Years: 2026–2030 Trend Outlook and Investment Implications, Could It Reach $6,000?

Analyze current gold price trends alongside authoritative five-year forecasts, integrating an evaluation of market risks and opportunities. This gives investors insight into the potential trajectory of gold prices and the main drivers expected to shape the market over the next five years.
2026-01-26 03:33:33
2026 Silver Price Forecast: Bull Market Continuation or High-Level Pullback? In-Depth Analysis of Silver Candlestick Chart
Beginner

2026 Silver Price Forecast: Bull Market Continuation or High-Level Pullback? In-Depth Analysis of Silver Candlestick Chart

2026 Silver Price Forecast: Latest Outlook This article integrates current market trends, silver candlestick chart analysis, and momentum factors to assess the potential key support and resistance levels, upside targets, and pullback risks for silver prices. The goal is to help investors make informed, rational decisions.
2026-01-28 08:36:39
Crypto Future Profit Calculator: How to Calculate Your Potential Gains
Beginner

Crypto Future Profit Calculator: How to Calculate Your Potential Gains

Crypto Future Profit Calculator helps traders estimate potential earnings from futures contracts by considering entry price, leverage, fees, and market movement.
2025-02-09 17:28:28
Crypto Futures Calculator: Easily Estimate Your Profits & Risks
Beginner

Crypto Futures Calculator: Easily Estimate Your Profits & Risks

Use a crypto futures calculator to estimate profits, risks, and liquidation prices. Optimize your trading strategy with accurate calculations.
2025-02-11 02:25:44
What is Oasis Network (ROSE)?
Beginner

What is Oasis Network (ROSE)?

The Oasis Network is driving the development of Web3 and AI through smart privacy technology. With its privacy protection, high scalability, and cross-chain interoperability, the Oasis Network is providing new possibilities for the future development of decentralized applications.
2025-05-20 09:41:15