XRP is holding strong at the $2.70 support level, with a bullish wedge pattern set to ignite a breakout.

2025-10-14 05:47:06
XRP's price is holding at the $2.70 support level and is displaying a bullish Falling Wedge pattern. This article offers a concise analysis of the technical factors and price trends. It explains XRP's potential for upward movement in terms suitable for beginners.

XRP Current Price Overview


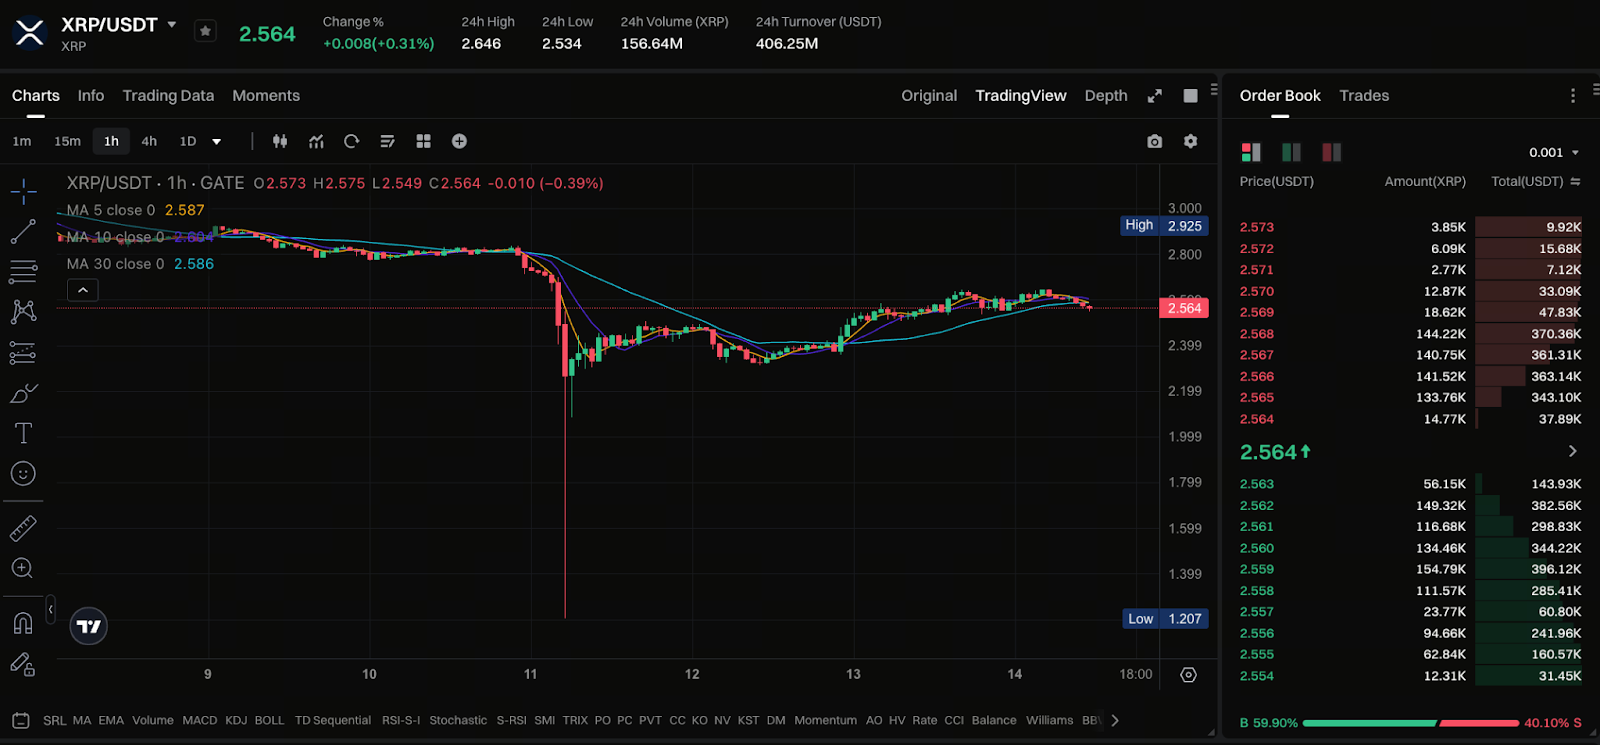
Chart: https://www.gate.com/trade/XRP_USDT

Latest market data shows XRP consolidating near $2.70, finding strong support in this zone. Analysts highlight this area as a critical structural support for XRP; if it breaks, a downward move could follow.

For now, the price remains above this support and is gradually narrowing between the descending trendline and the support level, potentially setting up for the next breakout.

What Is a Falling Wedge? (For Beginners)

The “Falling Wedge” is a technical chart pattern defined by two converging lines connecting a series of declining highs and lows over time.

  • Typically regarded as a bullish reversal or continuation pattern, depending on the prevailing trend
  • Formed during a downtrend, a breakout above the upper boundary may lead to a price rally
  • A surge in trading volume usually confirms a valid breakout

For beginners, noticing price convergence during a downtrend while support holds is a key signal to watch.

XRP Technical Pattern Analysis: Support, Resistance, and Structure

Support: Analysts identify $2.70 as a key support level, repeatedly tested but not decisively breached, indicating robust buying interest.

Resistance / Upper Boundary: The wedge’s upper boundary connects a series of declining highs. It serves as the main resistance for future breakouts. Additional resistance levels may lie at $2.90, $3.00, or higher.

Pattern Structure: XRP’s price is currently converging between the support line and the descending upper boundary—a textbook wedge formation. As price approaches the pattern’s apex, a breakout could result in sharp volatility.

If the price breaks above the upper boundary, it may climb to $2.95 or higher, with upside potential toward $3.50.

If support at $2.70 fails, expect a pullback toward the $2.50–$2.60 range.

Potential Upside Targets and Risk Warnings

  • Upside Targets: A successful breakout above the wedge’s upper boundary could see XRP reach $2.95 and potentially challenge resistance at $3.20, $3.50, and beyond.
  • Risk Warnings: If the price falls below $2.70, the pattern may no longer be valid and XRP could drop to $2.50 or lower.
  • Volume Confirmation: Lack of strong trading volume during a breakout may signal a false move—be aware of potential reversals.
  • Market Conditions: Broader crypto market sentiment, Bitcoin price action, as well as regulatory developments may influence XRP’s price trajectory.

Trading Advice for Beginners

  • Avoid chasing price spikes: Beginners should wait for a confirmed breakout above resistance before entering positions.
  • Set stop-losses: If entering a trade, place stop-loss orders just below support (e.g., slightly under $2.70) to mitigate risk.
  • Position sizing: Avoid excessive leverage to maintain manageable risk.
  • Exercise patience: Wedge breakouts often involve volatility and pullbacks. Be patient and avoid exiting prematurely due to short-term fluctuations.
  • Learn and observe: Closely monitor price behavior in real trading, such as volume surges on breakouts and retest confirmations. This will help you gradually develop informed judgment.
Author: Max
Disclaimer
* The information is not intended to be and does not constitute financial advice or any other recommendation of any sort offered or endorsed by Gate.
* This article may not be reproduced, transmitted or copied without referencing Gate. Contravention is an infringement of Copyright Act and may be subject to legal action.

Share

Crypto Calendar
Tokenların Kilidini Aç
Wormhole, 3 Nisan'da 1.280.000.000 W token açacak ve bu, mevcut dolaşımdaki arzın yaklaşık %28,39'unu oluşturacak.
W
-7.32%
2026-04-02
Tokenların Kilidini Aç
Pyth Network, 19 May'da 2.130.000.000 PYTH tokenini serbest bırakacak ve bu, mevcut dolaşım arzının yaklaşık %36,96'sını oluşturacak.
PYTH
2.25%
2026-05-18
Tokenların Kilidini Aç
Pump.fun, 12 Temmuz'da 82,500,000,000 PUMP token'ı kilidini açacak ve bu, mevcut dolaşımdaki arzın yaklaşık %23,31'ini oluşturacak.
PUMP
-3.37%
2026-07-11
Token Kilidi Açma
Succinct, 5 Ağustos'ta mevcut dolaşımdaki arzın yaklaşık %104,17'sini oluşturan 208,330,000 PROVE token'ını serbest bırakacak.
PROVE
2026-08-04
sign up guide logosign up guide logo
sign up guide content imgsign up guide content img
Sign Up

Related Articles

What is Fartcoin? All You Need to Know About FARTCOIN
Intermediate

What is Fartcoin? All You Need to Know About FARTCOIN

Fartcoin (FARTCOIN) is a representative meme coin within the Solana ecosystem based on an AI-driven narrative. Its core concept originated from an experiment aimed at exploring the "boundaries between AI Agents and humor." More than just a digital asset with social attributes, the project deeply couples absurd humor culture with on-chain financial logic by integrating autonomous AI interaction models.
2026-03-04 05:38:51
Gold Price Forecast for the Next Five Years: 2026–2030 Trend Outlook and Investment Implications, Could It Reach $6,000?
Beginner

Gold Price Forecast for the Next Five Years: 2026–2030 Trend Outlook and Investment Implications, Could It Reach $6,000?

Analyze current gold price trends alongside authoritative five-year forecasts, integrating an evaluation of market risks and opportunities. This gives investors insight into the potential trajectory of gold prices and the main drivers expected to shape the market over the next five years.
2026-01-26 03:33:33
2026 Silver Price Forecast: Bull Market Continuation or High-Level Pullback? In-Depth Analysis of Silver Candlestick Chart
Beginner

2026 Silver Price Forecast: Bull Market Continuation or High-Level Pullback? In-Depth Analysis of Silver Candlestick Chart

2026 Silver Price Forecast: Latest Outlook This article integrates current market trends, silver candlestick chart analysis, and momentum factors to assess the potential key support and resistance levels, upside targets, and pullback risks for silver prices. The goal is to help investors make informed, rational decisions.
2026-01-28 08:36:39
Crypto Future Profit Calculator: How to Calculate Your Potential Gains
Beginner

Crypto Future Profit Calculator: How to Calculate Your Potential Gains

Crypto Future Profit Calculator helps traders estimate potential earnings from futures contracts by considering entry price, leverage, fees, and market movement.
2025-02-09 17:28:28
Gate Alpha Launches Points System: Trade On-Chain, Earn Points, Unlock Airdrops
Beginner

Gate Alpha Launches Points System: Trade On-Chain, Earn Points, Unlock Airdrops

Gate Alpha has officially launched its points mechanism, built around four core strengths: speed, simplicity, quality, and security. It offers a seamless connection between centralized exchange (CEX) and decentralized exchange (DEX) trading ecosystems. Gate Alpha enables users to explore high-quality assets with minimal barriers and trade early-stage, high-potential on-chain tokens directly using USDT from their exchange accounts. The new points mechanism brings strong time sensitivity, diverse user engagement formats, and substantial incentives. As part of a limited three-week Points Carnival, Gate Alpha is rolling out five themed campaigns that deliver multi-layered rewards, including token airdrops, mystery boxes, and access to a prize pool worth hundreds of thousands of dollars. Individual accounts can earn over 130 USDT in rewards during the event.
2025-05-29 05:44:43
Crypto Futures Calculator: Easily Estimate Your Profits & Risks
Beginner

Crypto Futures Calculator: Easily Estimate Your Profits & Risks

Use a crypto futures calculator to estimate profits, risks, and liquidation prices. Optimize your trading strategy with accurate calculations.
2025-02-11 02:25:44