SPK_USDT Price Surges Sharply: Technical Resistance and Trend Analysis

2025-08-07 03:07:53
Beginner
Quick Reads
As of early August 2025, SPK_USDT broke past the 0.12 USDT mark and tested resistance at 0.126 USDT, posting an intraday gain of over 30%. In this article, we review the recent price action and examine key milestones to watch going forward.

What is SPK_USDT

SPK is a cryptocurrency token specializing in the decentralized finance (DeFi) space, designed to bridge DeFi, centralized finance (CeFi), and real-world assets (RWA) to deliver intelligent capital allocation services. Powered by algorithms and smart contracts, SPK allocates funds to high-quality assets and protocols, aiming for more stable returns. The SPK ecosystem is continuously expanding, having recently formed deep partnerships with leading stablecoin projects, which has drawn increased attention from the broader market.

Recent Price Volatility Review


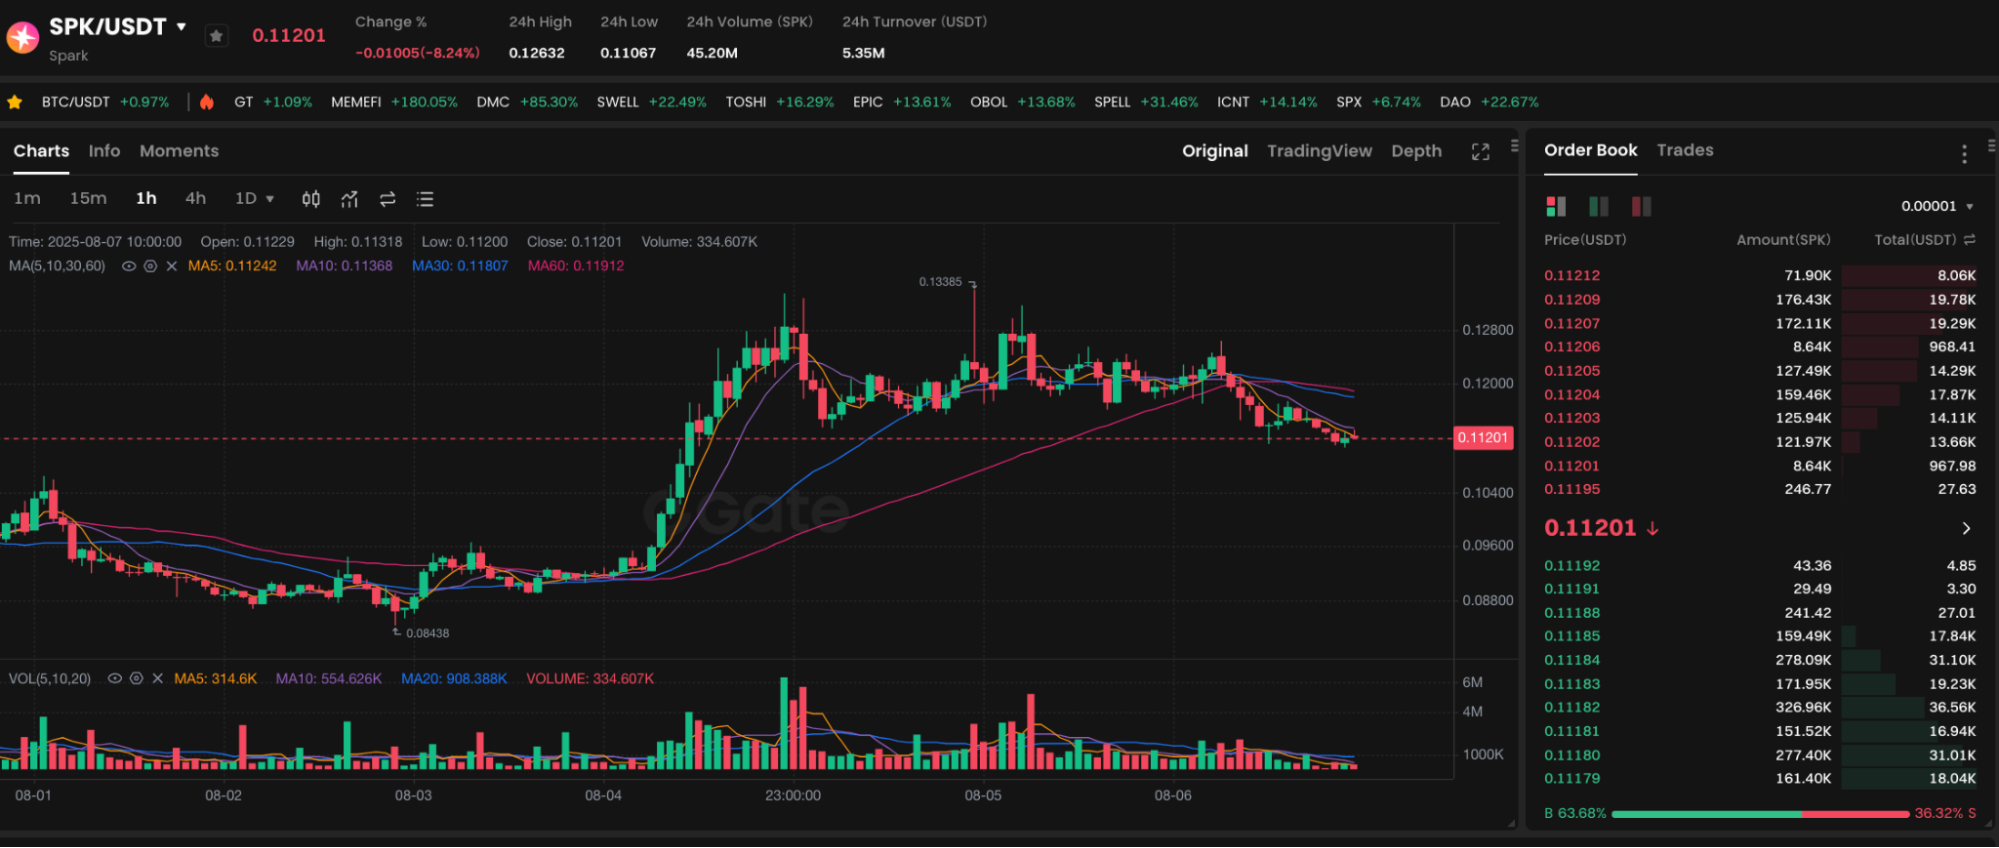
Chart: https://www.gate.com/trade/SPK_USDT

Over the past few days, SPK_USDT has experienced a strong rally, with intraday gains exceeding 30% and attracting significant investor interest. The average price is currently around 0.1167 USDT, with highs reaching 0.125–0.126 USDT. This clearly reflects a short-term bullish momentum. Meanwhile, SPK trading volumes on exchanges have surged, indicating a considerable influx of buying activity.

Technical Indicators and Support/Resistance Levels

  • Support: The 0.0909–0.0890 USDT range has repeatedly attracted strong buying and marked local bottoms, serving as a critical support zone for short-term corrections.
  • Resistance: The 0.120–0.126 USDT range is the major resistance the price currently faces. A sustained break and hold above this zone could signal the beginning of a new upward move, while repeated failed breakouts carry pullback risks.
  • Moving Averages: If short-term moving averages (such as the 7-day and 14-day) form a Golden Cross and move above the medium-term average (such as the 30-day MA), it would further affirm the bullish trend.
  • Volume and RSI: A breakout on high volume reflects strong market conviction and increases the reliability of the move; low volume could signal a potential false breakout. An RSI reading above 70 (overbought) may also warn of short-term pullback risk.

Market Sentiment and Trading Volume Insights

Social media buzz and user engagement on exchanges around SPK have risen sharply, fueled by both short-term speculators and longer-term investors. Significant capital inflows have pushed trading volumes to several hundred million SPK, with USDT turnover reaching tens of millions. This collective market focus likely drives the rapid price increase.

However, when sentiment becomes overly fixated on short-term gains, the risk of a sharp pullback due to excessive optimism also rises. Investors should avoid blindly chasing the rally.

Outlook and Trading Recommendations

If a breakout occurs: Should SPK_USDT hold above the 0.126 USDT level, short-term traders could consider entering with small positions, targeting the next range at 0.15–0.18 USDT. Watch for a price structure involving support, breakout, retest, and reclaim the previous resistance as support.

If facing resistance and pulling back: Multiple failed breakout attempts might lead to a short-term retest of support around 0.10 USDT, or even a pullback to the 0.09 USDT area. Use strict stop-losses and risk control procedures.

Consider the following strategy suggestions:

  • Short-term trading: Best suited for experienced traders. Consider light positions after a confirmed breakout. Set disciplined stop-losses (such as near the prior local low);
  • Mid- to long-term positioning: If you are bullish on SPK’s ecosystem and long-term value, consider a dollar-cost averaging approach. Enter in phases to mitigate the risks of market volatility from one-time investments;
  • Risk management: Apply stop-losses rigorously, avoid being swayed by short-term rallies, and maintain rational decision-making.
Author: Max
Disclaimer
* The information is not intended to be and does not constitute financial advice or any other recommendation of any sort offered or endorsed by Gate.
* This article may not be reproduced, transmitted or copied without referencing Gate. Contravention is an infringement of Copyright Act and may be subject to legal action.

Share

Crypto Calendar
Tokenların Kilidini Aç
Wormhole, 3 Nisan'da 1.280.000.000 W token açacak ve bu, mevcut dolaşımdaki arzın yaklaşık %28,39'unu oluşturacak.
W
-7.32%
2026-04-02
Tokenların Kilidini Aç
Pyth Network, 19 May'da 2.130.000.000 PYTH tokenini serbest bırakacak ve bu, mevcut dolaşım arzının yaklaşık %36,96'sını oluşturacak.
PYTH
2.25%
2026-05-18
Tokenların Kilidini Aç
Pump.fun, 12 Temmuz'da 82,500,000,000 PUMP token'ı kilidini açacak ve bu, mevcut dolaşımdaki arzın yaklaşık %23,31'ini oluşturacak.
PUMP
-3.37%
2026-07-11
Token Kilidi Açma
Succinct, 5 Ağustos'ta mevcut dolaşımdaki arzın yaklaşık %104,17'sini oluşturan 208,330,000 PROVE token'ını serbest bırakacak.
PROVE
2026-08-04
sign up guide logosign up guide logo
sign up guide content imgsign up guide content img
Sign Up

Related Articles

What is Fartcoin? All You Need to Know About FARTCOIN
Intermediate

What is Fartcoin? All You Need to Know About FARTCOIN

Fartcoin (FARTCOIN) is a representative meme coin within the Solana ecosystem based on an AI-driven narrative. Its core concept originated from an experiment aimed at exploring the "boundaries between AI Agents and humor." More than just a digital asset with social attributes, the project deeply couples absurd humor culture with on-chain financial logic by integrating autonomous AI interaction models.
2026-03-04 05:38:51
Gold Price Forecast for the Next Five Years: 2026–2030 Trend Outlook and Investment Implications, Could It Reach $6,000?
Beginner

Gold Price Forecast for the Next Five Years: 2026–2030 Trend Outlook and Investment Implications, Could It Reach $6,000?

Analyze current gold price trends alongside authoritative five-year forecasts, integrating an evaluation of market risks and opportunities. This gives investors insight into the potential trajectory of gold prices and the main drivers expected to shape the market over the next five years.
2026-01-26 03:33:33
2026 Silver Price Forecast: Bull Market Continuation or High-Level Pullback? In-Depth Analysis of Silver Candlestick Chart
Beginner

2026 Silver Price Forecast: Bull Market Continuation or High-Level Pullback? In-Depth Analysis of Silver Candlestick Chart

2026 Silver Price Forecast: Latest Outlook This article integrates current market trends, silver candlestick chart analysis, and momentum factors to assess the potential key support and resistance levels, upside targets, and pullback risks for silver prices. The goal is to help investors make informed, rational decisions.
2026-01-28 08:36:39
Crypto Future Profit Calculator: How to Calculate Your Potential Gains
Beginner

Crypto Future Profit Calculator: How to Calculate Your Potential Gains

Crypto Future Profit Calculator helps traders estimate potential earnings from futures contracts by considering entry price, leverage, fees, and market movement.
2025-02-09 17:28:28
Crypto Futures Calculator: Easily Estimate Your Profits & Risks
Beginner

Crypto Futures Calculator: Easily Estimate Your Profits & Risks

Use a crypto futures calculator to estimate profits, risks, and liquidation prices. Optimize your trading strategy with accurate calculations.
2025-02-11 02:25:44
What is Oasis Network (ROSE)?
Beginner

What is Oasis Network (ROSE)?

The Oasis Network is driving the development of Web3 and AI through smart privacy technology. With its privacy protection, high scalability, and cross-chain interoperability, the Oasis Network is providing new possibilities for the future development of decentralized applications.
2025-05-20 09:41:15